| Param | Original file | Final file |
|---|---|---|
| Filename | modeM0/AS1A09_131T01_9000004696_32266cztM0_level2.evt | modeM0/AS1A09_131T01_9000004696_32266cztM0_level2_quad_clean.evt |
| Size (bytes) | 902,609,280 | 129,038,400 |
| Size | 860.8 MB | 123.1 MB |
| Events in quadrant A | 3,249,211 | 921,898 |
| Events in quadrant B | 5,410,698 | 939,936 |
| Events in quadrant C | 3,624,967 | 924,474 |
| Events in quadrant D | 14,607,978 | 661,821 |
| Mode SS | |||
|---|---|---|---|
| Quadrant | BADHDUFLAG | Total packets | Discarded packets |
| A | 0 | 132 | 0 |
| B | 0 | 132 | 0 |
| C | 0 | 132 | 0 |
| D | 0 | 132 | 0 |
| Mode M9 | |||
|---|---|---|---|
| Quadrant | BADHDUFLAG | Total packets | Discarded packets |
| A | 0 | 18 | 0 |
| B | 0 | 19 | 0 |
| C | 0 | 19 | 0 |
| D | 0 | 19 | 0 |
| Mode M0 | |||
|---|---|---|---|
| Quadrant | BADHDUFLAG | Total packets | Discarded packets |
| A | 0 | 13897 | 2 |
| B | 0 | 20828 | 2 |
| C | 0 | 14981 | 2 |
| D | 0 | 47897 | 2 |
| Quadrant | Total seconds | Saturated seconds | Saturation percentage |
|---|---|---|---|
| A | 6575 | 47 | 0.714829% |
| B | 6575 | 214 | 3.254753% |
| C | 6575 | 287 | 4.365019% |
| D | 6575 | 4390 | 66.768061% |
Noise dominated data is calculated using 1-second bins in cleaned event files. If a bin has >2000 counts, and if more than 50% of those come from <1% of pixels, then it is considered to be noise-dominated and hence unusable.
| Quadrant | # 1 sec bins | Bins with >0 counts | Bins with >2000 counts | High rate bins dominated by noise | Noise dominated (total time) | Noise dominated (detector-on time) | Marked lightcurve |
|---|---|---|---|---|---|---|---|
| A | 7875 | 6576 | 0 | 0 | 0.00% | 0.00% | 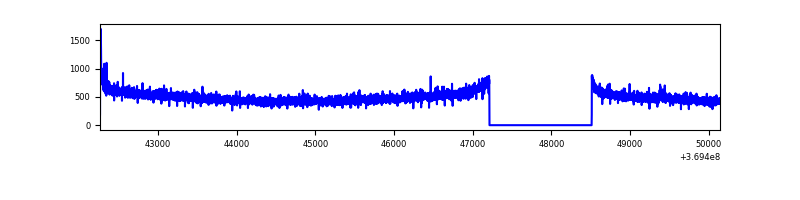 |
| B | 7875 | 6576 | 47 | 47 | 0.60% | 0.71% | 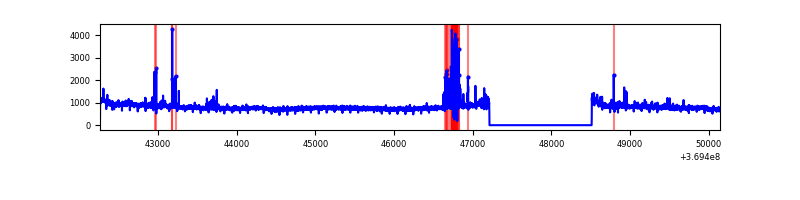 |
| C | 7875 | 6576 | 21 | 21 | 0.27% | 0.32% | 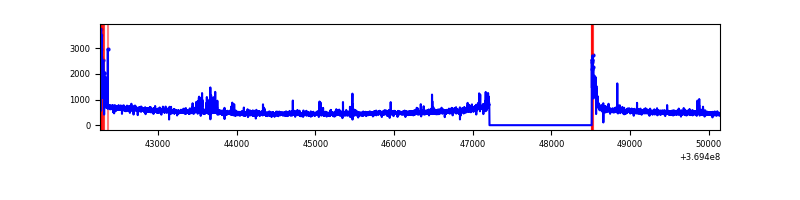 |
| D | 7875 | 6576 | 5332 | 5332 | 67.71% | 81.08% | 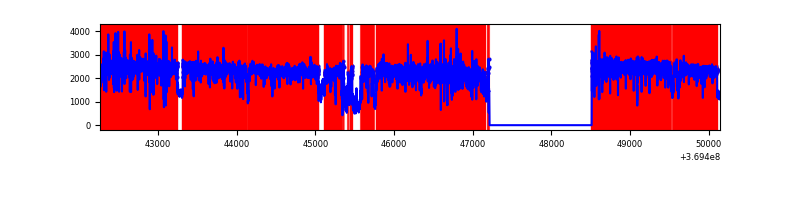 |
Top three noisy pixels from each quadrant. If the there are fewer than three noisy pixels in the level2.evt file, extra rows are filled as -1
| Pixel properties | Quadrant properties | ||||||
|---|---|---|---|---|---|---|---|
| Quadrant | DetID | PixID | Counts | Sigma | Mean | Median | Sigma |
| A | 13 | 6 | 18401 | 106.91 | 830 | 813 | 164.5 |
| A | 8 | 205 | 14760 | 84.78 | 830 | 813 | 164.5 |
| A | 13 | 254 | 12847 | 73.15 | 830 | 813 | 164.5 |
| B | 6 | 159 | 1872969 | 12336.57 | 830 | 810 | 151.8 |
| B | 5 | 172 | 198415 | 1302.12 | 830 | 810 | 151.8 |
| B | 0 | 245 | 22563 | 143.34 | 830 | 810 | 151.8 |
| C | 0 | 10 | 167417 | 894.57 | 809 | 819 | 186.2 |
| C | 14 | 238 | 165780 | 885.78 | 809 | 819 | 186.2 |
| C | 14 | 254 | 46795 | 246.87 | 809 | 819 | 186.2 |
| D | 1 | 52 | 10361085 | 66826.62 | 655 | 638 | 155.0 |
| D | 8 | 195 | 1055548 | 6804.35 | 655 | 638 | 155.0 |
| D | 12 | 218 | 297391 | 1914.11 | 655 | 638 | 155.0 |
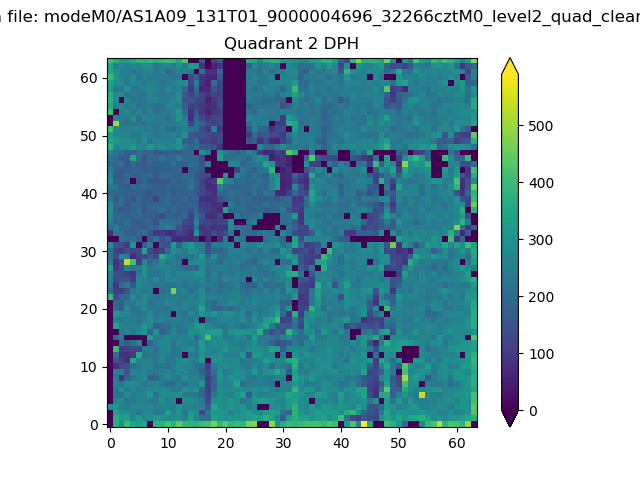
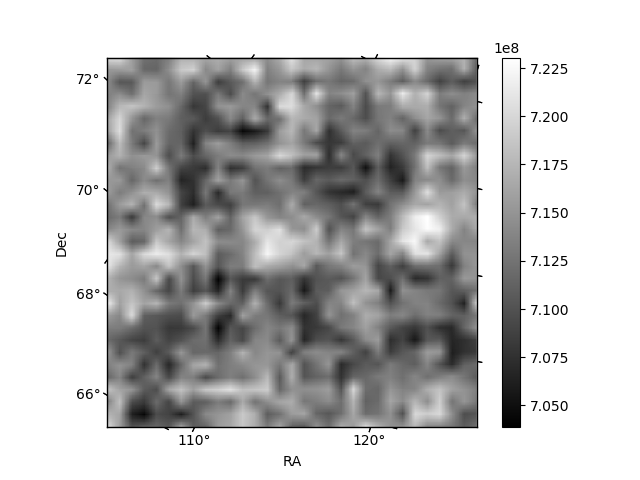
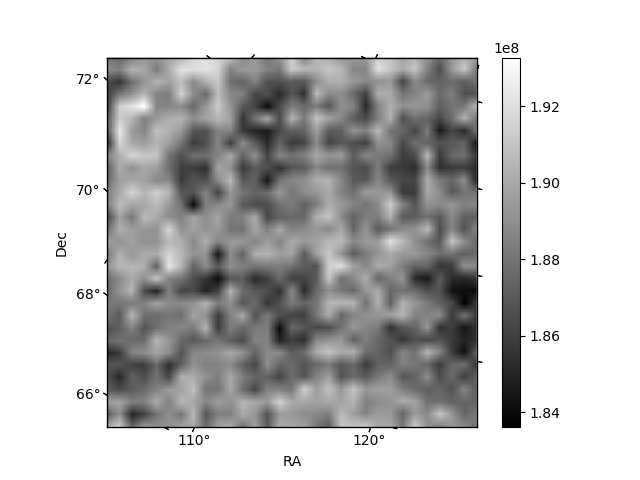
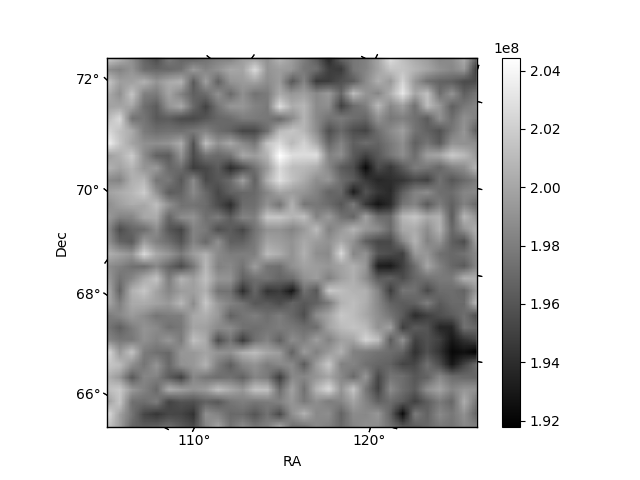
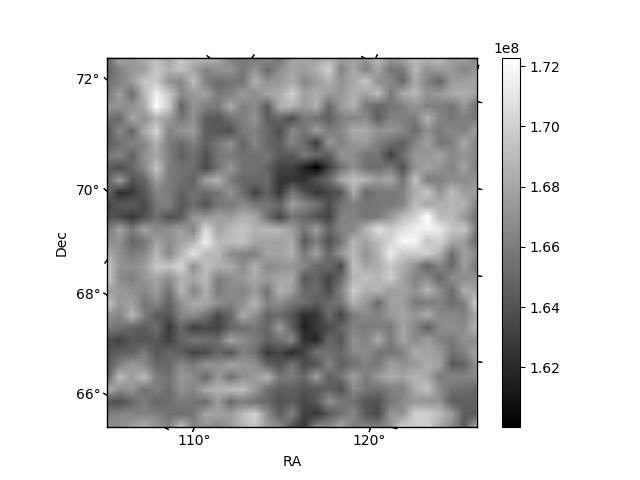
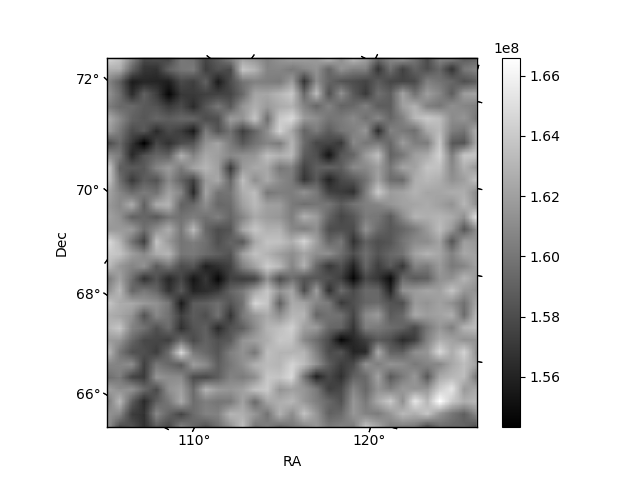
Histogram calculated using DETX and DETY for each event in the final _common_clean file
| Quadrant A | 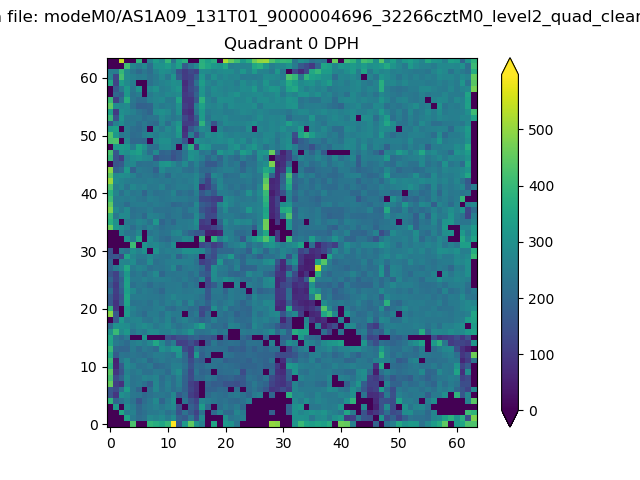 |
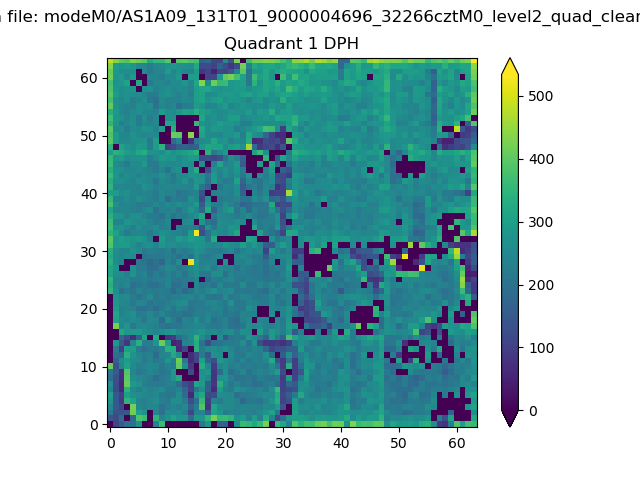 |
Quadrant B |
|---|---|---|---|
| Quadrant D | 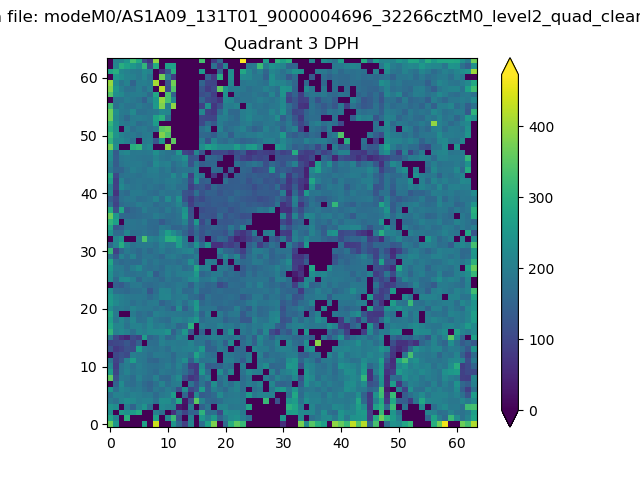 |
 |
Quadrant C |
| Plot type | Count rate plots | Images |
|---|---|---|
| Comparison with Poisson distribution Blue bars denote a histogram of data divided into 1 sec bins. Red curve is a Poisson curve with rate = median count rate of data. |
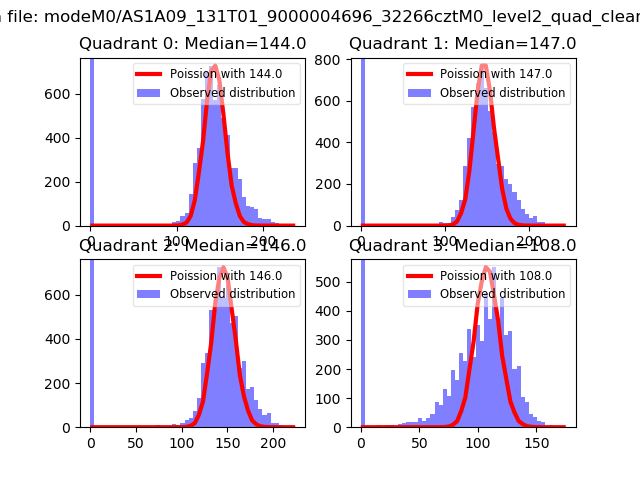 |
 |
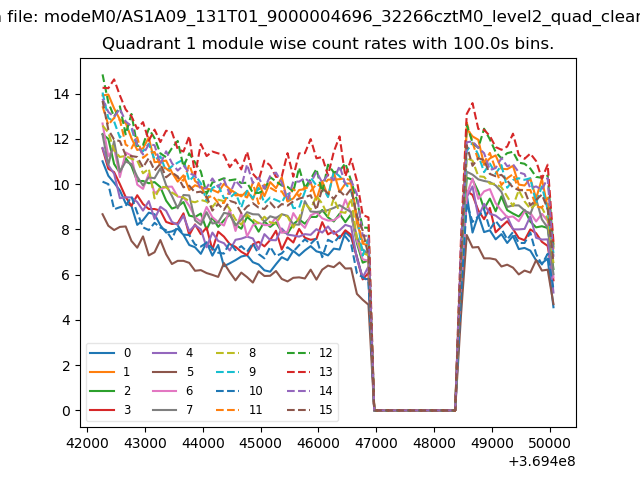
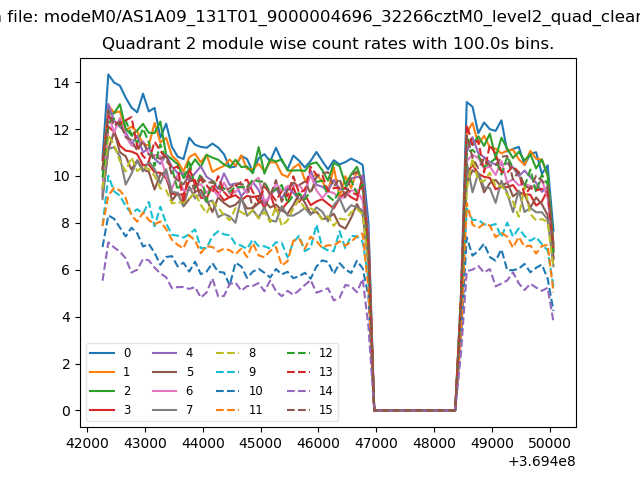
| Quadrant-wise count rates Data is divided into 100 sec bins |
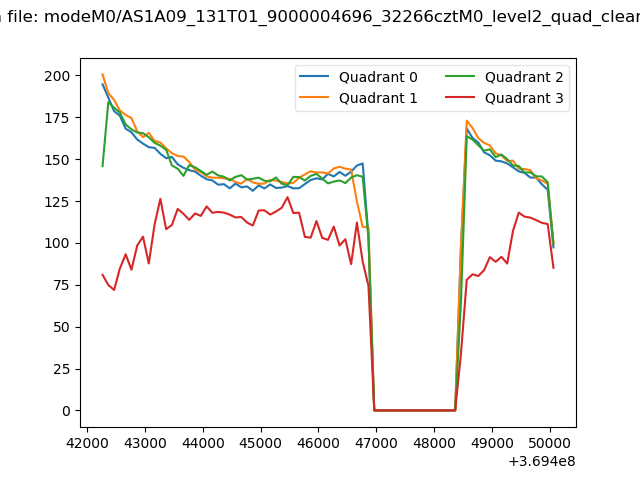 |
|
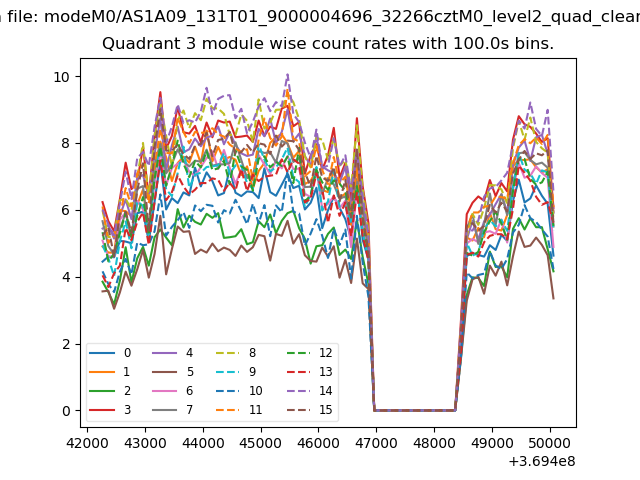
| Module-wise count rates for Quadrant A Data is divided into 100 sec bins |
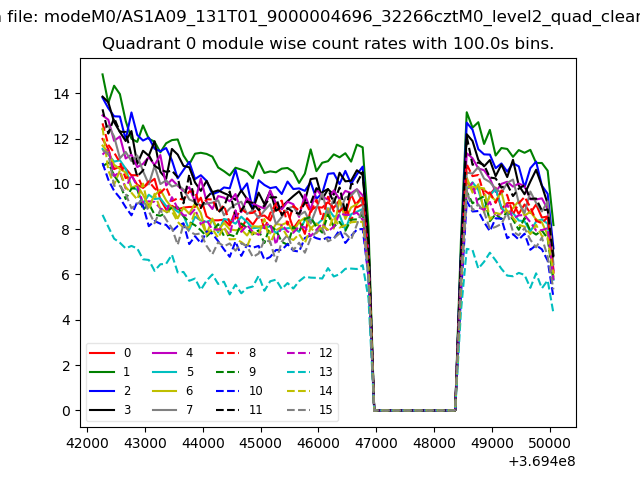 |
 |
| Module-wise count rates for Quadrant B Data is divided into 100 sec bins |
 |
 |
| Module-wise count rates for Quadrant C Data is divided into 100 sec bins |
 |
 |
| Module-wise count rates for Quadrant D Data is divided into 100 sec bins |
 |
 |
| Parameter | Plot |
|---|---|
| CZT HV Monitor | 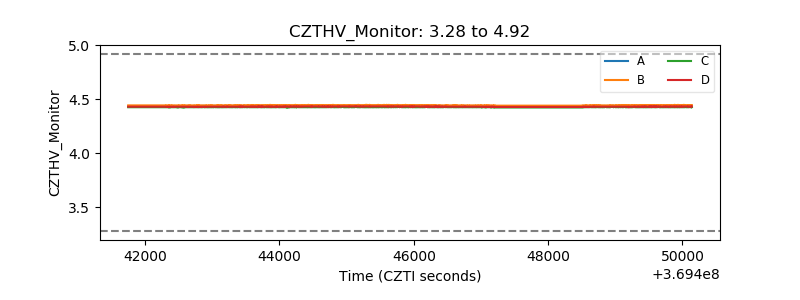 |
| D_VDD | 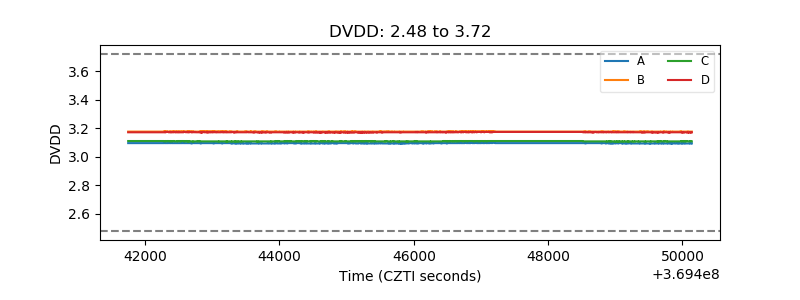 |
| Temperature 1 | 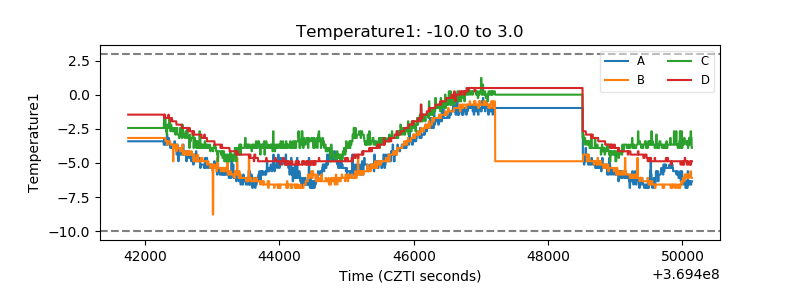 |
| Veto HV Monitor | 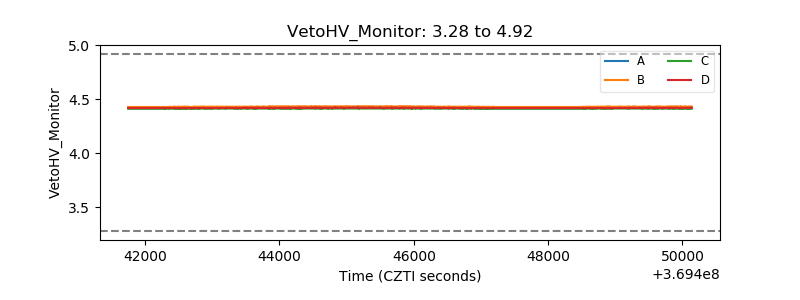 |
| Veto LLD | 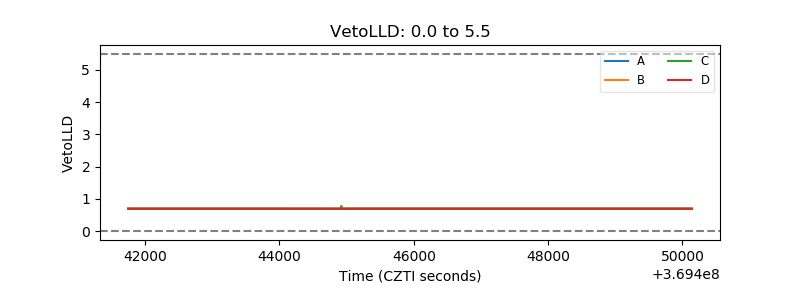 |
| Alpha Counter | 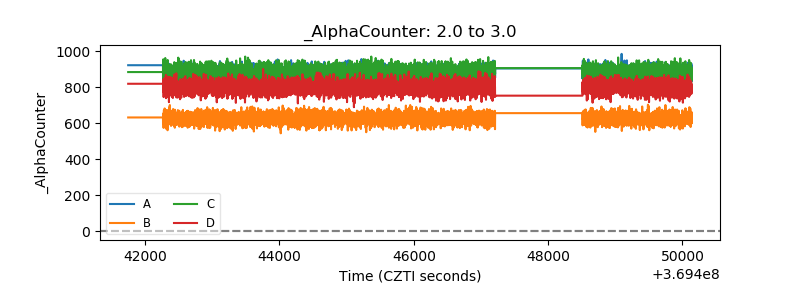 |
| _CPM_Rate | 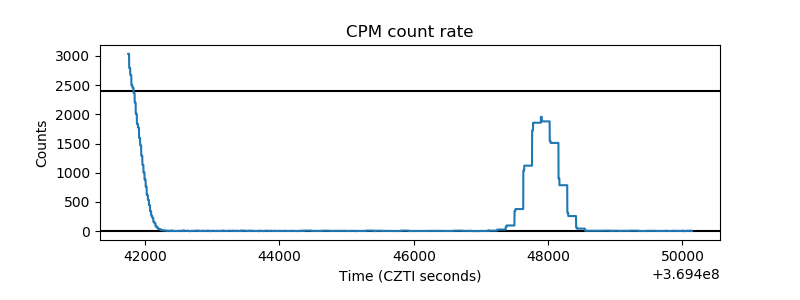 |
| CZT Counter | 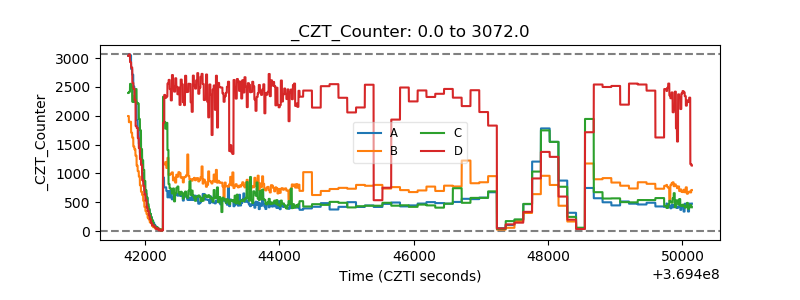 |
| +2.5 Volts monitor |  |
| +5 Volts monitor |  |
| _ROLL_ROT | 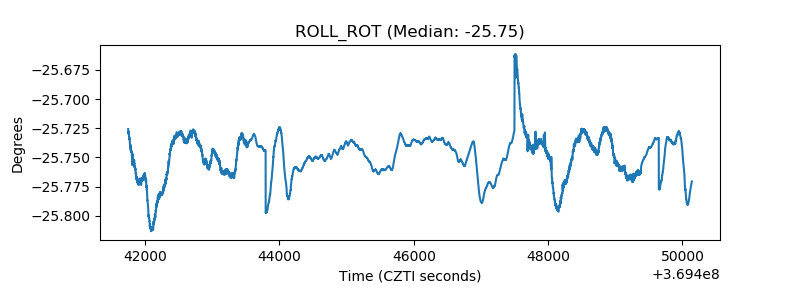 |
| _Roll_DEC | 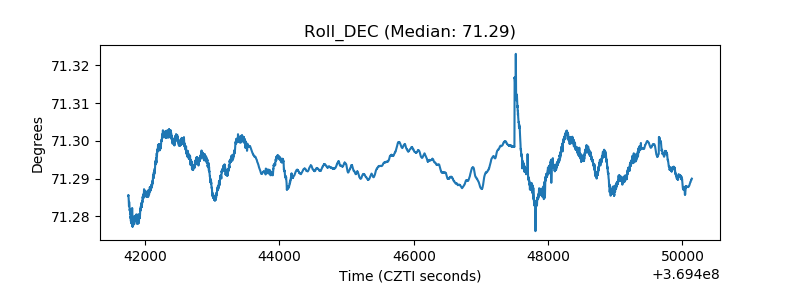 |
| _Roll_RA | 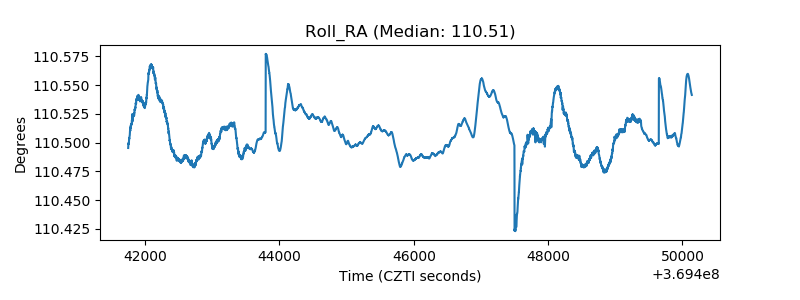 |
| Veto Counter | 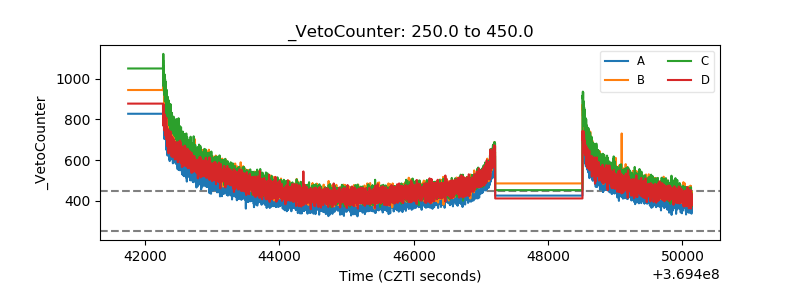 |