| Param | Original file | Final file |
|---|---|---|
| Filename | modeM0/AS1A09_131T01_9000004696_32267cztM0_level2.evt | modeM0/AS1A09_131T01_9000004696_32267cztM0_level2_quad_clean.evt |
| Size (bytes) | 825,016,320 | 110,321,280 |
| Size | 786.8 MB | 105.2 MB |
| Events in quadrant A | 3,005,502 | 760,238 |
| Events in quadrant B | 5,024,078 | 774,004 |
| Events in quadrant C | 3,324,039 | 763,171 |
| Events in quadrant D | 13,196,582 | 592,028 |
| Mode SS | |||
|---|---|---|---|
| Quadrant | BADHDUFLAG | Total packets | Discarded packets |
| A | 0 | 130 | 0 |
| B | 0 | 130 | 0 |
| C | 0 | 130 | 0 |
| D | 0 | 130 | 0 |
| Mode M9 | |||
|---|---|---|---|
| Quadrant | BADHDUFLAG | Total packets | Discarded packets |
| A | 0 | 12 | 0 |
| B | 0 | 12 | 0 |
| C | 0 | 12 | 0 |
| D | 0 | 12 | 0 |
| Mode M0 | |||
|---|---|---|---|
| Quadrant | BADHDUFLAG | Total packets | Discarded packets |
| A | 0 | 13245 | 0 |
| B | 0 | 19678 | 0 |
| C | 0 | 14017 | 0 |
| D | 0 | 43608 | 1 |
| Quadrant | Total seconds | Saturated seconds | Saturation percentage |
|---|---|---|---|
| A | 6462 | 11 | 0.170226% |
| B | 6463 | 94 | 1.454433% |
| C | 6463 | 127 | 1.965032% |
| D | 6462 | 3494 | 54.069947% |
Noise dominated data is calculated using 1-second bins in cleaned event files. If a bin has >2000 counts, and if more than 50% of those come from <1% of pixels, then it is considered to be noise-dominated and hence unusable.
| Quadrant | # 1 sec bins | Bins with >0 counts | Bins with >2000 counts | High rate bins dominated by noise | Noise dominated (total time) | Noise dominated (detector-on time) | Marked lightcurve |
|---|---|---|---|---|---|---|---|
| A | 7577 | 6463 | 0 | 0 | 0.00% | 0.00% | 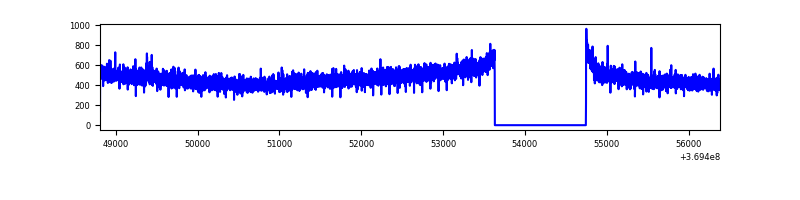 |
| B | 7578 | 6464 | 2 | 2 | 0.03% | 0.03% | 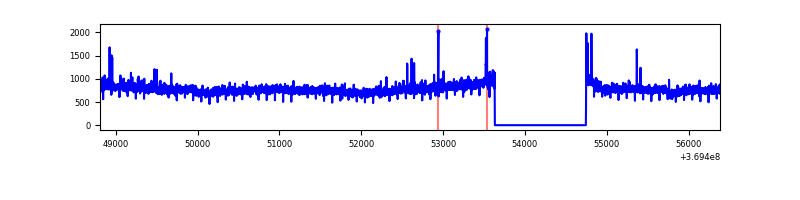 |
| C | 7578 | 6464 | 12 | 12 | 0.16% | 0.19% | 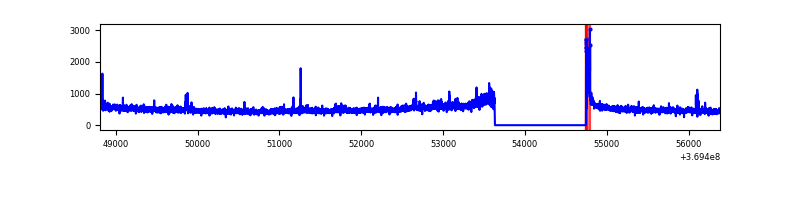 |
| D | 7577 | 6463 | 4564 | 4564 | 60.23% | 70.62% | 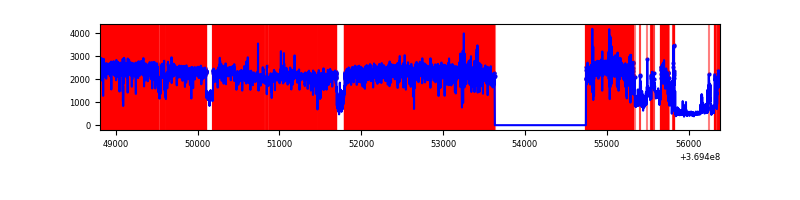 |
Top three noisy pixels from each quadrant. If the there are fewer than three noisy pixels in the level2.evt file, extra rows are filled as -1
| Pixel properties | Quadrant properties | ||||||
|---|---|---|---|---|---|---|---|
| Quadrant | DetID | PixID | Counts | Sigma | Mean | Median | Sigma |
| A | 13 | 6 | 16036 | 99.08 | 773 | 760 | 154.2 |
| A | 13 | 254 | 12379 | 75.36 | 773 | 760 | 154.2 |
| A | 3 | 137 | 7651 | 44.7 | 773 | 760 | 154.2 |
| B | 6 | 159 | 1874818 | 12874.14 | 777 | 758 | 145.6 |
| B | 5 | 172 | 31191 | 209.06 | 777 | 758 | 145.6 |
| B | 0 | 229 | 18460 | 121.61 | 777 | 758 | 145.6 |
| C | 14 | 238 | 129026 | 736.65 | 751 | 757 | 174.1 |
| C | 0 | 10 | 113132 | 645.37 | 751 | 757 | 174.1 |
| C | 3 | 233 | 97482 | 555.49 | 751 | 757 | 174.1 |
| D | 1 | 52 | 9232568 | 61561.04 | 632 | 614 | 150.0 |
| D | 8 | 195 | 1070413 | 7133.69 | 632 | 614 | 150.0 |
| D | 12 | 218 | 217039 | 1443.18 | 632 | 614 | 150.0 |
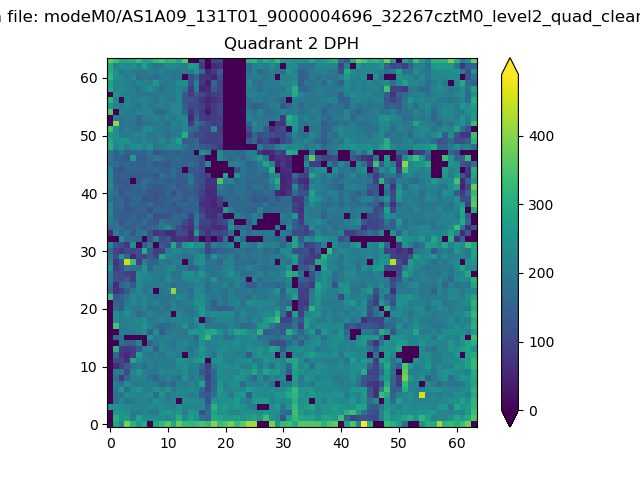
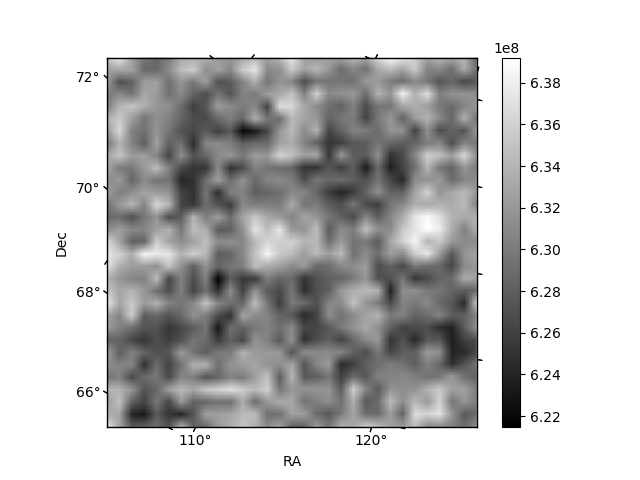
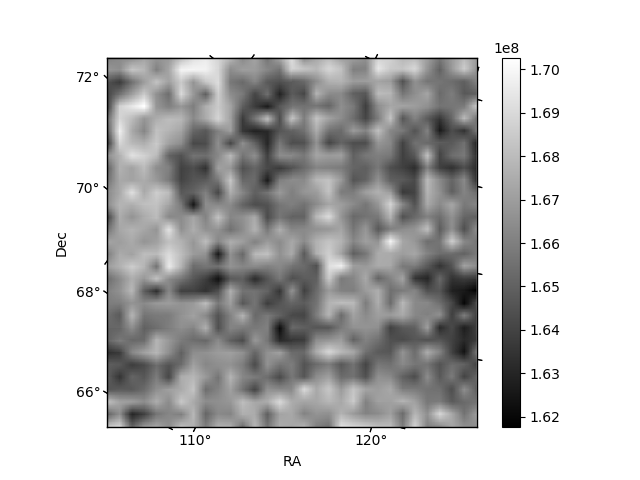
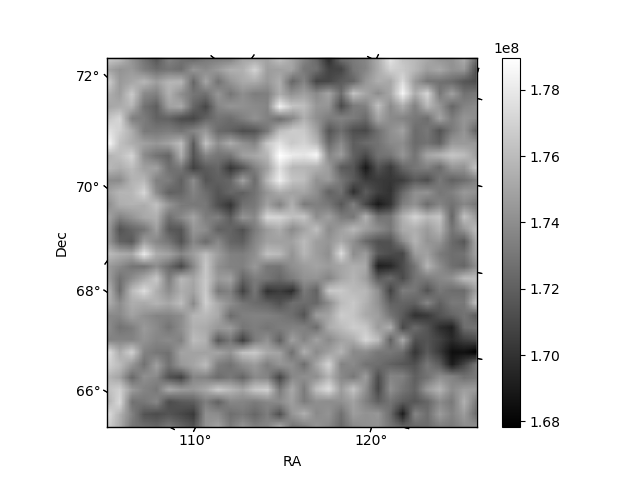
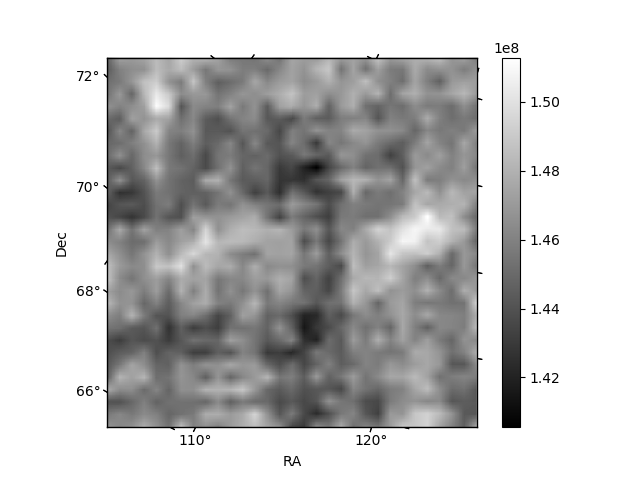
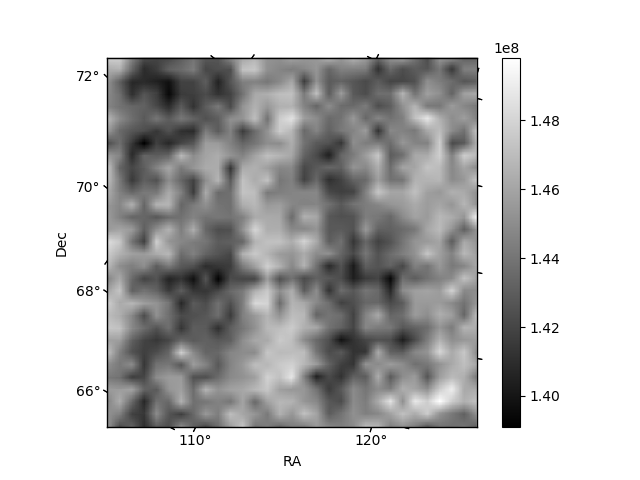
Histogram calculated using DETX and DETY for each event in the final _common_clean file
| Quadrant A | 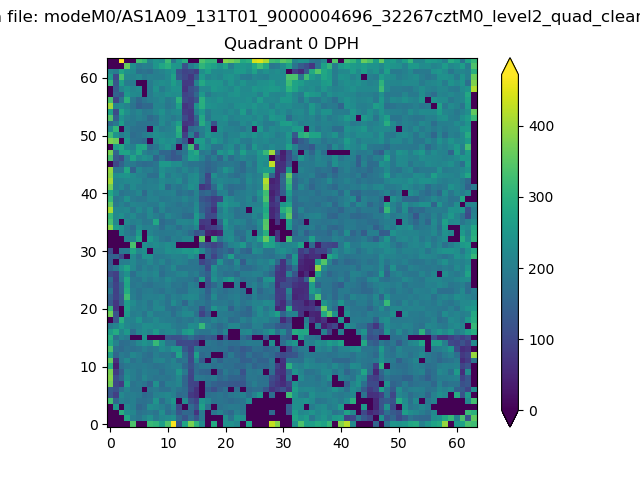 |
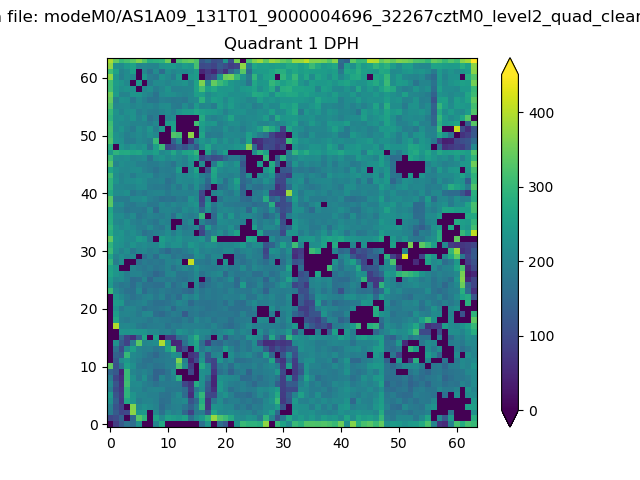 |
Quadrant B |
|---|---|---|---|
| Quadrant D | 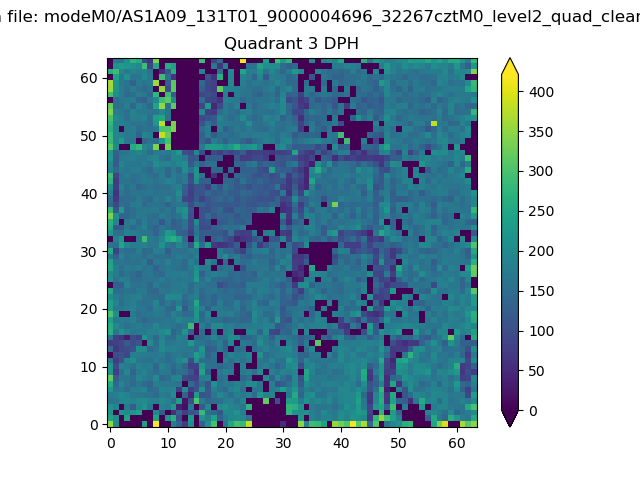 |
 |
Quadrant C |
| Plot type | Count rate plots | Images |
|---|---|---|
| Comparison with Poisson distribution Blue bars denote a histogram of data divided into 1 sec bins. Red curve is a Poisson curve with rate = median count rate of data. |
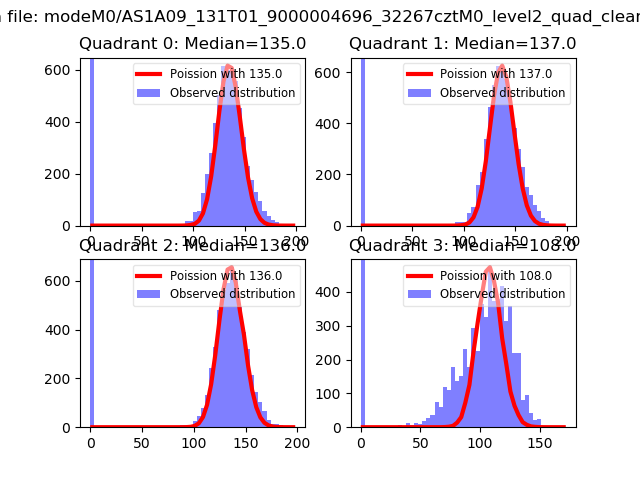 |
 |
| Quadrant-wise count rates Data is divided into 100 sec bins |
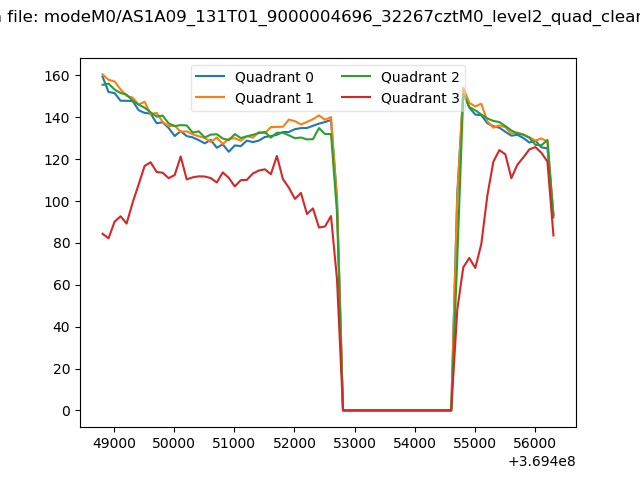 |
|
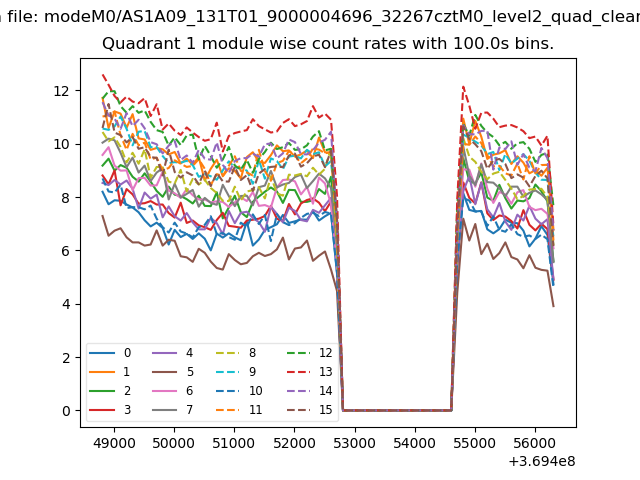
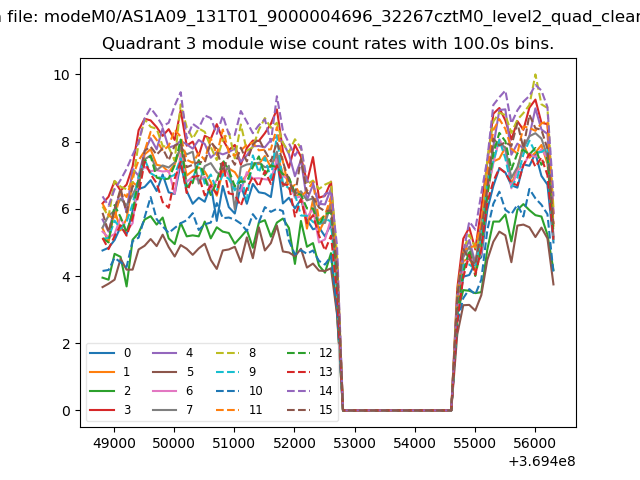
| Module-wise count rates for Quadrant A Data is divided into 100 sec bins |
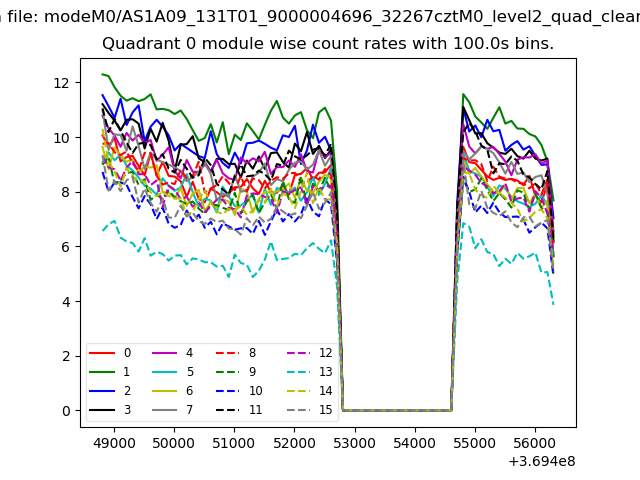 |
 |
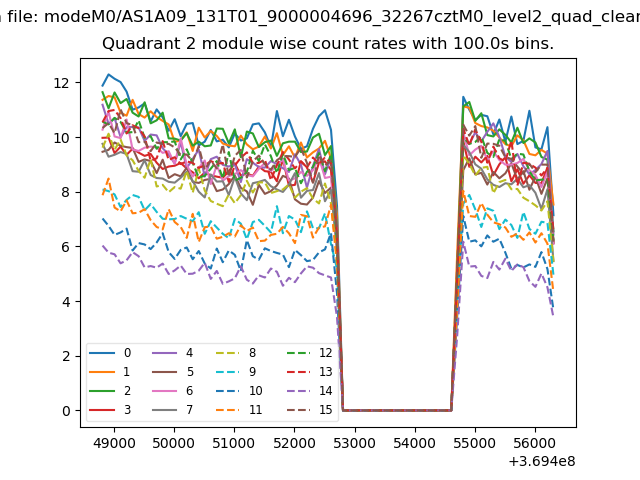
| Module-wise count rates for Quadrant B Data is divided into 100 sec bins |
 |
 |
| Module-wise count rates for Quadrant C Data is divided into 100 sec bins |
 |
 |
| Module-wise count rates for Quadrant D Data is divided into 100 sec bins |
 |
 |
| Parameter | Plot |
|---|---|
| CZT HV Monitor |  |
| D_VDD | 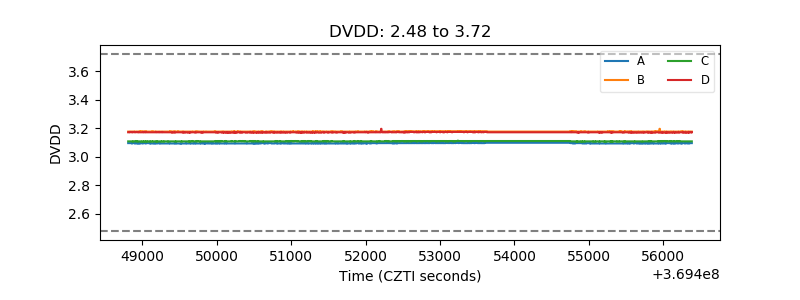 |
| Temperature 1 | 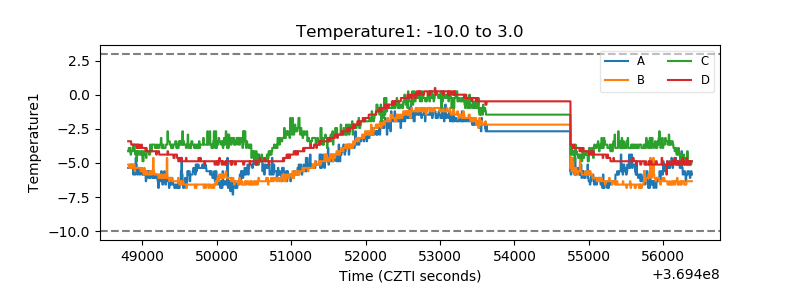 |
| Veto HV Monitor | 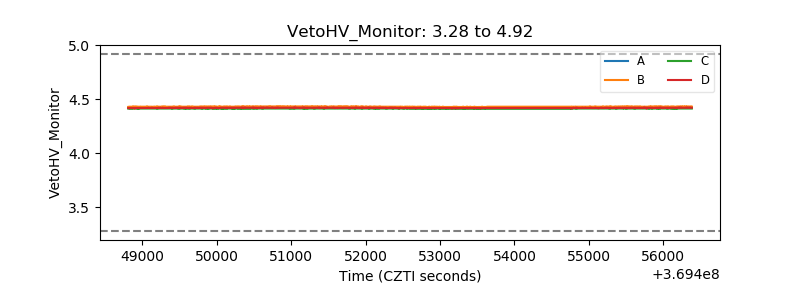 |
| Veto LLD | 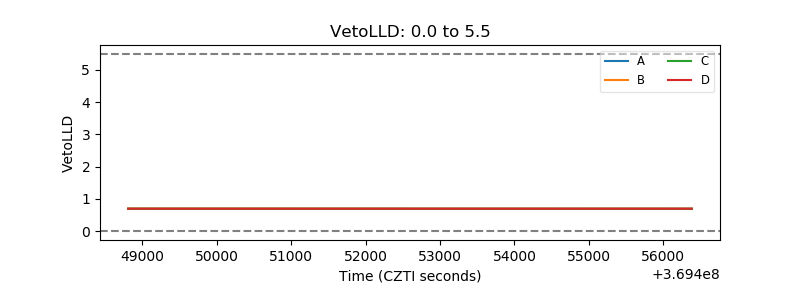 |
| Alpha Counter | 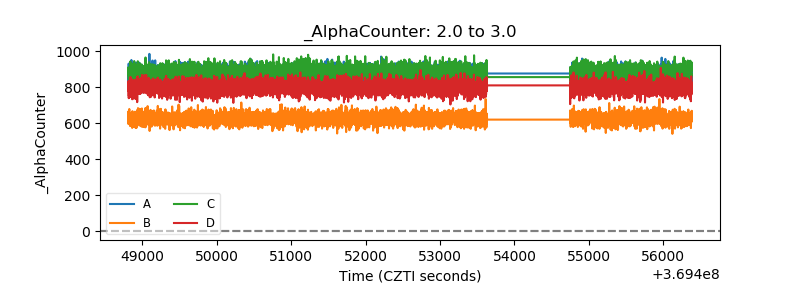 |
| _CPM_Rate | 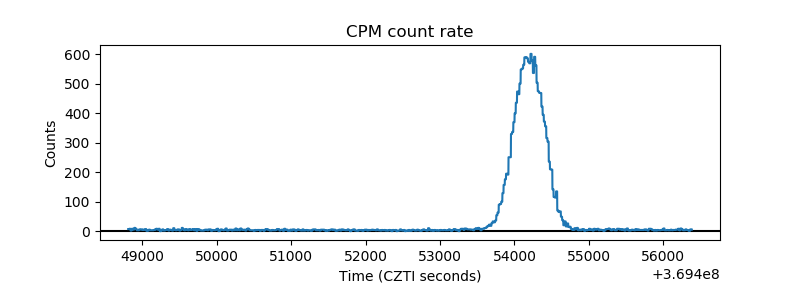 |
| CZT Counter | 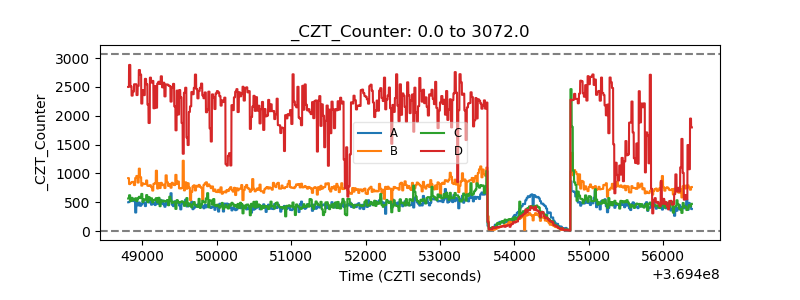 |
| +2.5 Volts monitor | 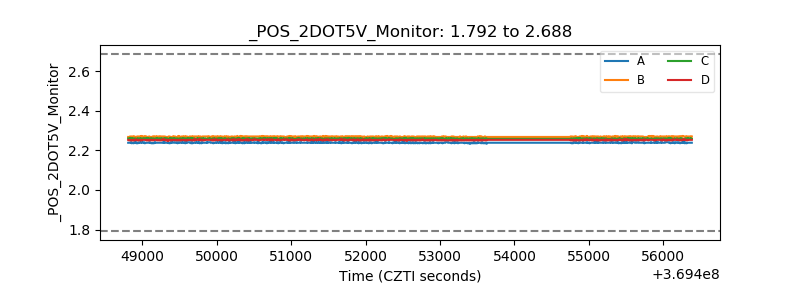 |
| +5 Volts monitor | 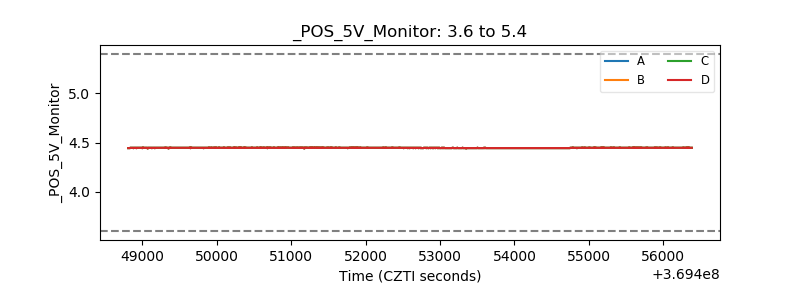 |
| _ROLL_ROT | 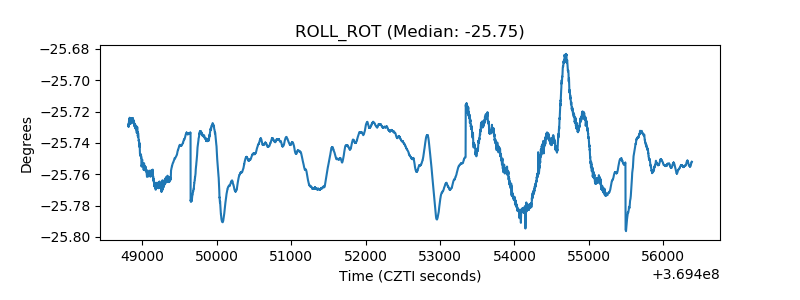 |
| _Roll_DEC | 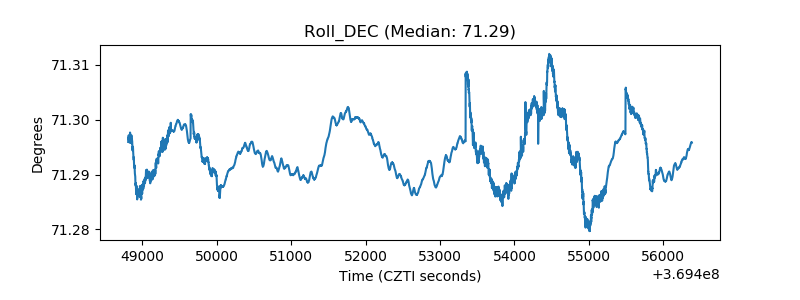 |
| _Roll_RA | 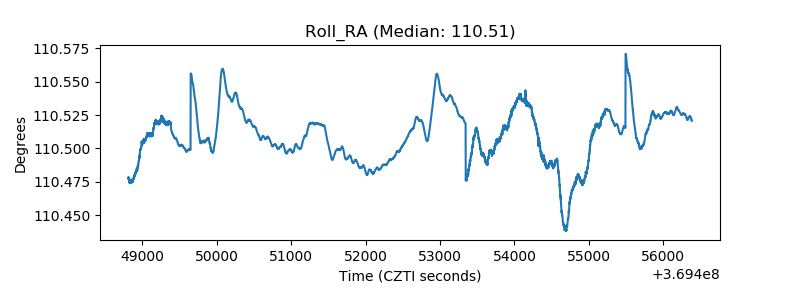 |
| Veto Counter | 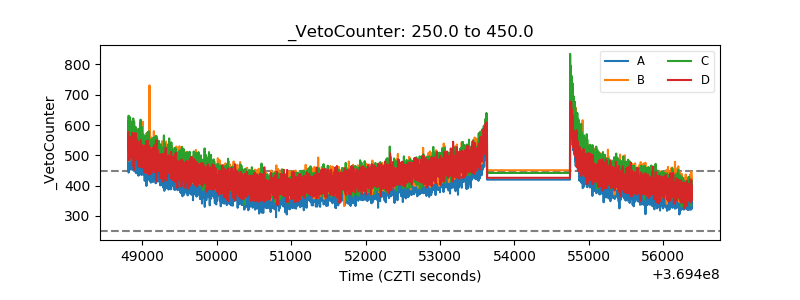 |