| Param | Original file | Final file |
|---|---|---|
| Filename | modeM0/AS1A09_131T01_9000004696_32268cztM0_level2.evt | modeM0/AS1A09_131T01_9000004696_32268cztM0_level2_quad_clean.evt |
| Size (bytes) | 851,754,240 | 114,762,240 |
| Size | 812.3 MB | 109.4 MB |
| Events in quadrant A | 3,258,617 | 786,858 |
| Events in quadrant B | 5,506,994 | 793,178 |
| Events in quadrant C | 3,696,749 | 782,071 |
| Events in quadrant D | 12,858,018 | 621,995 |
| Mode SS | |||
|---|---|---|---|
| Quadrant | BADHDUFLAG | Total packets | Discarded packets |
| A | 0 | 142 | 0 |
| B | 0 | 142 | 0 |
| C | 0 | 142 | 0 |
| D | 0 | 142 | 0 |
| Mode M9 | |||
|---|---|---|---|
| Quadrant | BADHDUFLAG | Total packets | Discarded packets |
| A | 0 | 8 | 0 |
| B | 0 | 8 | 0 |
| C | 0 | 8 | 0 |
| D | 0 | 8 | 0 |
| Mode M0 | |||
|---|---|---|---|
| Quadrant | BADHDUFLAG | Total packets | Discarded packets |
| A | 0 | 14481 | 1 |
| B | 0 | 21671 | 1 |
| C | 0 | 15657 | 1 |
| D | 0 | 42984 | 1 |
| Quadrant | Total seconds | Saturated seconds | Saturation percentage |
|---|---|---|---|
| A | 7042 | 32 | 0.454416% |
| B | 7043 | 152 | 2.158171% |
| C | 7043 | 158 | 2.243362% |
| D | 7043 | 3609 | 51.242368% |
Noise dominated data is calculated using 1-second bins in cleaned event files. If a bin has >2000 counts, and if more than 50% of those come from <1% of pixels, then it is considered to be noise-dominated and hence unusable.
| Quadrant | # 1 sec bins | Bins with >0 counts | Bins with >2000 counts | High rate bins dominated by noise | Noise dominated (total time) | Noise dominated (detector-on time) | Marked lightcurve |
|---|---|---|---|---|---|---|---|
| A | 7802 | 7043 | 0 | 0 | 0.00% | 0.00% | 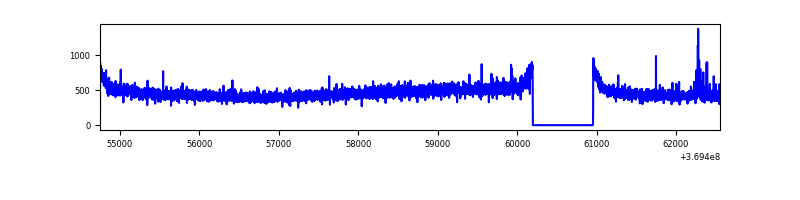 |
| B | 7803 | 7044 | 30 | 30 | 0.38% | 0.43% | 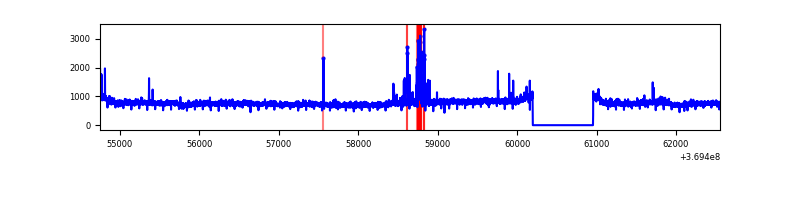 |
| C | 7803 | 7044 | 14 | 14 | 0.18% | 0.20% | 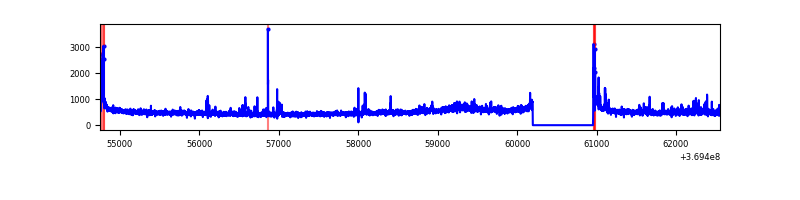 |
| D | 7803 | 7044 | 3785 | 3785 | 48.51% | 53.73% | 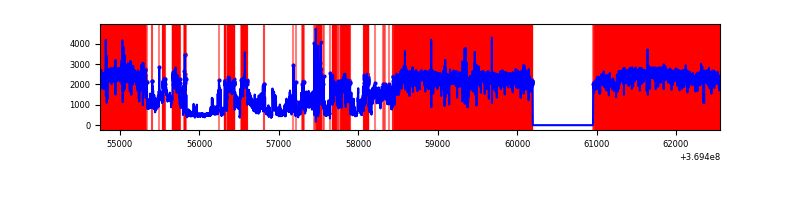 |
Top three noisy pixels from each quadrant. If the there are fewer than three noisy pixels in the level2.evt file, extra rows are filled as -1
| Pixel properties | Quadrant properties | ||||||
|---|---|---|---|---|---|---|---|
| Quadrant | DetID | PixID | Counts | Sigma | Mean | Median | Sigma |
| A | 14 | 238 | 19166 | 109.75 | 835 | 818 | 167.2 |
| A | 13 | 6 | 16529 | 93.97 | 835 | 818 | 167.2 |
| A | 13 | 254 | 13408 | 75.31 | 835 | 818 | 167.2 |
| B | 6 | 159 | 2029590 | 12821.62 | 834 | 813 | 158.2 |
| B | 5 | 172 | 110624 | 693.99 | 834 | 813 | 158.2 |
| B | 4 | 80 | 29983 | 184.35 | 834 | 813 | 158.2 |
| C | 3 | 233 | 227810 | 1208.37 | 807 | 811 | 187.9 |
| C | 14 | 238 | 144708 | 766.0 | 807 | 811 | 187.9 |
| C | 0 | 10 | 105801 | 558.89 | 807 | 811 | 187.9 |
| D | 1 | 52 | 8073101 | 50022.89 | 687 | 668 | 161.4 |
| D | 8 | 195 | 1402661 | 8687.81 | 687 | 668 | 161.4 |
| D | 12 | 218 | 233225 | 1441.1 | 687 | 668 | 161.4 |
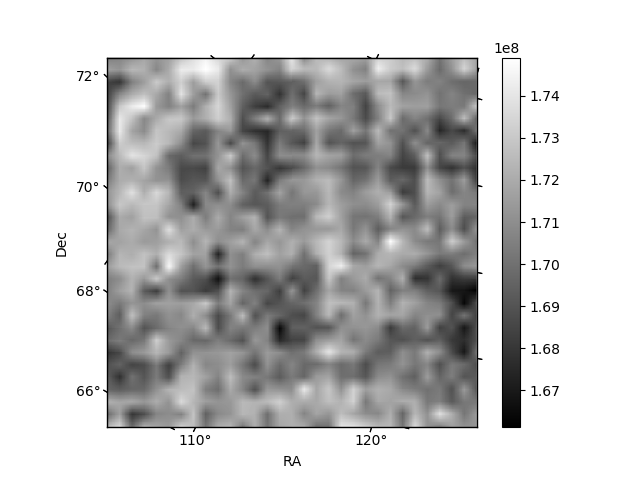
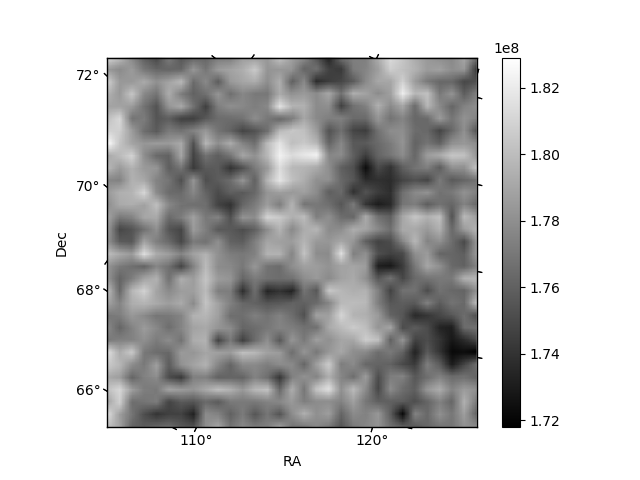
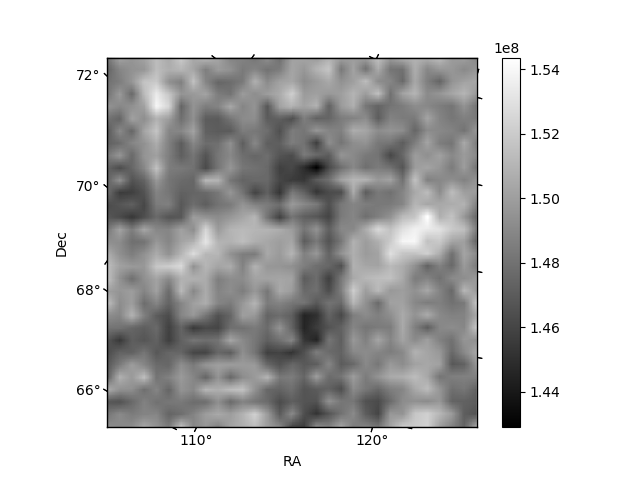
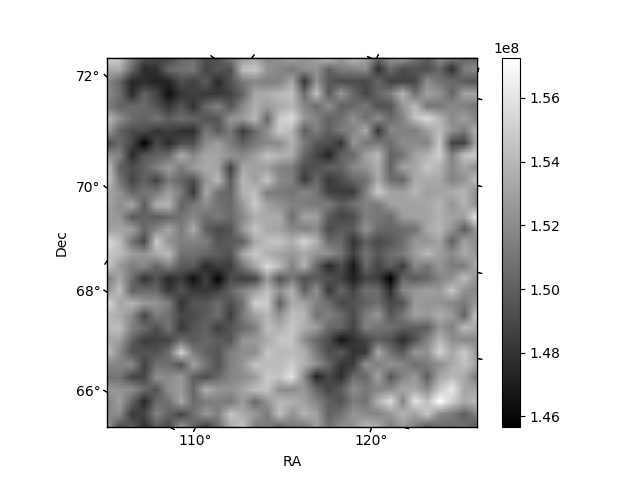
Histogram calculated using DETX and DETY for each event in the final _common_clean file
| Quadrant A | 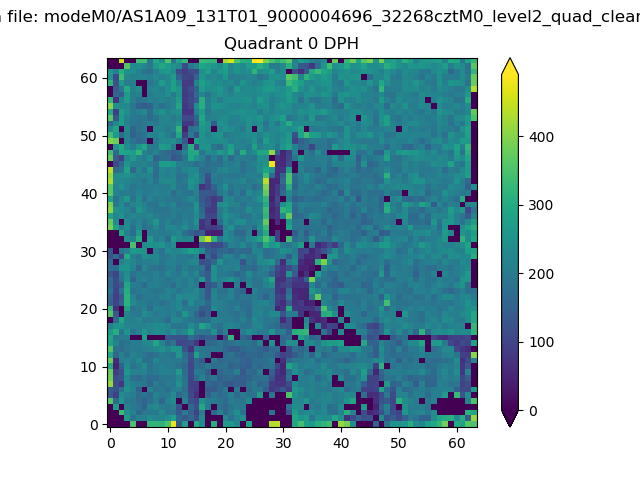 |
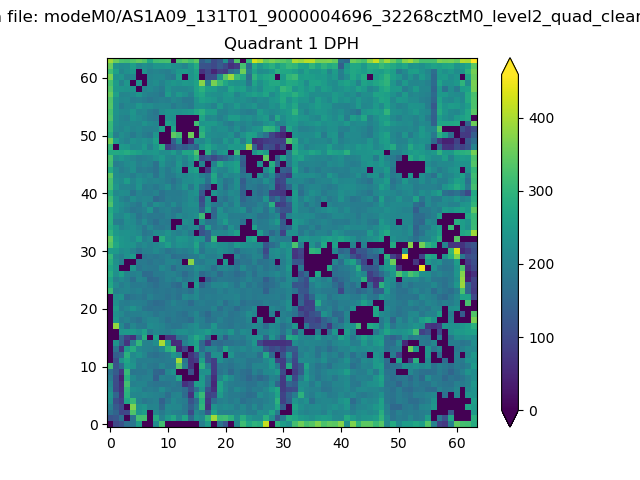 |
Quadrant B |
|---|---|---|---|
| Quadrant D | 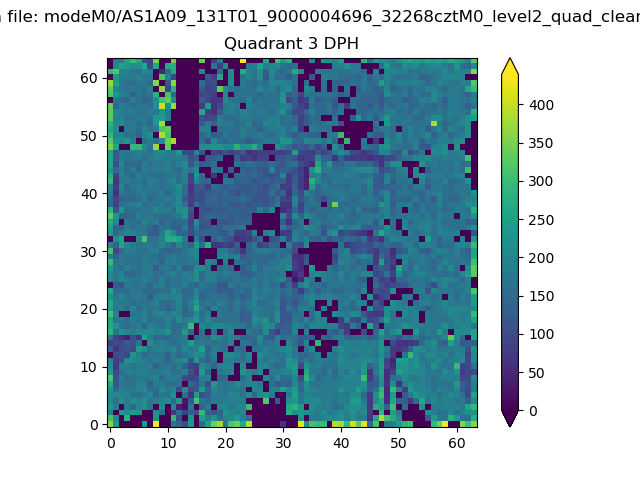 |
 |
Quadrant C |
| Plot type | Count rate plots | Images |
|---|---|---|
| Comparison with Poisson distribution Blue bars denote a histogram of data divided into 1 sec bins. Red curve is a Poisson curve with rate = median count rate of data. |
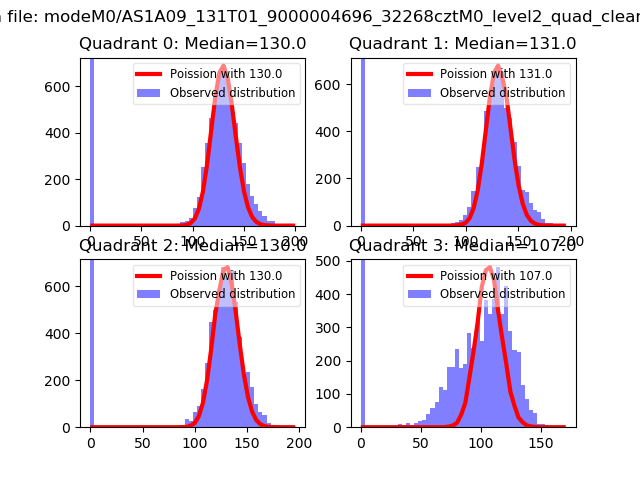 |
 |
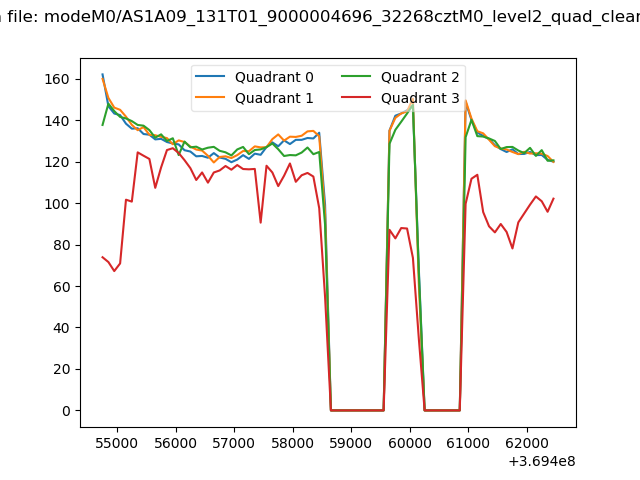
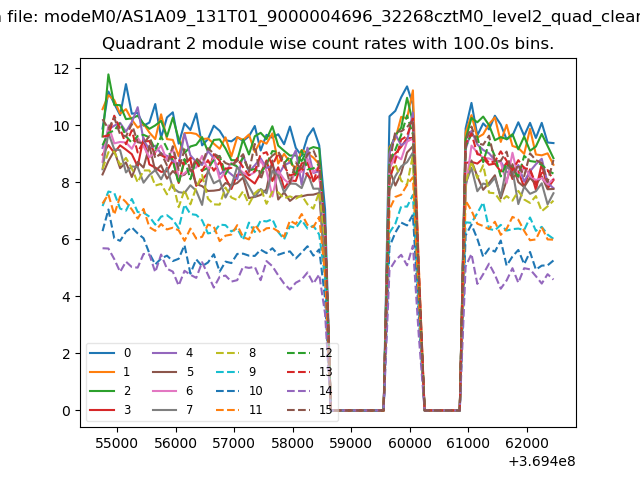
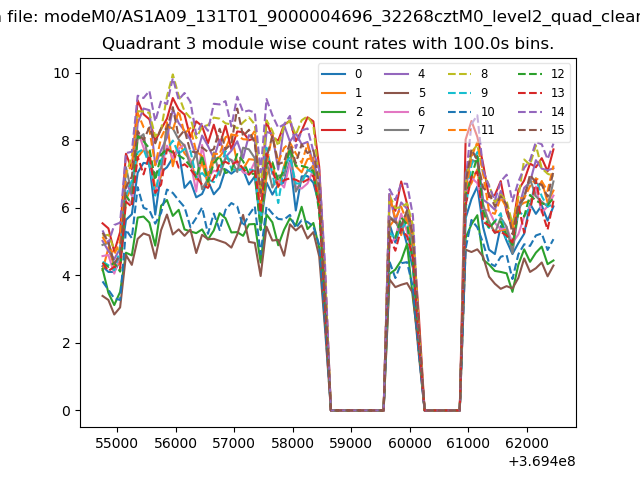
| Quadrant-wise count rates Data is divided into 100 sec bins |
 |
|
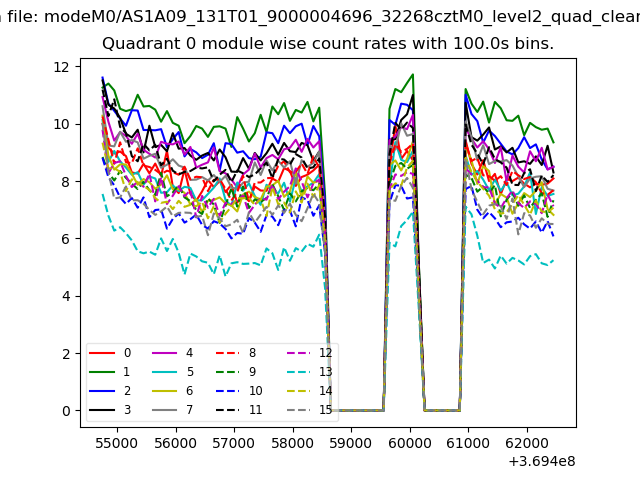
| Module-wise count rates for Quadrant A Data is divided into 100 sec bins |
 |
 |
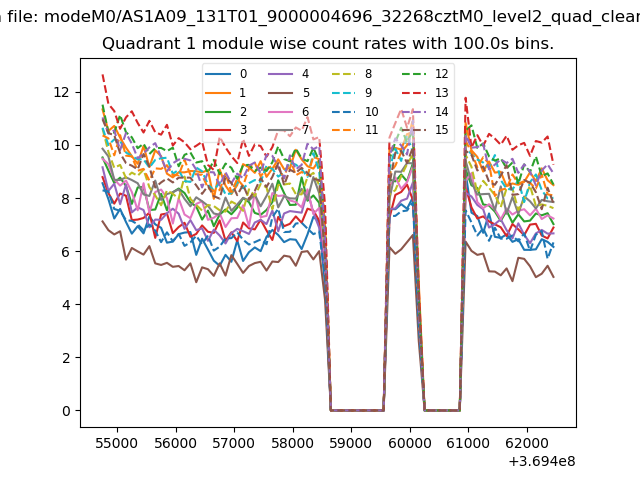
| Module-wise count rates for Quadrant B Data is divided into 100 sec bins |
 |
 |
| Module-wise count rates for Quadrant C Data is divided into 100 sec bins |
 |
 |
| Module-wise count rates for Quadrant D Data is divided into 100 sec bins |
 |
 |
| Parameter | Plot |
|---|---|
| CZT HV Monitor | 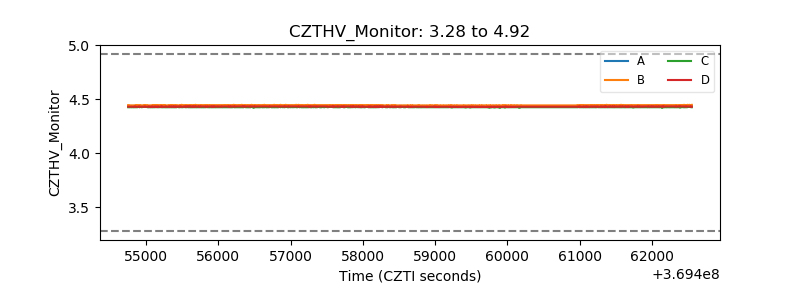 |
| D_VDD | 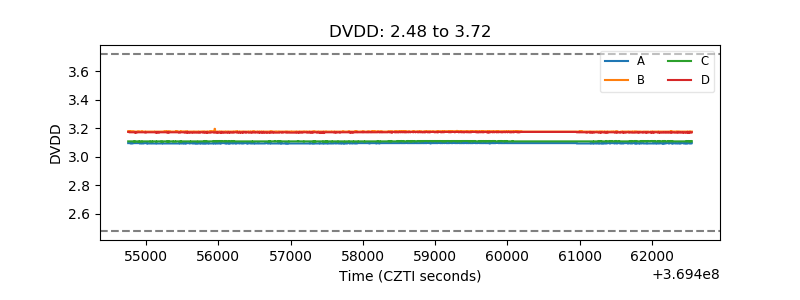 |
| Temperature 1 |  |
| Veto HV Monitor |  |
| Veto LLD | 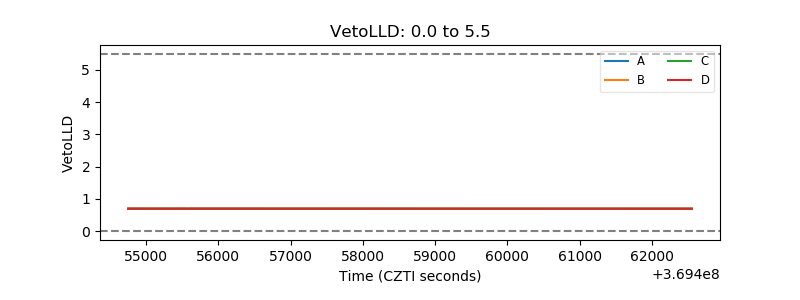 |
| Alpha Counter | 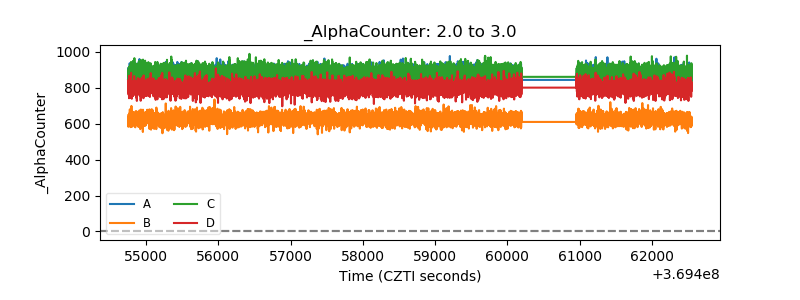 |
| _CPM_Rate |  |
| CZT Counter | 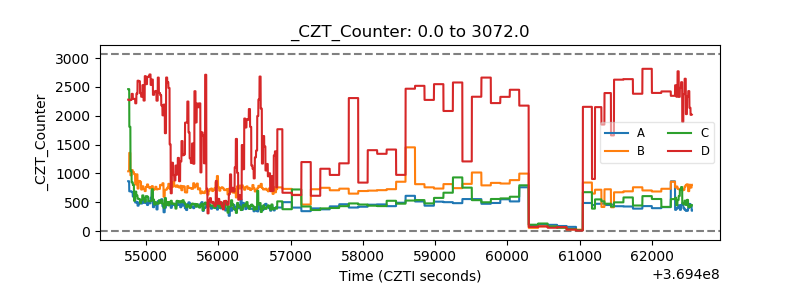 |
| +2.5 Volts monitor |  |
| +5 Volts monitor |  |
| _ROLL_ROT | 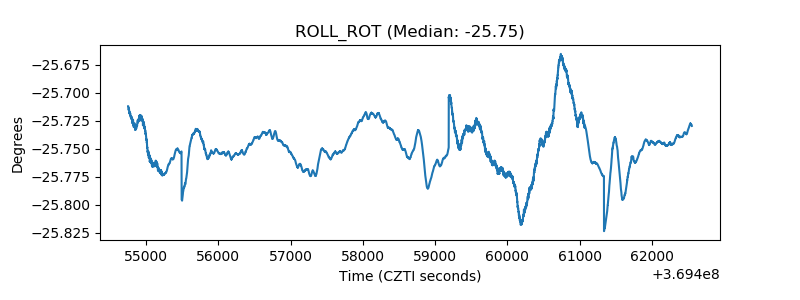 |
| _Roll_DEC | 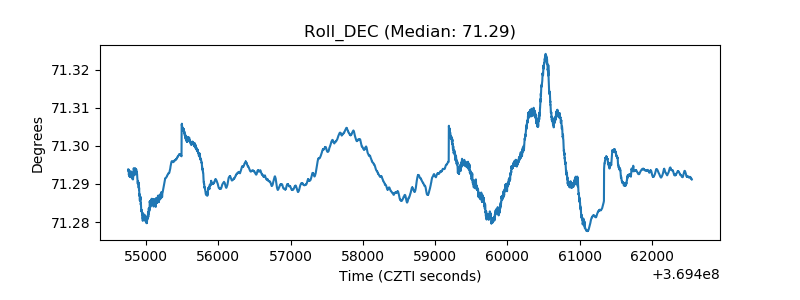 |
| _Roll_RA |  |
| Veto Counter | 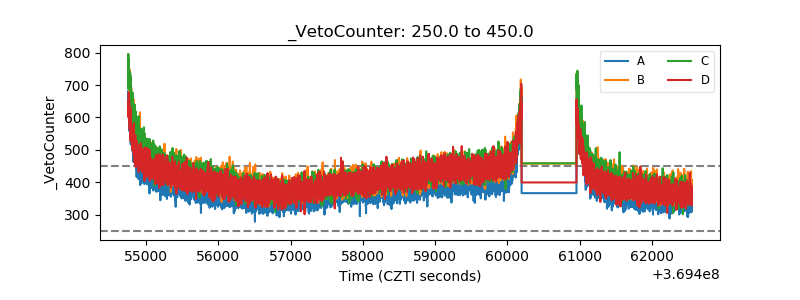 |