| Param | Original file | Final file |
|---|---|---|
| Filename | modeM0/AS1A09_131T01_9000004696_32269cztM0_level2.evt | modeM0/AS1A09_131T01_9000004696_32269cztM0_level2_quad_clean.evt |
| Size (bytes) | 715,775,040 | 105,206,400 |
| Size | 682.6 MB | 100.3 MB |
| Events in quadrant A | 3,072,388 | 701,724 |
| Events in quadrant B | 5,149,932 | 704,295 |
| Events in quadrant C | 3,877,240 | 697,388 |
| Events in quadrant D | 9,135,809 | 625,444 |
| Mode SS | |||
|---|---|---|---|
| Quadrant | BADHDUFLAG | Total packets | Discarded packets |
| A | 0 | 134 | 0 |
| B | 0 | 134 | 0 |
| C | 0 | 134 | 0 |
| D | 0 | 134 | 0 |
| Mode M9 | |||
|---|---|---|---|
| Quadrant | BADHDUFLAG | Total packets | Discarded packets |
| A | 0 | 2 | 0 |
| B | 0 | 2 | 0 |
| C | 0 | 2 | 0 |
| D | 0 | 2 | 0 |
| Mode M0 | |||
|---|---|---|---|
| Quadrant | BADHDUFLAG | Total packets | Discarded packets |
| A | 0 | 13555 | 3 |
| B | 0 | 20272 | 2 |
| C | 0 | 15884 | 2 |
| D | 0 | 31748 | 2 |
| Quadrant | Total seconds | Saturated seconds | Saturation percentage |
|---|---|---|---|
| A | 6545 | 122 | 1.864018% |
| B | 6545 | 266 | 4.064171% |
| C | 6545 | 169 | 2.582124% |
| D | 6545 | 1470 | 22.459893% |
Noise dominated data is calculated using 1-second bins in cleaned event files. If a bin has >2000 counts, and if more than 50% of those come from <1% of pixels, then it is considered to be noise-dominated and hence unusable.
| Quadrant | # 1 sec bins | Bins with >0 counts | Bins with >2000 counts | High rate bins dominated by noise | Noise dominated (total time) | Noise dominated (detector-on time) | Marked lightcurve |
|---|---|---|---|---|---|---|---|
| A | 6810 | 6547 | 0 | 0 | 0.00% | 0.00% | 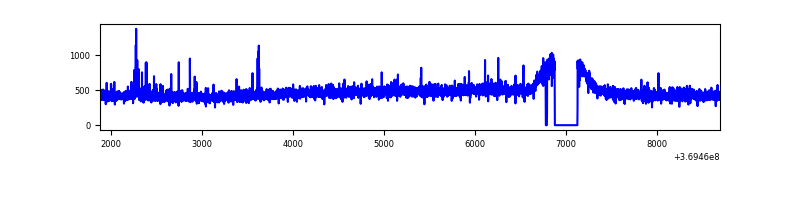 |
| B | 6810 | 6547 | 36 | 36 | 0.53% | 0.55% | 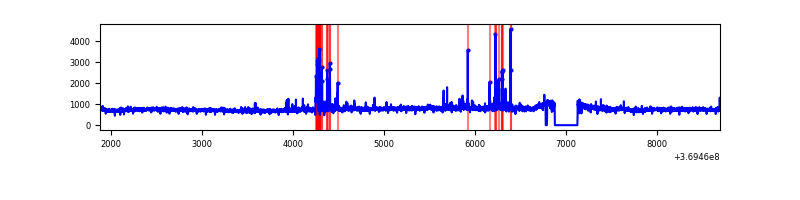 |
| C | 6810 | 6547 | 0 | 0 | 0.00% | 0.00% | 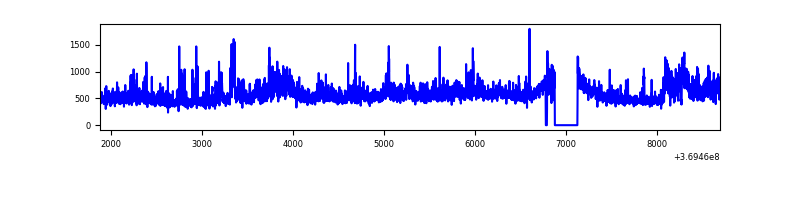 |
| D | 6810 | 6547 | 1991 | 1991 | 29.24% | 30.41% | 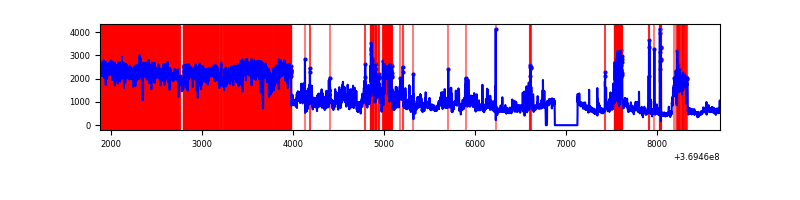 |
Top three noisy pixels from each quadrant. If the there are fewer than three noisy pixels in the level2.evt file, extra rows are filled as -1
| Pixel properties | Quadrant properties | ||||||
|---|---|---|---|---|---|---|---|
| Quadrant | DetID | PixID | Counts | Sigma | Mean | Median | Sigma |
| A | 14 | 238 | 32877 | 202.89 | 783 | 764 | 158.3 |
| A | 13 | 254 | 12910 | 76.74 | 783 | 764 | 158.3 |
| A | 13 | 6 | 12349 | 73.19 | 783 | 764 | 158.3 |
| B | 6 | 159 | 1840510 | 12292.95 | 773 | 752 | 149.7 |
| B | 5 | 172 | 157702 | 1048.71 | 773 | 752 | 149.7 |
| B | 0 | 229 | 39373 | 258.06 | 773 | 752 | 149.7 |
| C | 3 | 233 | 755696 | 4309.23 | 753 | 756 | 175.2 |
| C | 14 | 238 | 129148 | 732.87 | 753 | 756 | 175.2 |
| C | 0 | 10 | 22347 | 123.24 | 753 | 756 | 175.2 |
| D | 1 | 52 | 4534556 | 25736.28 | 730 | 707 | 176.2 |
| D | 8 | 195 | 1317440 | 7474.4 | 730 | 707 | 176.2 |
| D | 2 | 250 | 135958 | 767.75 | 730 | 707 | 176.2 |
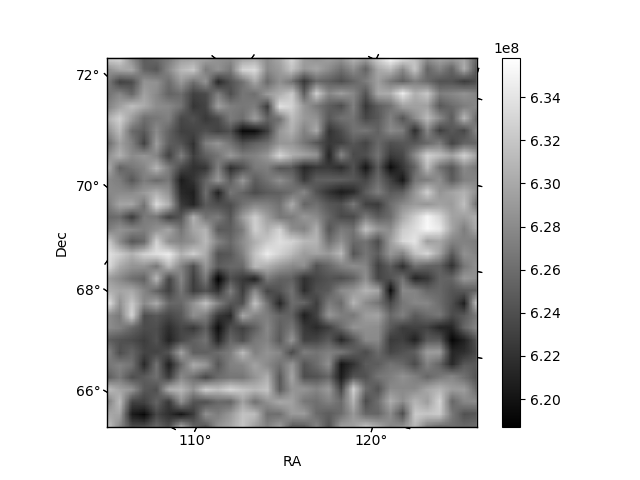
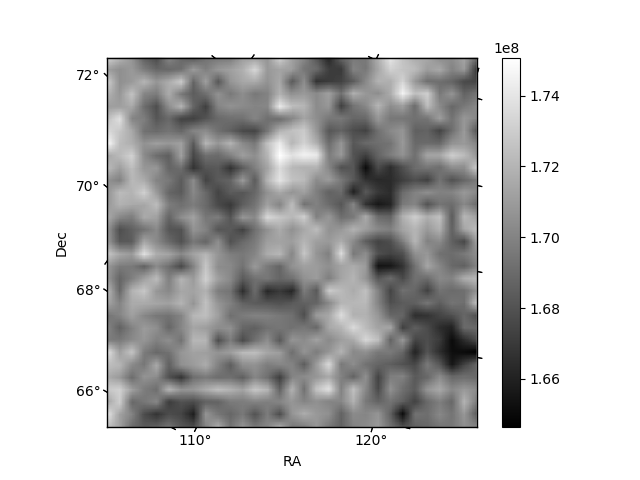
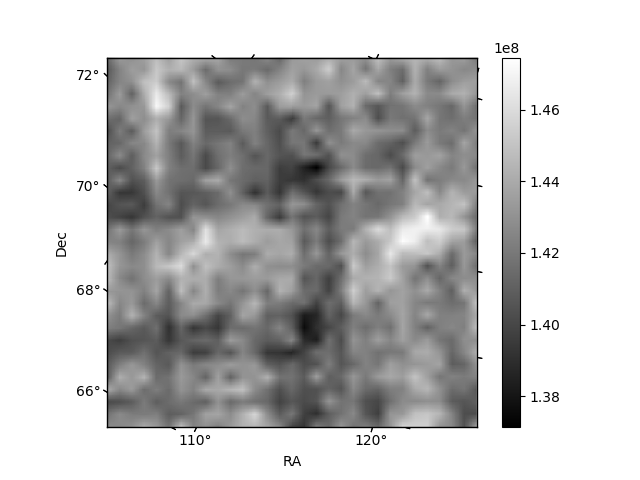
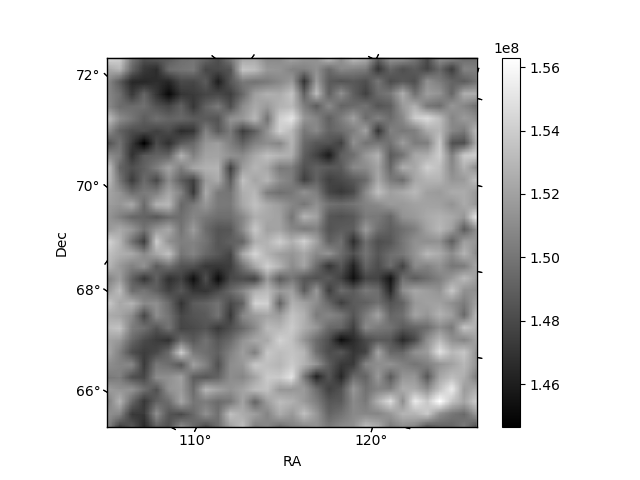
Histogram calculated using DETX and DETY for each event in the final _common_clean file
| Quadrant A | 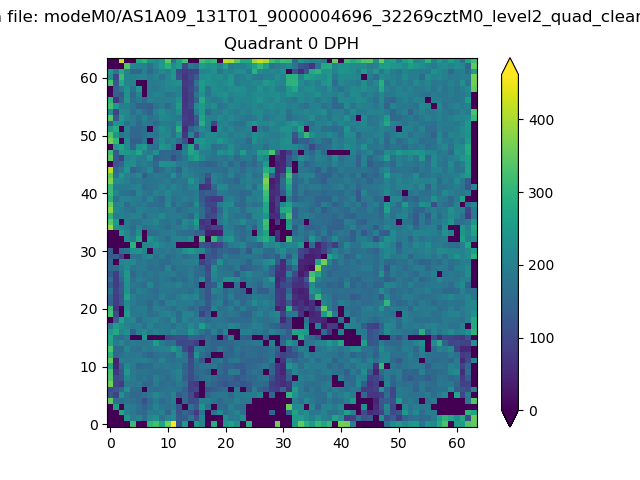 |
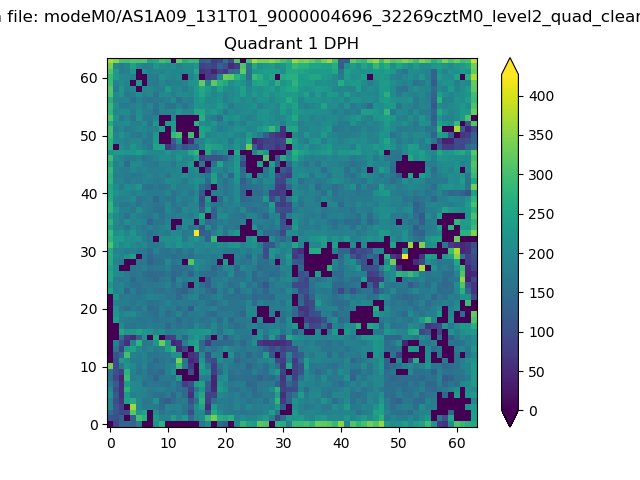 |
Quadrant B |
|---|---|---|---|
| Quadrant D | 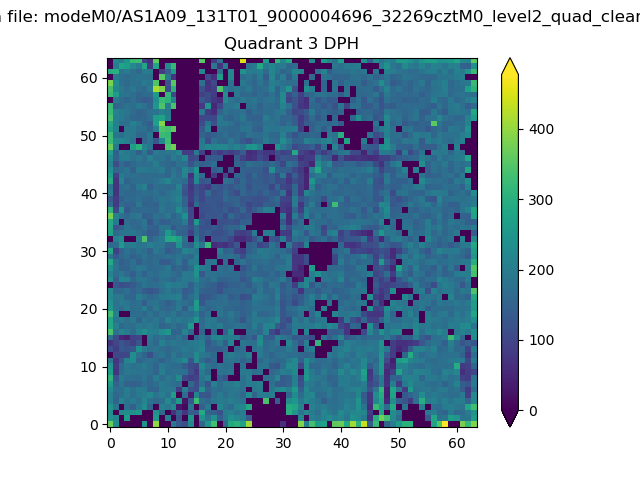 |
 |
Quadrant C |
| Plot type | Count rate plots | Images |
|---|---|---|
| Comparison with Poisson distribution Blue bars denote a histogram of data divided into 1 sec bins. Red curve is a Poisson curve with rate = median count rate of data. |
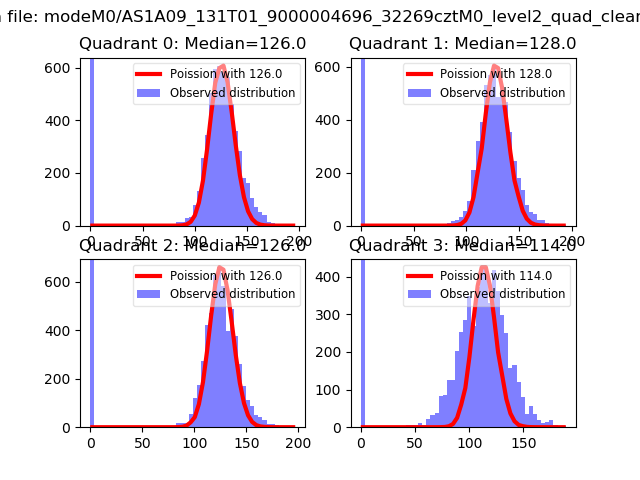 |
 |
| Quadrant-wise count rates Data is divided into 100 sec bins |
 |
|
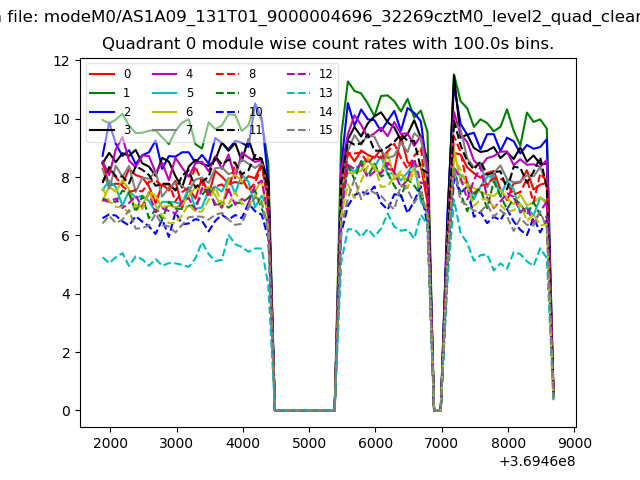
| Module-wise count rates for Quadrant A Data is divided into 100 sec bins |
 |
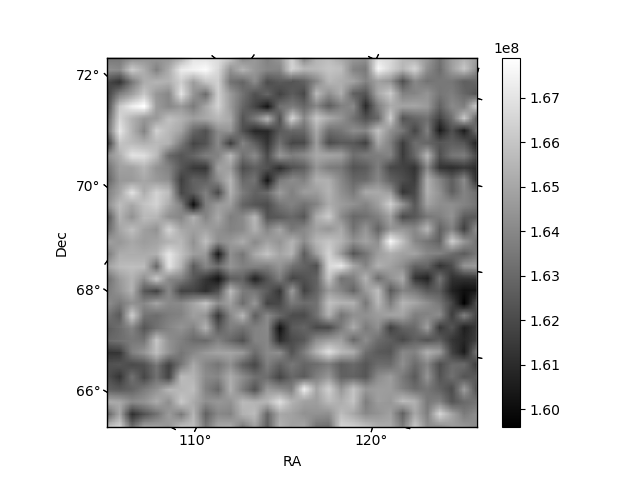 |
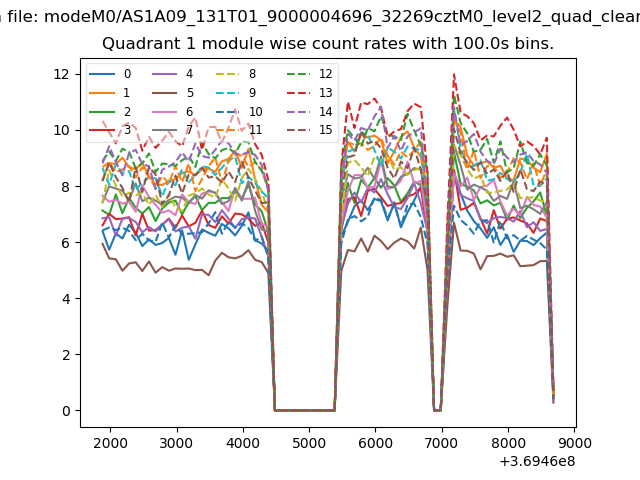
| Module-wise count rates for Quadrant B Data is divided into 100 sec bins |
 |
 |
| Module-wise count rates for Quadrant C Data is divided into 100 sec bins |
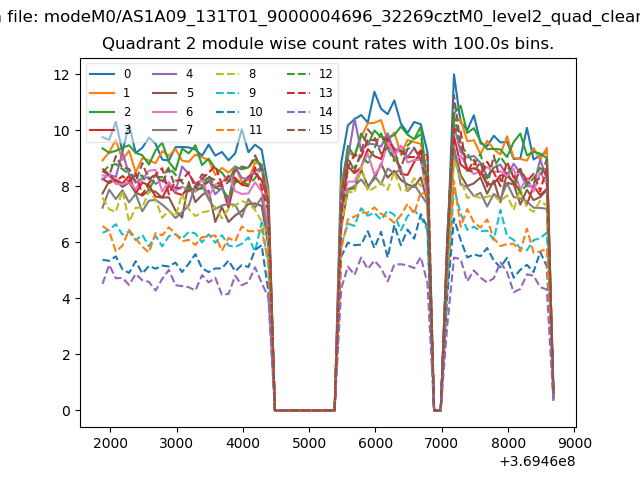 |
 |
| Module-wise count rates for Quadrant D Data is divided into 100 sec bins |
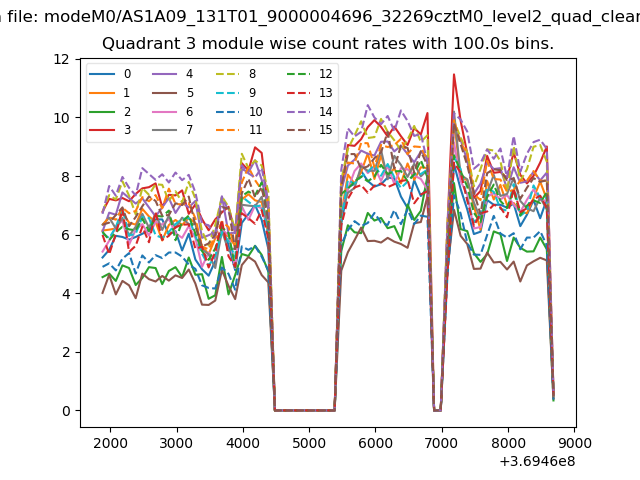 |
 |
| Parameter | Plot |
|---|---|
| CZT HV Monitor | 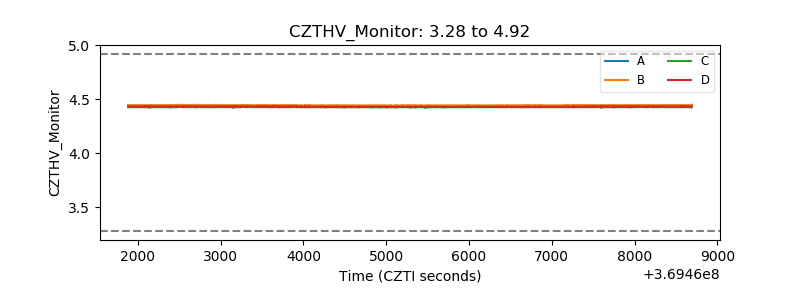 |
| D_VDD | 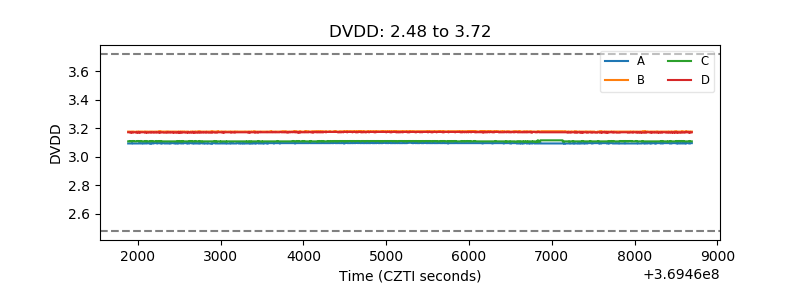 |
| Temperature 1 | 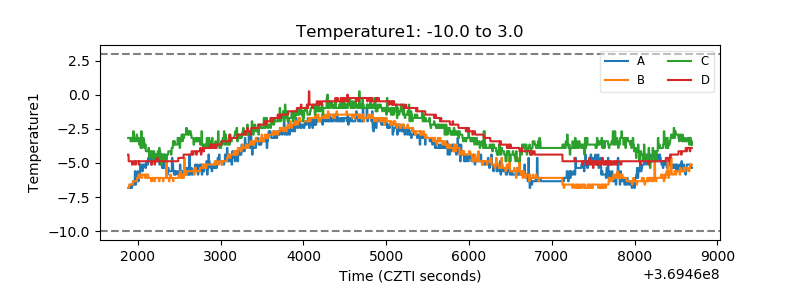 |
| Veto HV Monitor |  |
| Veto LLD | 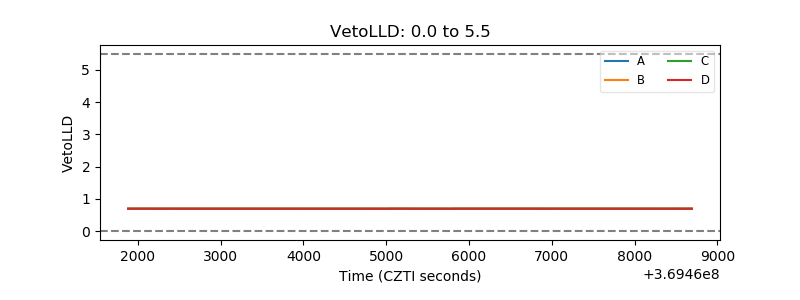 |
| Alpha Counter | 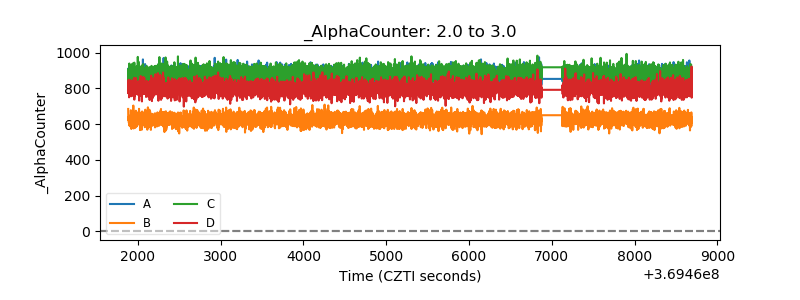 |
| _CPM_Rate | 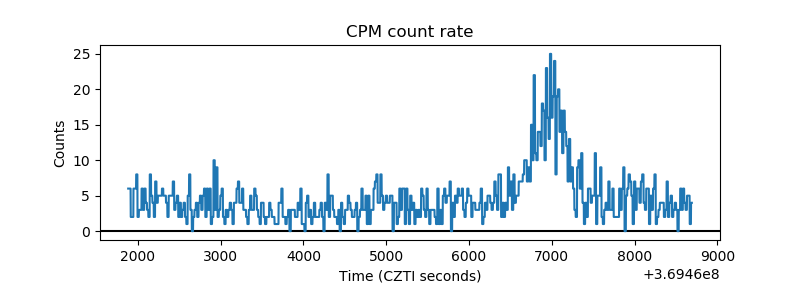 |
| CZT Counter | 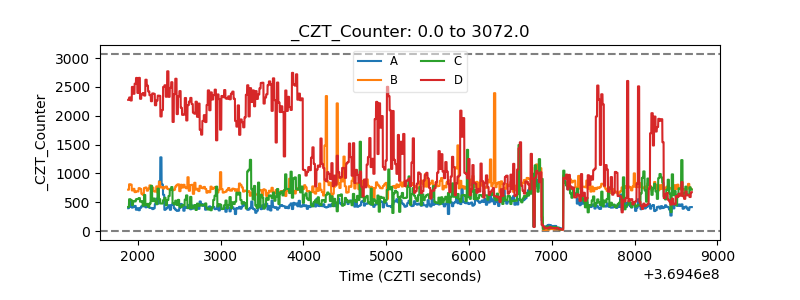 |
| +2.5 Volts monitor |  |
| +5 Volts monitor |  |
| _ROLL_ROT | 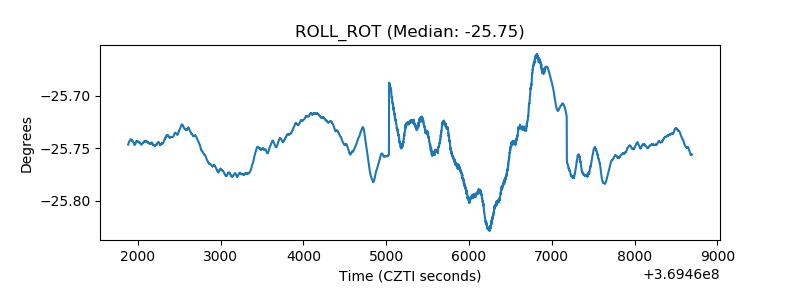 |
| _Roll_DEC | 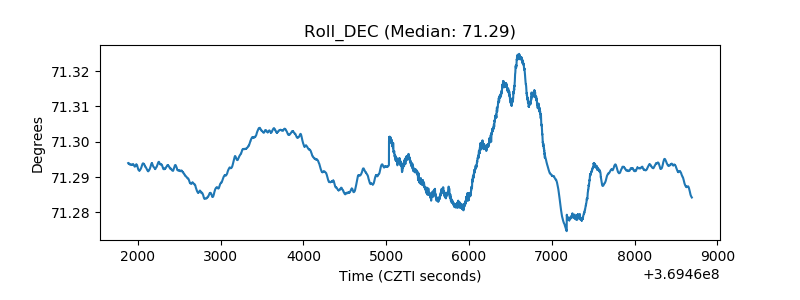 |
| _Roll_RA | 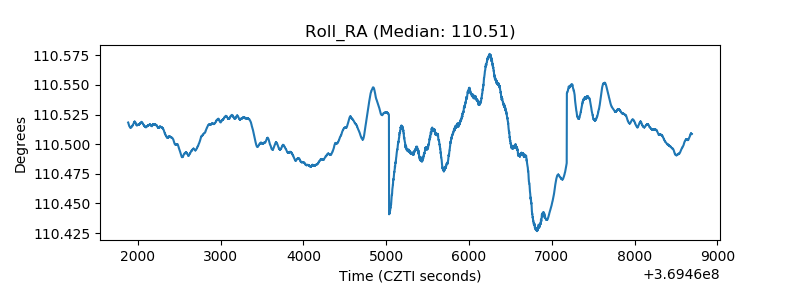 |
| Veto Counter | 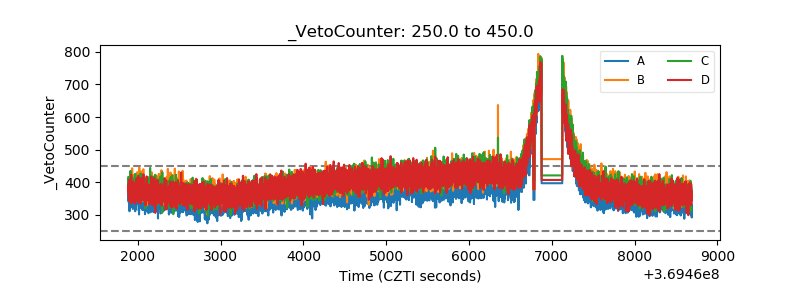 |