| Param | Original file | Final file |
|---|---|---|
| Filename | modeM0/AS1A09_131T01_9000004696_32270cztM0_level2.evt | modeM0/AS1A09_131T01_9000004696_32270cztM0_level2_quad_clean.evt |
| Size (bytes) | 649,762,560 | 116,677,440 |
| Size | 619.7 MB | 111.3 MB |
| Events in quadrant A | 3,335,825 | 769,665 |
| Events in quadrant B | 5,751,392 | 768,265 |
| Events in quadrant C | 4,067,991 | 771,019 |
| Events in quadrant D | 6,039,459 | 726,614 |
| Mode SS | |||
|---|---|---|---|
| Quadrant | BADHDUFLAG | Total packets | Discarded packets |
| A | 0 | 144 | 0 |
| B | 0 | 144 | 0 |
| C | 0 | 144 | 0 |
| D | 0 | 144 | 0 |
| Mode M0 | |||
|---|---|---|---|
| Quadrant | BADHDUFLAG | Total packets | Discarded packets |
| A | 0 | 14740 | 3 |
| B | 0 | 22462 | 2 |
| C | 0 | 16548 | 2 |
| D | 0 | 22936 | 2 |
| Quadrant | Total seconds | Saturated seconds | Saturation percentage |
|---|---|---|---|
| A | 7142 | 228 | 3.192383% |
| B | 7142 | 427 | 5.978717% |
| C | 7142 | 283 | 3.962475% |
| D | 7142 | 611 | 8.555027% |
Noise dominated data is calculated using 1-second bins in cleaned event files. If a bin has >2000 counts, and if more than 50% of those come from <1% of pixels, then it is considered to be noise-dominated and hence unusable.
| Quadrant | # 1 sec bins | Bins with >0 counts | Bins with >2000 counts | High rate bins dominated by noise | Noise dominated (total time) | Noise dominated (detector-on time) | Marked lightcurve |
|---|---|---|---|---|---|---|---|
| A | 7207 | 7144 | 0 | 0 | 0.00% | 0.00% | 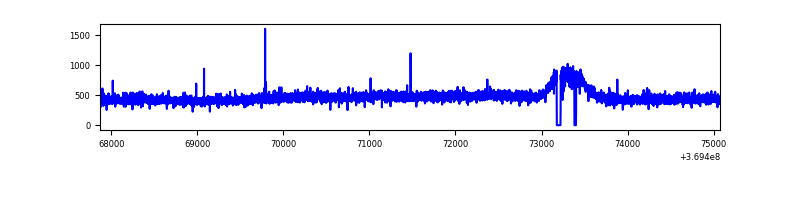 |
| B | 7207 | 7144 | 52 | 52 | 0.72% | 0.73% | 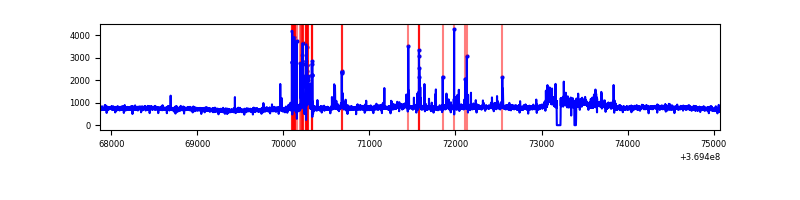 |
| C | 7207 | 7144 | 3 | 3 | 0.04% | 0.04% | 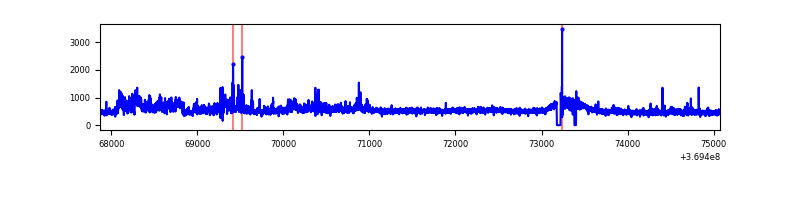 |
| D | 7207 | 7144 | 347 | 347 | 4.81% | 4.86% | 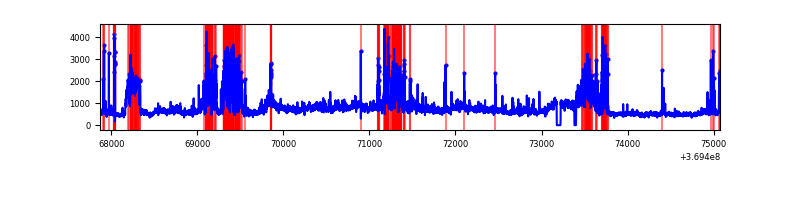 |
Top three noisy pixels from each quadrant. If the there are fewer than three noisy pixels in the level2.evt file, extra rows are filled as -1
| Pixel properties | Quadrant properties | ||||||
|---|---|---|---|---|---|---|---|
| Quadrant | DetID | PixID | Counts | Sigma | Mean | Median | Sigma |
| A | 13 | 6 | 19677 | 108.23 | 857 | 837 | 174.1 |
| A | 13 | 254 | 13464 | 72.54 | 857 | 837 | 174.1 |
| A | 3 | 137 | 8985 | 46.81 | 857 | 837 | 174.1 |
| B | 6 | 159 | 2010119 | 12472.43 | 837 | 815 | 161.1 |
| B | 5 | 172 | 194665 | 1203.29 | 837 | 815 | 161.1 |
| B | 4 | 80 | 117342 | 723.32 | 837 | 815 | 161.1 |
| C | 3 | 233 | 580531 | 3023.98 | 820 | 821 | 191.7 |
| C | 14 | 238 | 146034 | 757.49 | 820 | 821 | 191.7 |
| C | 0 | 10 | 86654 | 447.74 | 820 | 821 | 191.7 |
| D | 8 | 195 | 1111549 | 5735.65 | 813 | 788 | 193.7 |
| D | 2 | 250 | 899546 | 4640.93 | 813 | 788 | 193.7 |
| D | 1 | 52 | 427406 | 2202.93 | 813 | 788 | 193.7 |
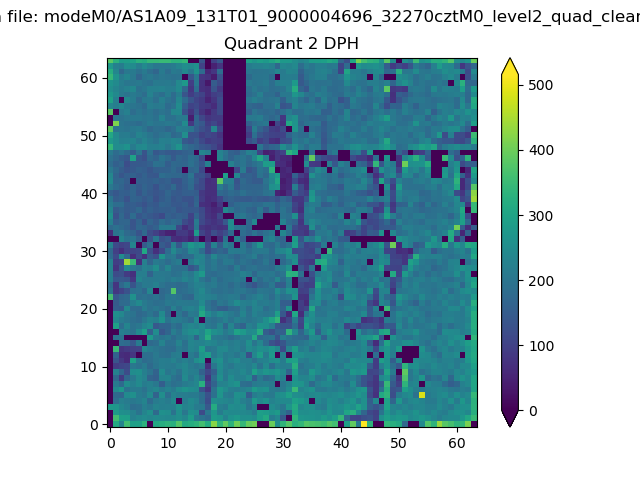
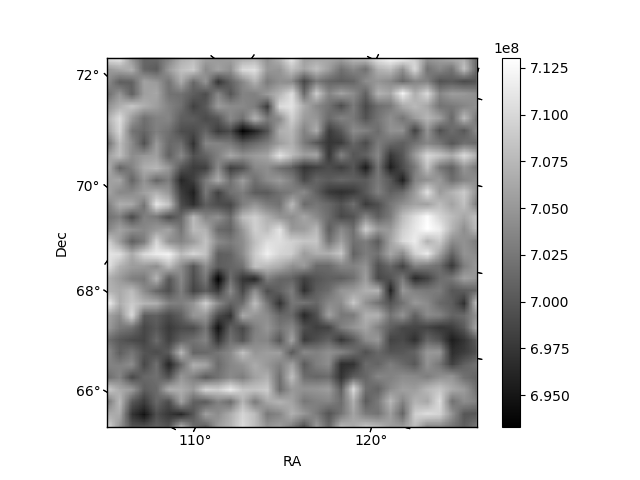
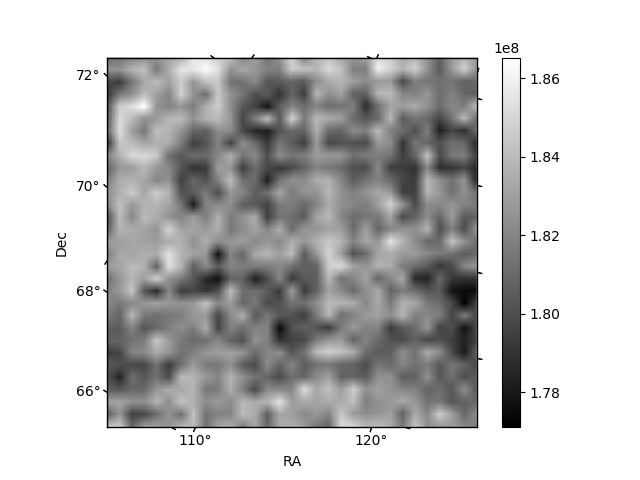
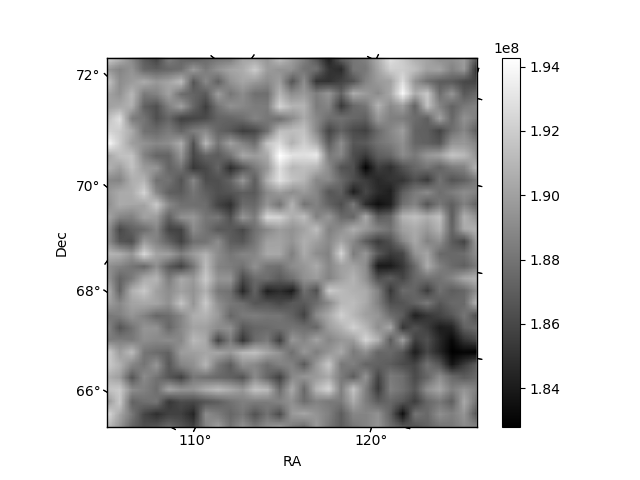
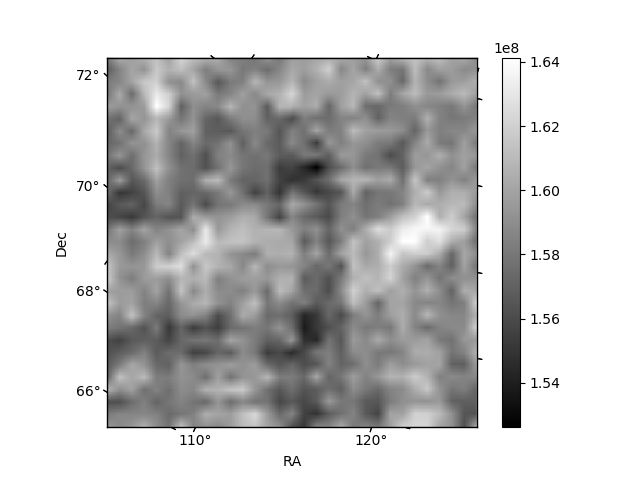
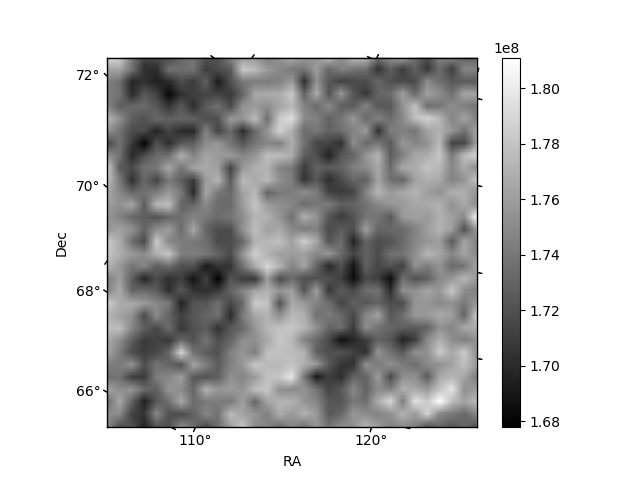
Histogram calculated using DETX and DETY for each event in the final _common_clean file
| Quadrant A | 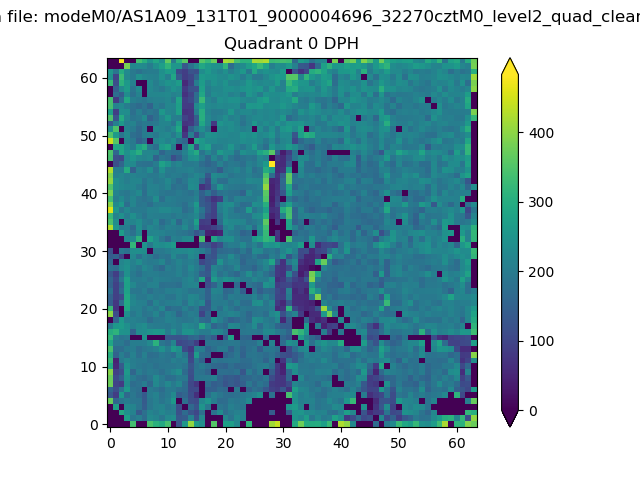 |
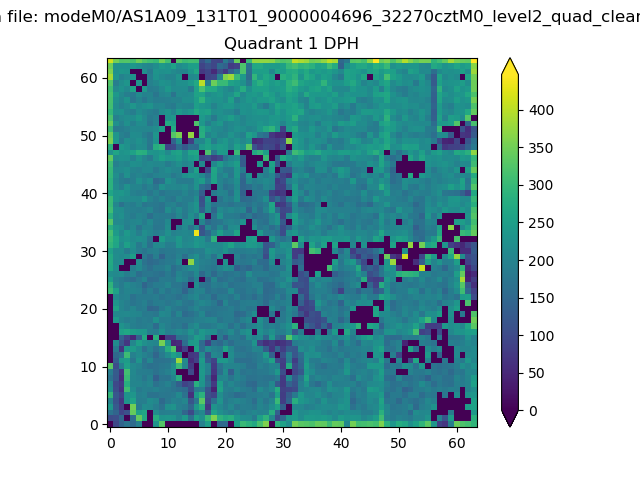 |
Quadrant B |
|---|---|---|---|
| Quadrant D | 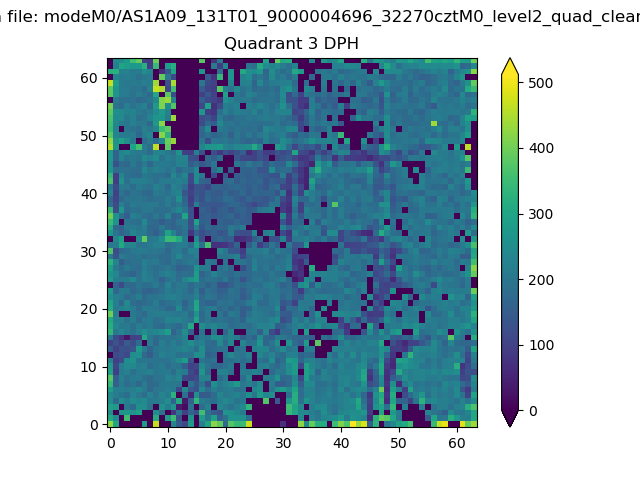 |
 |
Quadrant C |
| Plot type | Count rate plots | Images |
|---|---|---|
| Comparison with Poisson distribution Blue bars denote a histogram of data divided into 1 sec bins. Red curve is a Poisson curve with rate = median count rate of data. |
 |
 |
| Quadrant-wise count rates Data is divided into 100 sec bins |
 |
|
| Module-wise count rates for Quadrant A Data is divided into 100 sec bins |
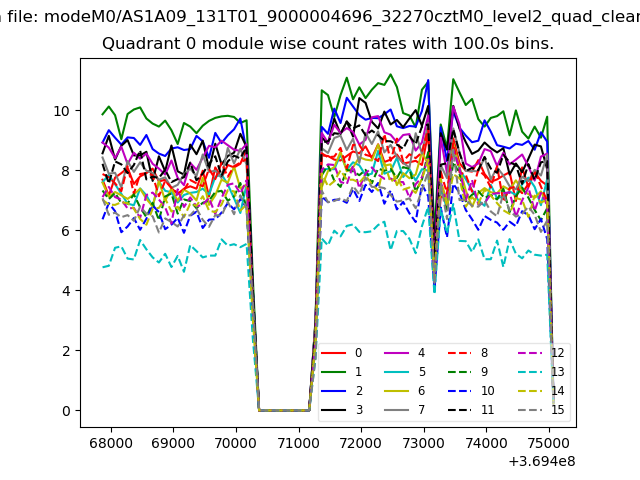 |
 |
| Module-wise count rates for Quadrant B Data is divided into 100 sec bins |
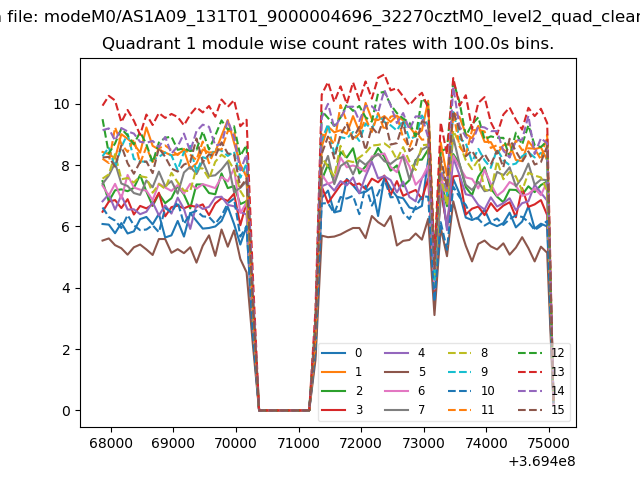 |
 |
| Module-wise count rates for Quadrant C Data is divided into 100 sec bins |
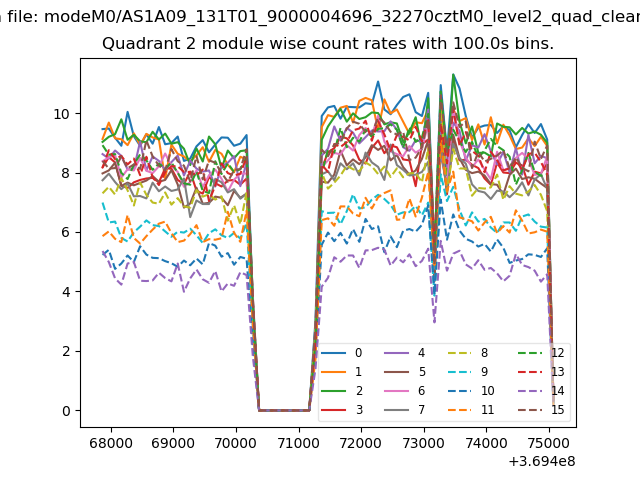 |
 |
| Module-wise count rates for Quadrant D Data is divided into 100 sec bins |
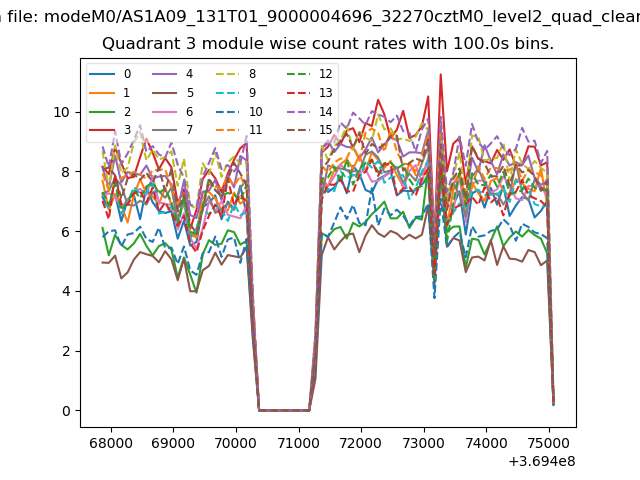 |
 |
| Parameter | Plot |
|---|---|
| CZT HV Monitor | 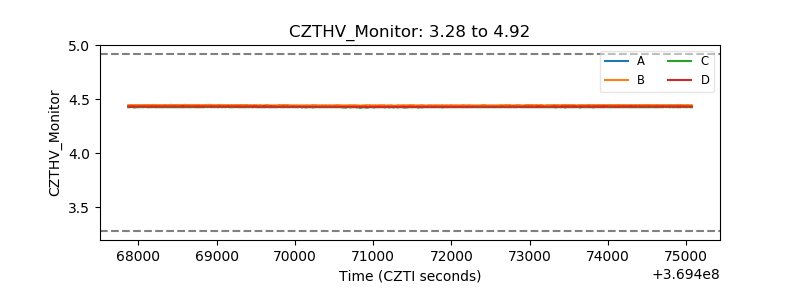 |
| D_VDD | 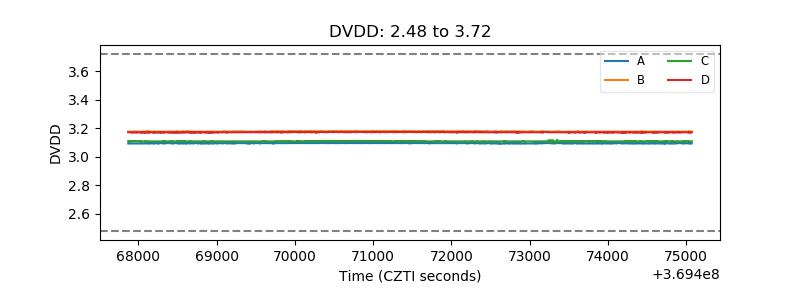 |
| Temperature 1 | 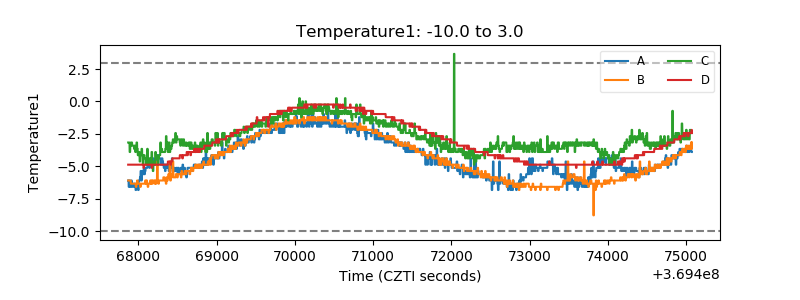 |
| Veto HV Monitor | 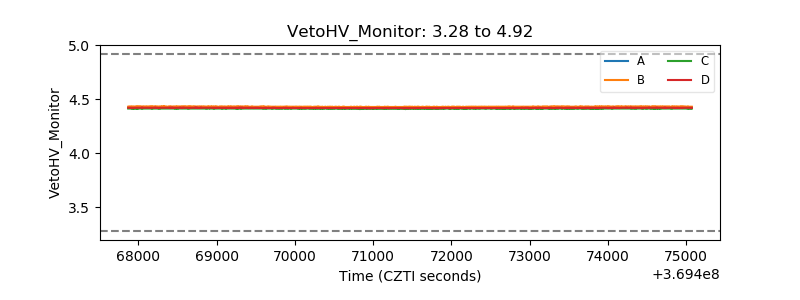 |
| Veto LLD | 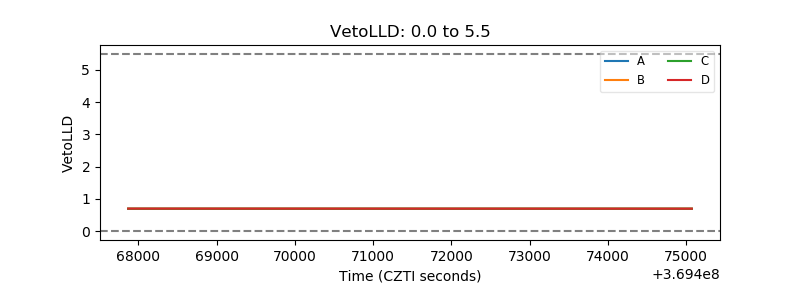 |
| Alpha Counter |  |
| _CPM_Rate |  |
| CZT Counter | 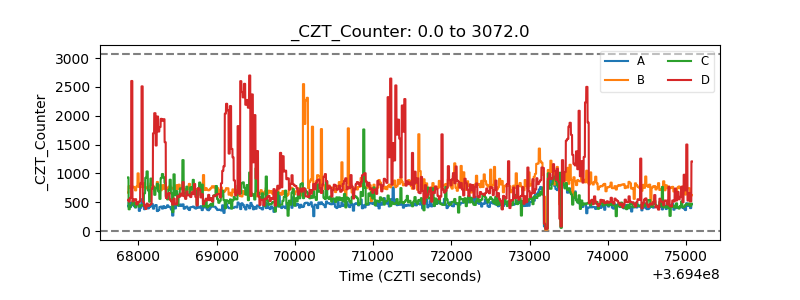 |
| +2.5 Volts monitor |  |
| +5 Volts monitor |  |
| _ROLL_ROT | 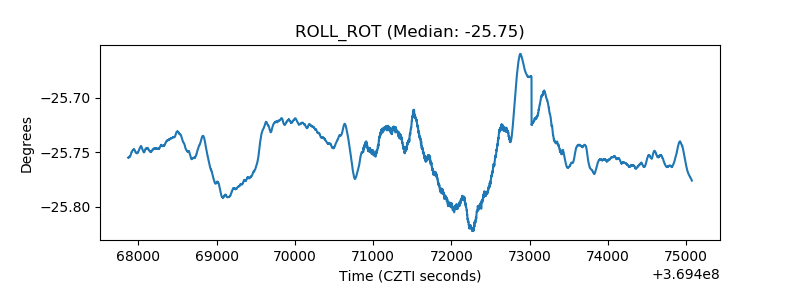 |
| _Roll_DEC | 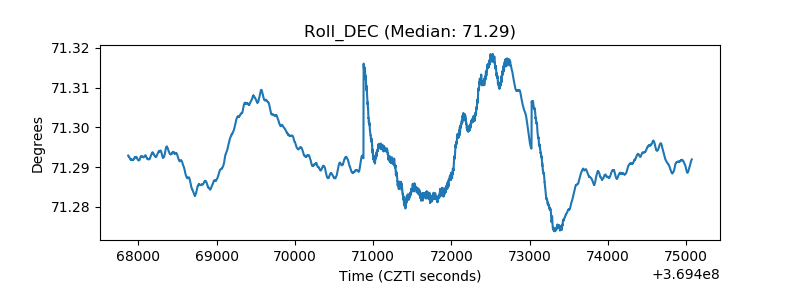 |
| _Roll_RA | 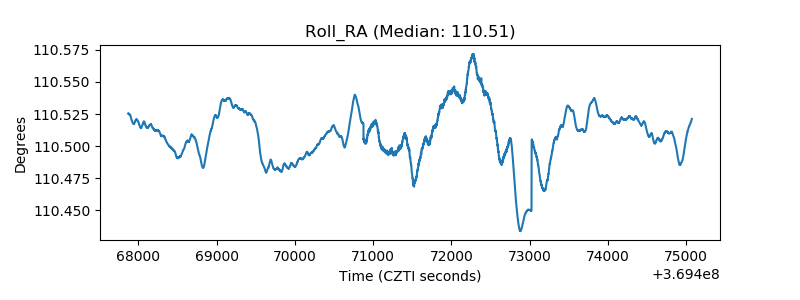 |
| Veto Counter | 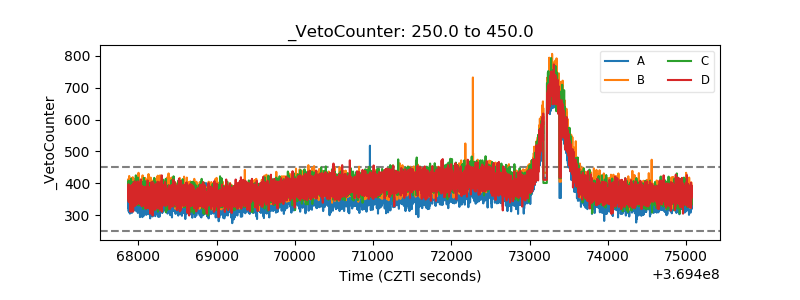 |