| Param | Original file | Final file |
|---|---|---|
| Filename | modeM0/AS1A09_131T01_9000004696_32271cztM0_level2.evt | modeM0/AS1A09_131T01_9000004696_32271cztM0_level2_quad_clean.evt |
| Size (bytes) | 420,468,480 | 67,196,160 |
| Size | 401.0 MB | 64.1 MB |
| Events in quadrant A | 2,031,972 | 441,824 |
| Events in quadrant B | 3,629,148 | 438,766 |
| Events in quadrant C | 2,205,780 | 436,141 |
| Events in quadrant D | 4,557,441 | 397,318 |
| Mode SS | |||
|---|---|---|---|
| Quadrant | BADHDUFLAG | Total packets | Discarded packets |
| A | 0 | 92 | 0 |
| B | 0 | 92 | 0 |
| C | 0 | 92 | 0 |
| D | 0 | 92 | 0 |
| Mode M0 | |||
|---|---|---|---|
| Quadrant | BADHDUFLAG | Total packets | Discarded packets |
| A | 0 | 9163 | 0 |
| B | 0 | 14294 | 0 |
| C | 0 | 9343 | 0 |
| D | 0 | 16650 | 0 |
| Quadrant | Total seconds | Saturated seconds | Saturation percentage |
|---|---|---|---|
| A | 4556 | 2 | 0.043898% |
| B | 4557 | 106 | 2.326092% |
| C | 4557 | 24 | 0.526662% |
| D | 4557 | 565 | 12.398508% |
Noise dominated data is calculated using 1-second bins in cleaned event files. If a bin has >2000 counts, and if more than 50% of those come from <1% of pixels, then it is considered to be noise-dominated and hence unusable.
| Quadrant | # 1 sec bins | Bins with >0 counts | Bins with >2000 counts | High rate bins dominated by noise | Noise dominated (total time) | Noise dominated (detector-on time) | Marked lightcurve |
|---|---|---|---|---|---|---|---|
| A | 4556 | 4556 | 0 | 0 | 0.00% | 0.00% | 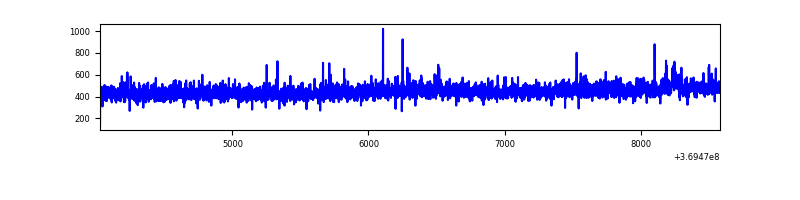 |
| B | 4557 | 4557 | 61 | 61 | 1.34% | 1.34% | 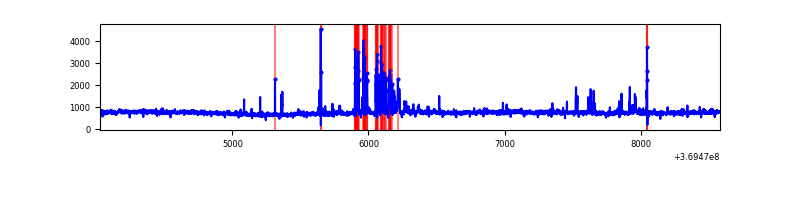 |
| C | 4557 | 4557 | 1 | 1 | 0.02% | 0.02% | 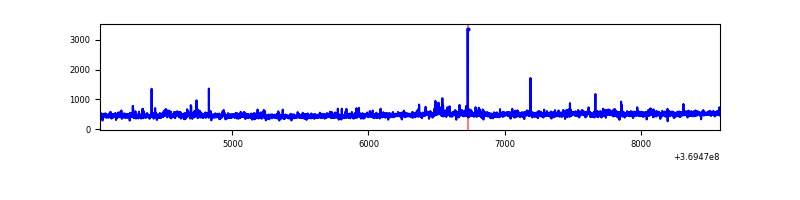 |
| D | 4557 | 4557 | 426 | 426 | 9.35% | 9.35% | 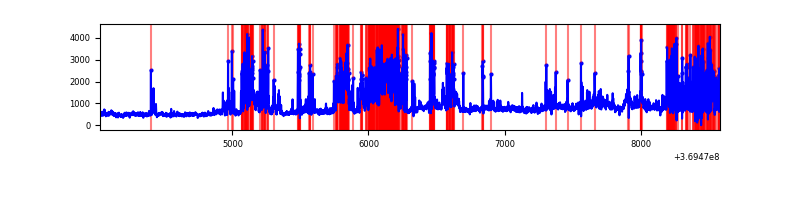 |
Top three noisy pixels from each quadrant. If the there are fewer than three noisy pixels in the level2.evt file, extra rows are filled as -1
| Pixel properties | Quadrant properties | ||||||
|---|---|---|---|---|---|---|---|
| Quadrant | DetID | PixID | Counts | Sigma | Mean | Median | Sigma |
| A | 15 | 174 | 9154 | 81.43 | 523 | 513 | 106.1 |
| A | 13 | 254 | 8752 | 77.65 | 523 | 513 | 106.1 |
| A | 3 | 137 | 5296 | 45.08 | 523 | 513 | 106.1 |
| B | 6 | 159 | 1233726 | 12541.54 | 514 | 502 | 98.3 |
| B | 5 | 172 | 193756 | 1965.34 | 514 | 502 | 98.3 |
| B | 0 | 229 | 53808 | 542.11 | 514 | 502 | 98.3 |
| C | 3 | 233 | 112841 | 959.68 | 503 | 506 | 117.1 |
| C | 14 | 238 | 84441 | 717.06 | 503 | 506 | 117.1 |
| C | 0 | 10 | 13376 | 109.95 | 503 | 506 | 117.1 |
| D | 8 | 195 | 849180 | 7386.64 | 481 | 468 | 114.9 |
| D | 12 | 233 | 793848 | 6905.07 | 481 | 468 | 114.9 |
| D | 12 | 218 | 447371 | 3889.56 | 481 | 468 | 114.9 |
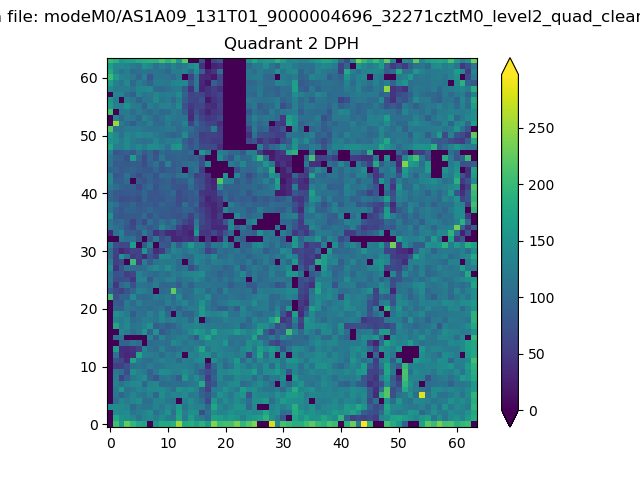
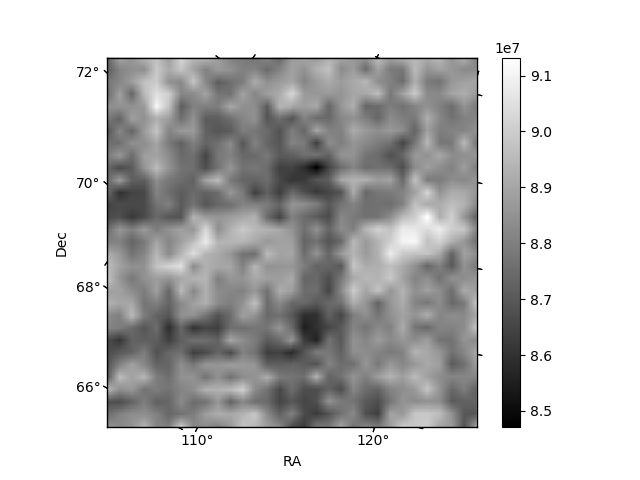
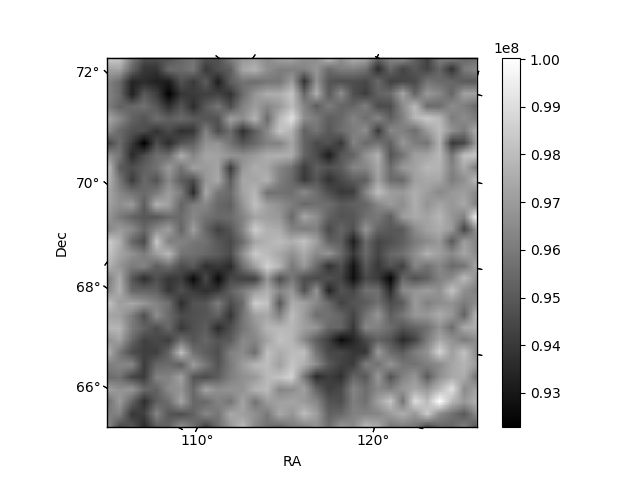
Histogram calculated using DETX and DETY for each event in the final _common_clean file
| Quadrant A | 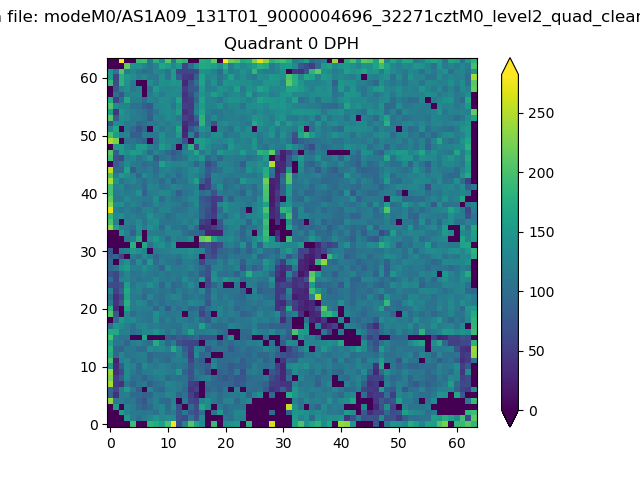 |
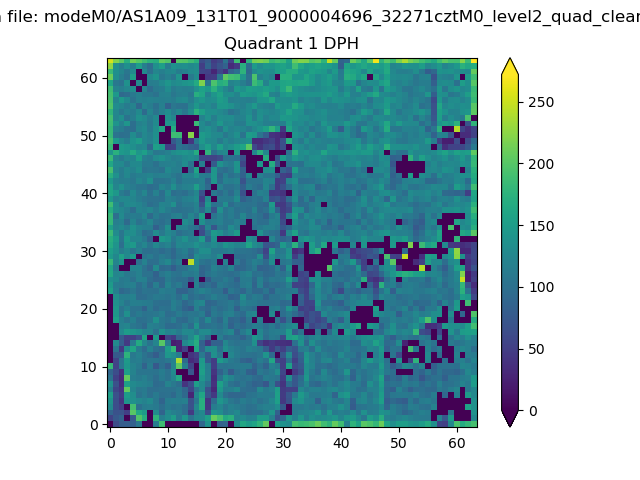 |
Quadrant B |
|---|---|---|---|
| Quadrant D | 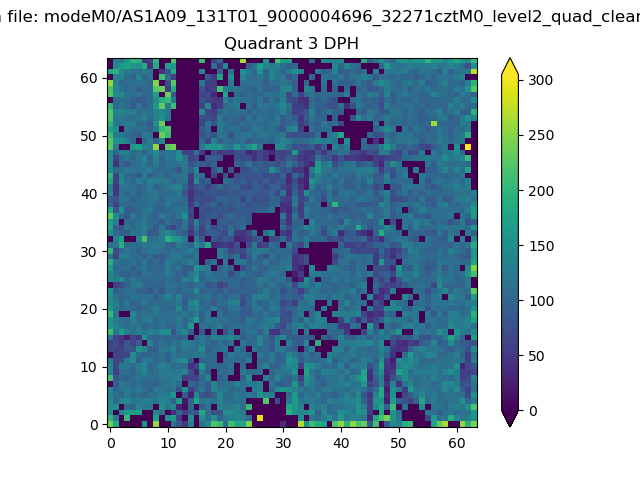 |
 |
Quadrant C |
| Plot type | Count rate plots | Images |
|---|---|---|
| Comparison with Poisson distribution Blue bars denote a histogram of data divided into 1 sec bins. Red curve is a Poisson curve with rate = median count rate of data. |
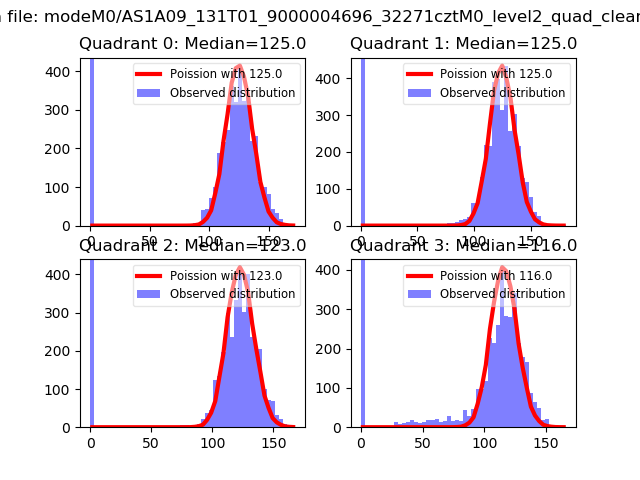 |
 |
| Quadrant-wise count rates Data is divided into 100 sec bins |
 |
|
| Module-wise count rates for Quadrant A Data is divided into 100 sec bins |
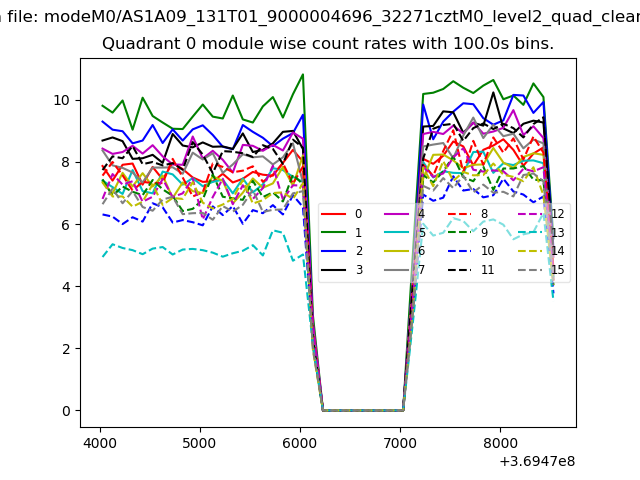 |
 |
| Module-wise count rates for Quadrant B Data is divided into 100 sec bins |
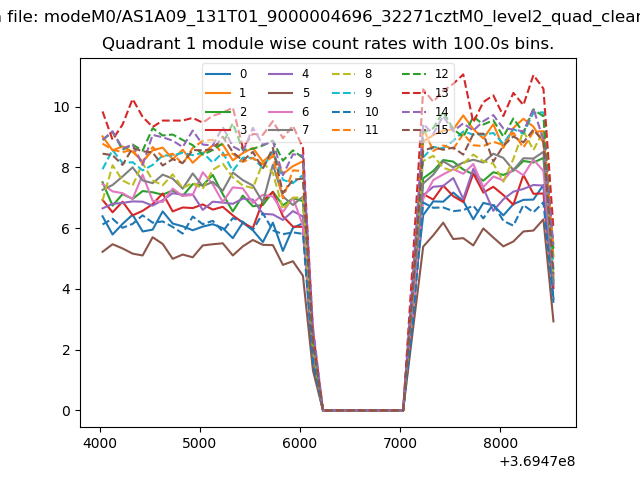 |
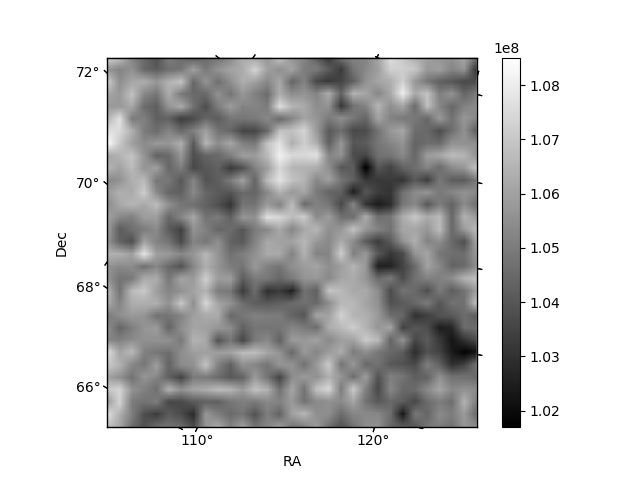 |
| Module-wise count rates for Quadrant C Data is divided into 100 sec bins |
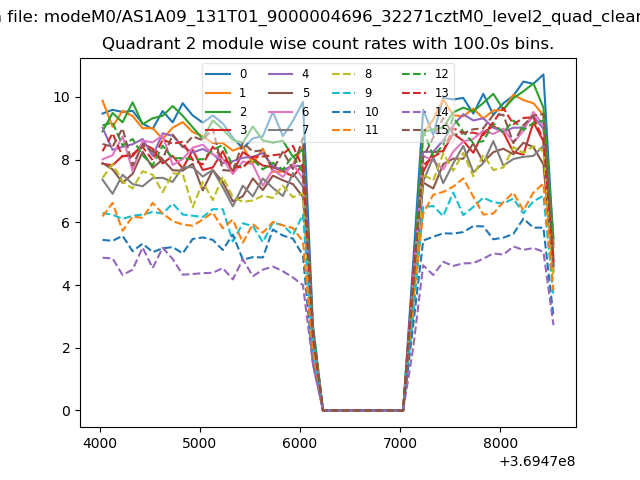 |
 |
| Module-wise count rates for Quadrant D Data is divided into 100 sec bins |
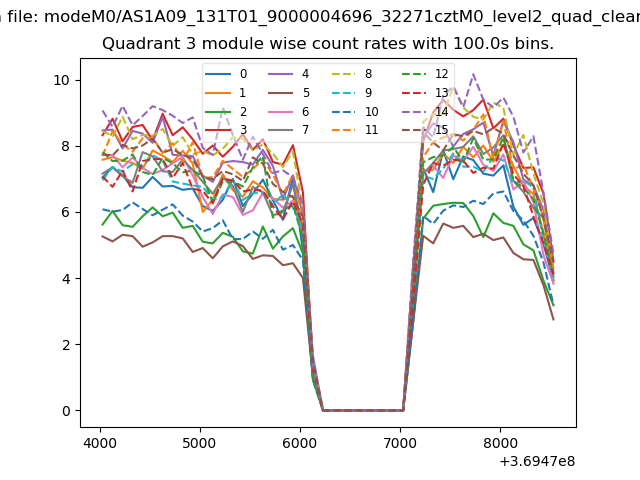 |
 |
| Parameter | Plot |
|---|---|
| CZT HV Monitor | 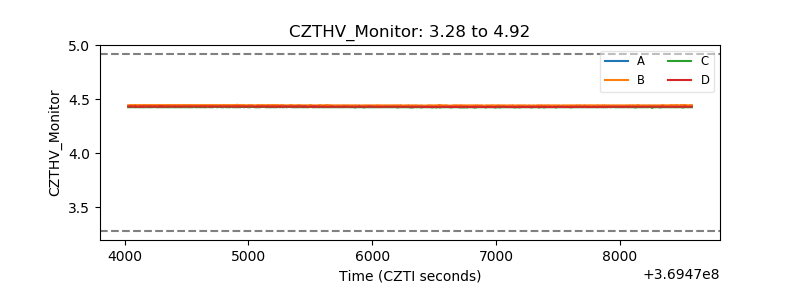 |
| D_VDD | 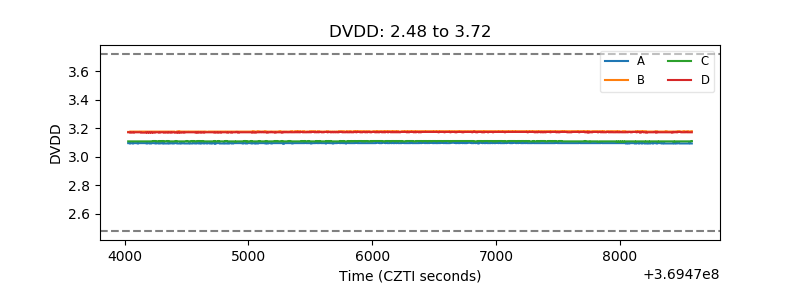 |
| Temperature 1 | 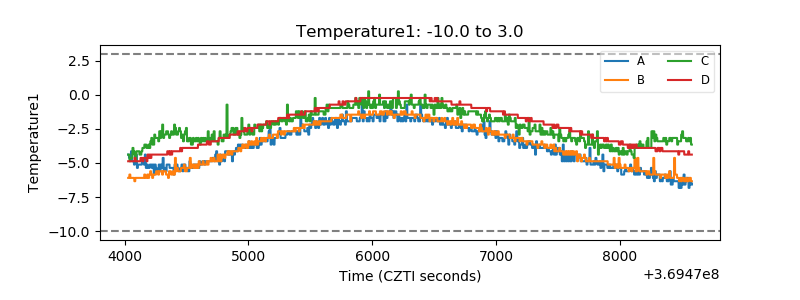 |
| Veto HV Monitor | 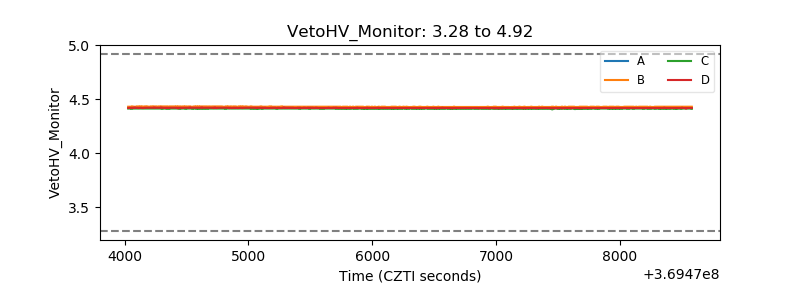 |
| Veto LLD | 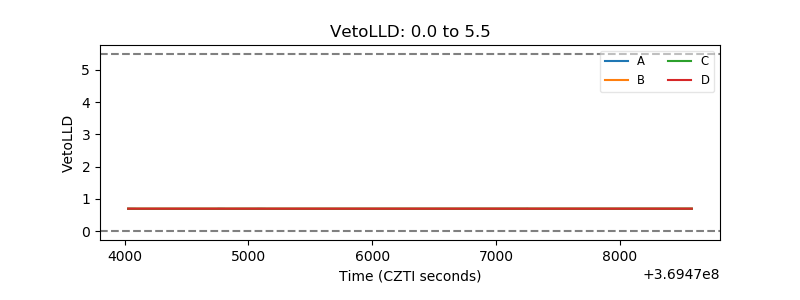 |
| Alpha Counter |  |
| _CPM_Rate | 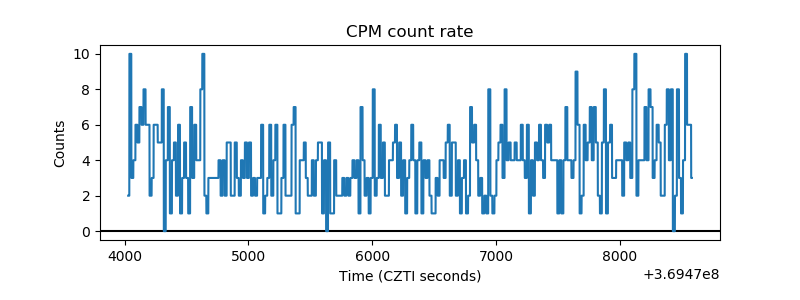 |
| CZT Counter |  |
| +2.5 Volts monitor |  |
| +5 Volts monitor |  |
| _ROLL_ROT | 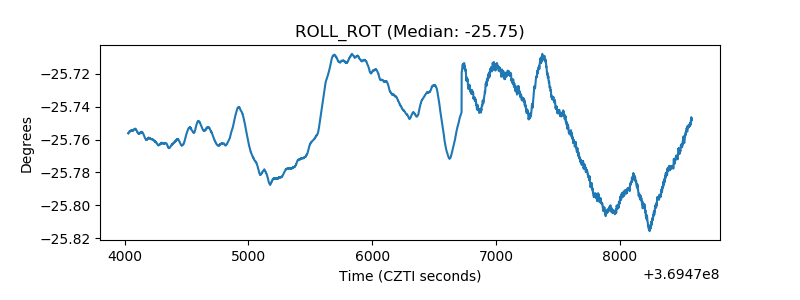 |
| _Roll_DEC | 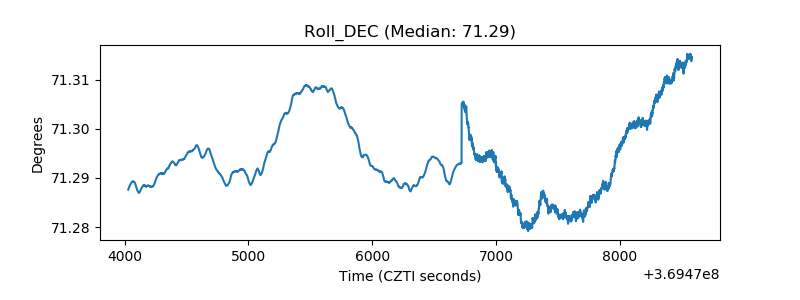 |
| _Roll_RA |  |
| Veto Counter | 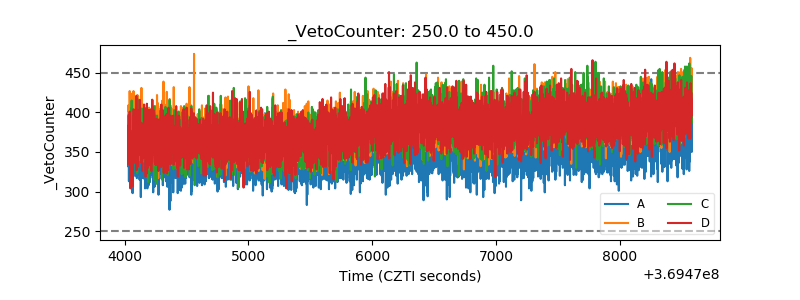 |