| Param | Original file | Final file |
|---|---|---|
| Filename | modeM0/AS1A09_131T01_9000004696_32274cztM0_level2.evt | modeM0/AS1A09_131T01_9000004696_32274cztM0_level2_quad_clean.evt |
| Size (bytes) | 1,258,381,440 | 190,702,080 |
| Size | 1.2 GB | 181.9 MB |
| Events in quadrant A | 5,862,028 | 1,266,991 |
| Events in quadrant B | 12,694,205 | 1,234,466 |
| Events in quadrant C | 8,441,897 | 1,208,823 |
| Events in quadrant D | 10,267,750 | 1,197,840 |
| Mode SS | |||
|---|---|---|---|
| Quadrant | BADHDUFLAG | Total packets | Discarded packets |
| A | 0 | 254 | 0 |
| B | 0 | 254 | 0 |
| C | 0 | 254 | 0 |
| D | 0 | 254 | 0 |
| Mode M9 | |||
|---|---|---|---|
| Quadrant | BADHDUFLAG | Total packets | Discarded packets |
| A | 0 | 17 | 0 |
| B | 0 | 17 | 0 |
| C | 0 | 17 | 0 |
| D | 0 | 18 | 0 |
| Mode M0 | |||
|---|---|---|---|
| Quadrant | BADHDUFLAG | Total packets | Discarded packets |
| A | 0 | 25526 | 4 |
| B | 0 | 46796 | 3 |
| C | 0 | 32891 | 3 |
| D | 0 | 39359 | 3 |
| Quadrant | Total seconds | Saturated seconds | Saturation percentage |
|---|---|---|---|
| A | 12550 | 88 | 0.701195% |
| B | 12550 | 1193 | 9.505976% |
| C | 12550 | 759 | 6.047809% |
| D | 12550 | 443 | 3.529880% |
Noise dominated data is calculated using 1-second bins in cleaned event files. If a bin has >2000 counts, and if more than 50% of those come from <1% of pixels, then it is considered to be noise-dominated and hence unusable.
| Quadrant | # 1 sec bins | Bins with >0 counts | Bins with >2000 counts | High rate bins dominated by noise | Noise dominated (total time) | Noise dominated (detector-on time) | Marked lightcurve |
|---|---|---|---|---|---|---|---|
| A | 14145 | 12552 | 1 | 1 | 0.01% | 0.01% | 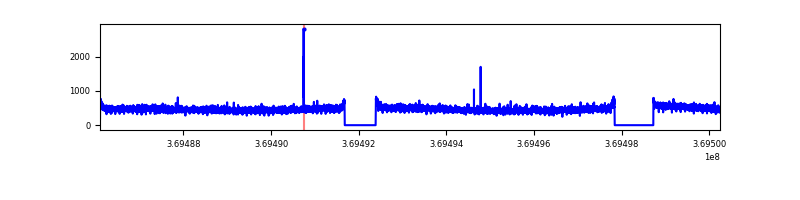 |
| B | 14145 | 12552 | 590 | 590 | 4.17% | 4.70% | 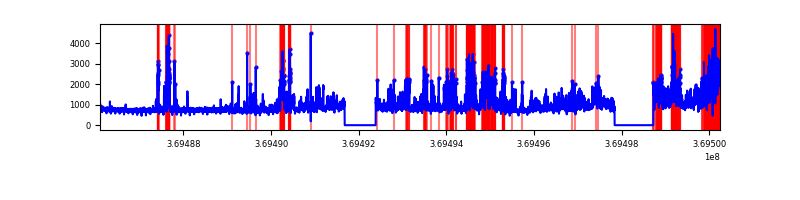 |
| C | 14145 | 12552 | 402 | 402 | 2.84% | 3.20% | 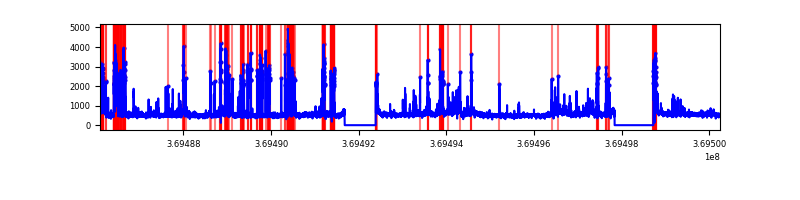 |
| D | 14145 | 12552 | 287 | 287 | 2.03% | 2.29% | 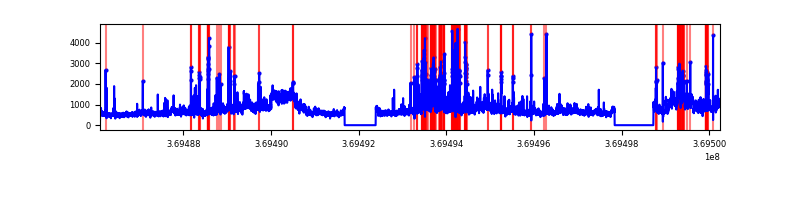 |
Top three noisy pixels from each quadrant. If the there are fewer than three noisy pixels in the level2.evt file, extra rows are filled as -1
| Pixel properties | Quadrant properties | ||||||
|---|---|---|---|---|---|---|---|
| Quadrant | DetID | PixID | Counts | Sigma | Mean | Median | Sigma |
| A | 13 | 6 | 27559 | 86.96 | 1506 | 1469 | 300.0 |
| A | 13 | 254 | 23273 | 72.67 | 1506 | 1469 | 300.0 |
| A | 3 | 137 | 14961 | 44.97 | 1506 | 1469 | 300.0 |
| B | 6 | 159 | 3371814 | 12250.22 | 1452 | 1410 | 275.1 |
| B | 4 | 80 | 2890934 | 10502.39 | 1452 | 1410 | 275.1 |
| B | 5 | 172 | 445245 | 1613.18 | 1452 | 1410 | 275.1 |
| C | 0 | 10 | 1887564 | 5718.91 | 1415 | 1418 | 329.8 |
| C | 3 | 233 | 686068 | 2075.9 | 1415 | 1418 | 329.8 |
| C | 14 | 238 | 229461 | 691.44 | 1415 | 1418 | 329.8 |
| D | 8 | 195 | 3343252 | 9668.1 | 1444 | 1403 | 345.7 |
| D | 12 | 233 | 710575 | 2051.66 | 1444 | 1403 | 345.7 |
| D | 13 | 249 | 309070 | 890.09 | 1444 | 1403 | 345.7 |
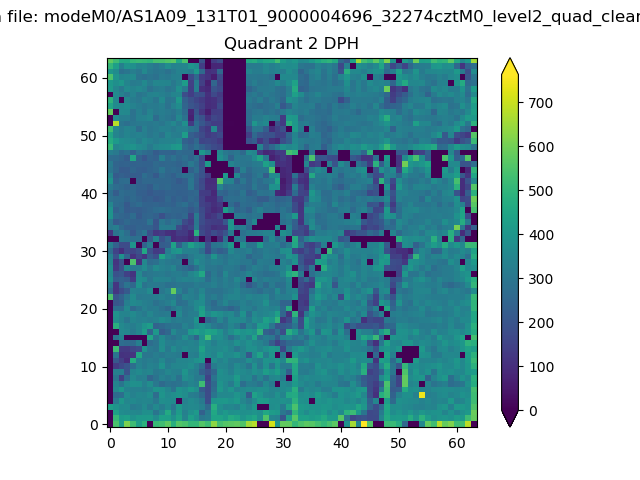
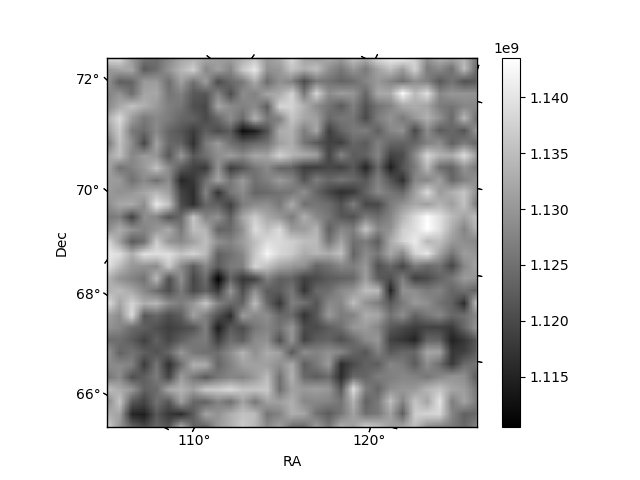
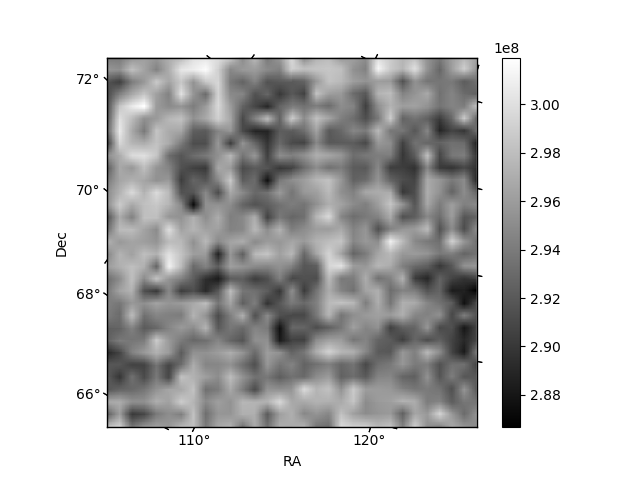
Histogram calculated using DETX and DETY for each event in the final _common_clean file
| Quadrant A | 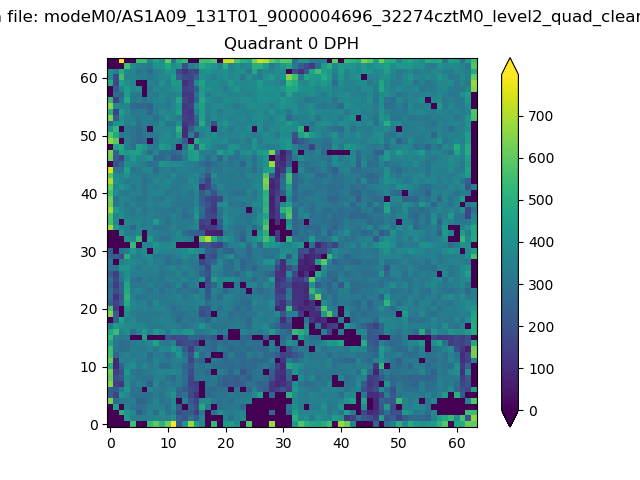 |
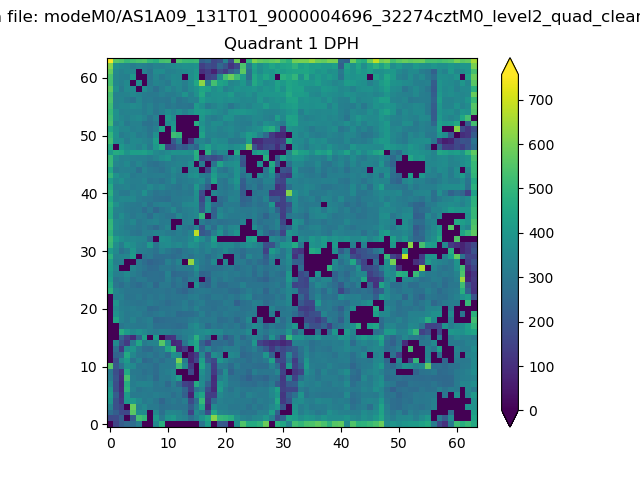 |
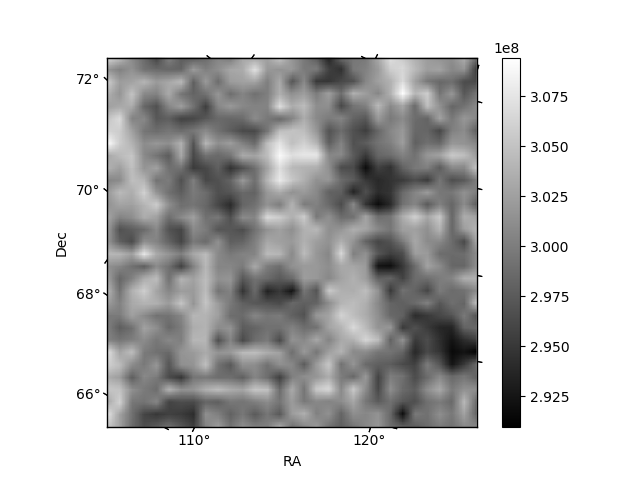
Quadrant B |
|---|---|---|---|
| Quadrant D | 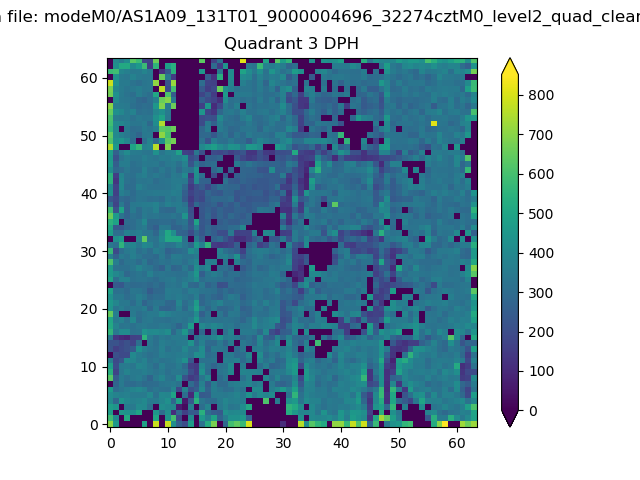 |
 |
Quadrant C |
| Plot type | Count rate plots | Images |
|---|---|---|
| Comparison with Poisson distribution Blue bars denote a histogram of data divided into 1 sec bins. Red curve is a Poisson curve with rate = median count rate of data. |
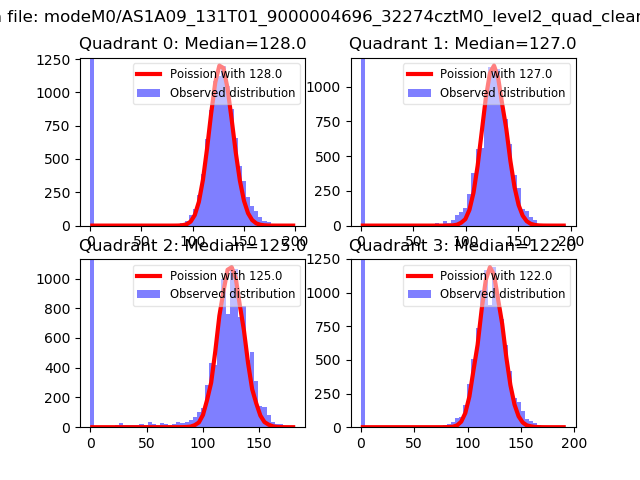 |
 |
| Quadrant-wise count rates Data is divided into 100 sec bins |
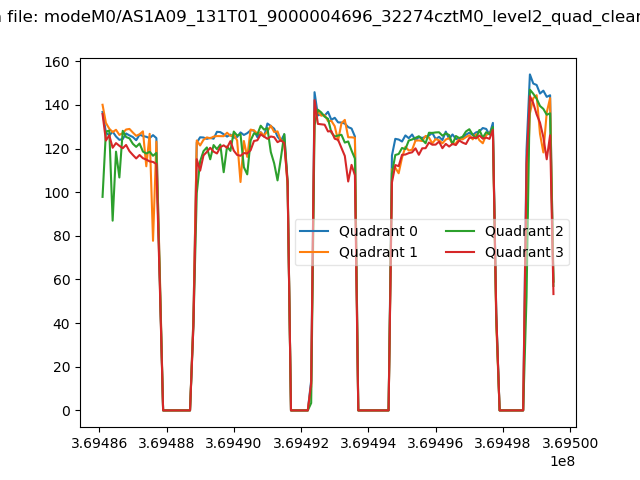 |
|
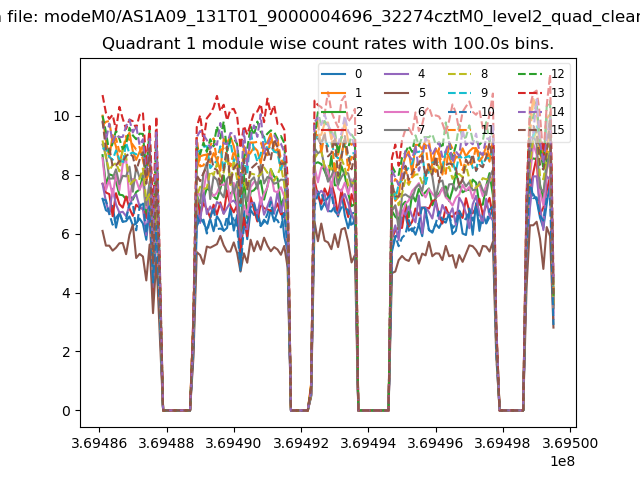
| Module-wise count rates for Quadrant A Data is divided into 100 sec bins |
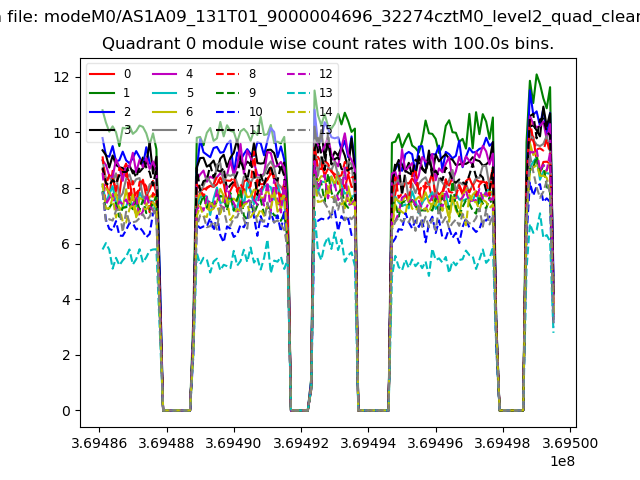 |
 |
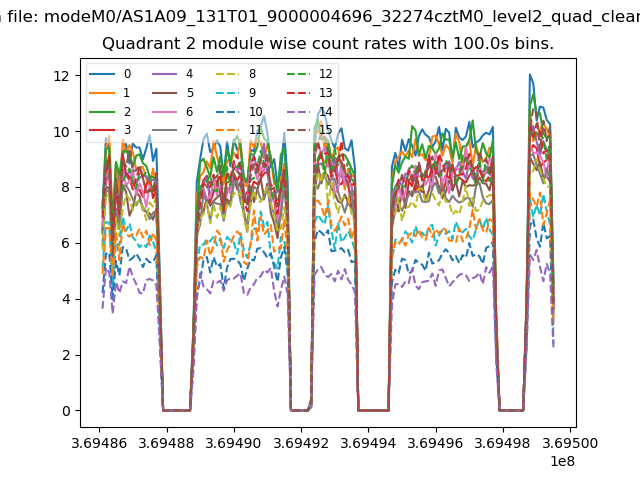
| Module-wise count rates for Quadrant B Data is divided into 100 sec bins |
 |
 |
| Module-wise count rates for Quadrant C Data is divided into 100 sec bins |
 |
 |
| Module-wise count rates for Quadrant D Data is divided into 100 sec bins |
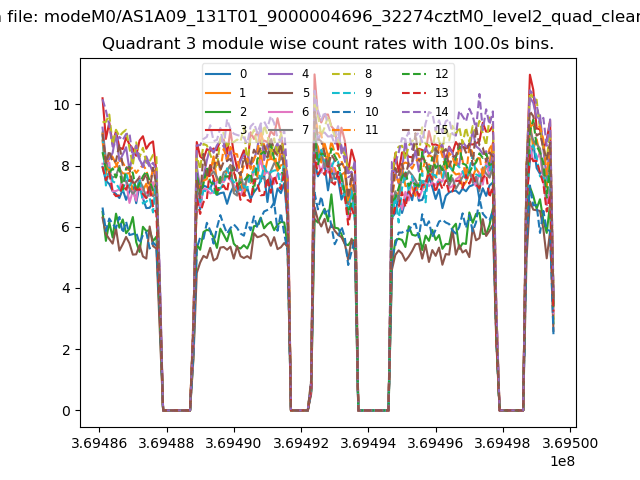 |
 |
| Parameter | Plot |
|---|---|
| CZT HV Monitor | 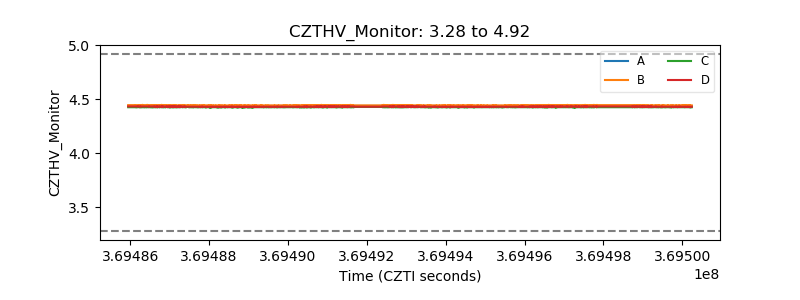 |
| D_VDD | 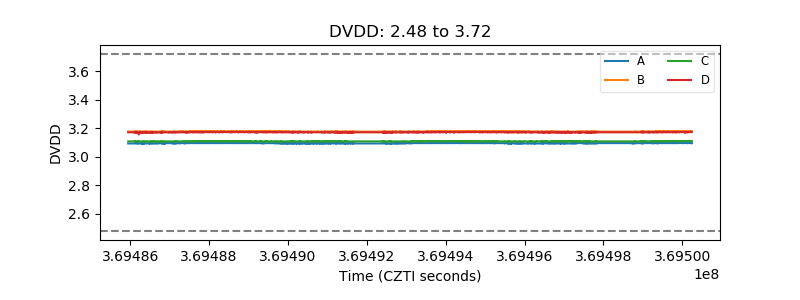 |
| Temperature 1 | 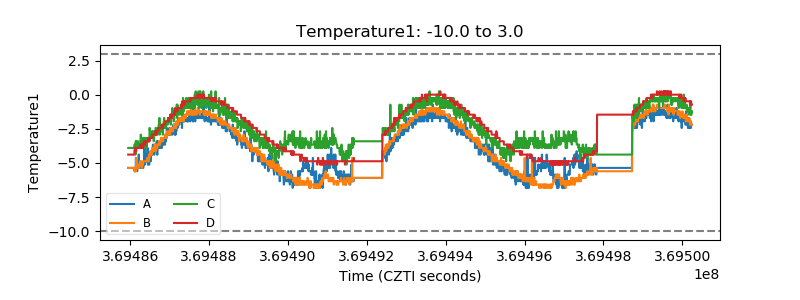 |
| Veto HV Monitor | 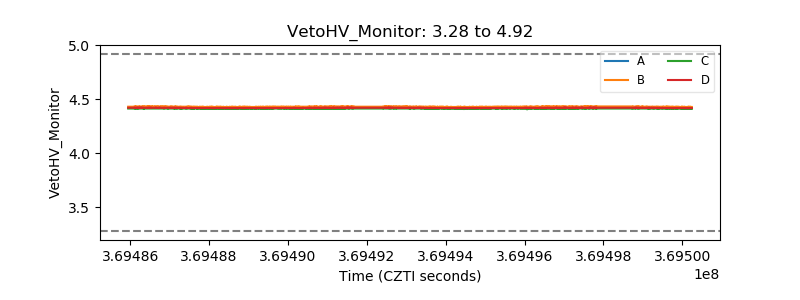 |
| Veto LLD | 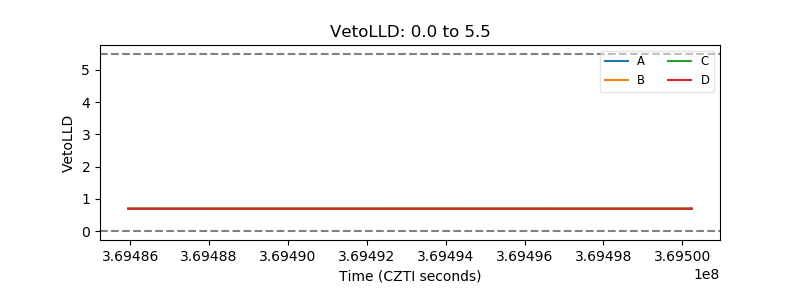 |
| Alpha Counter | 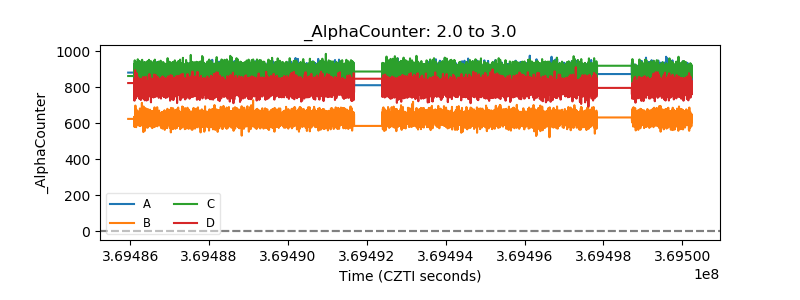 |
| _CPM_Rate | 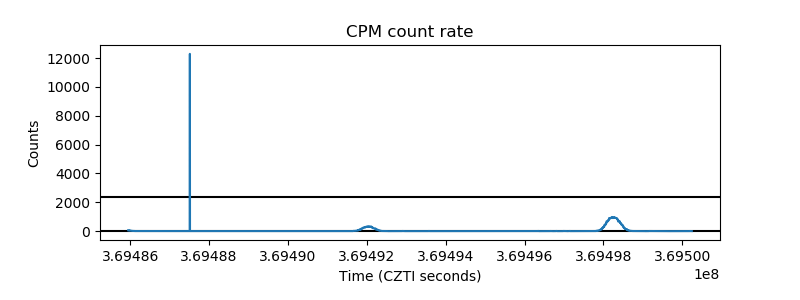 |
| CZT Counter | 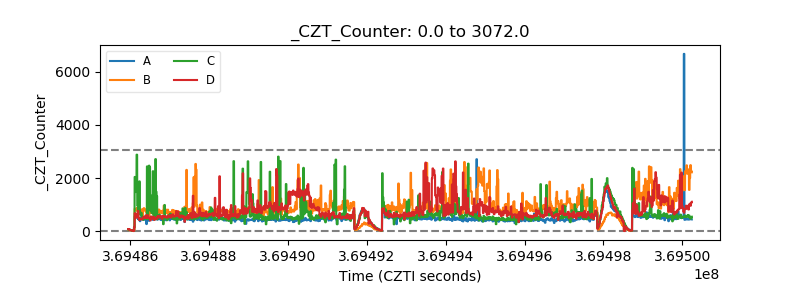 |
| +2.5 Volts monitor |  |
| +5 Volts monitor |  |
| _ROLL_ROT | 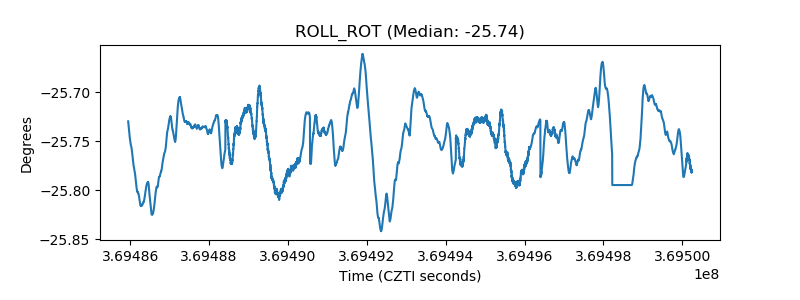 |
| _Roll_DEC | 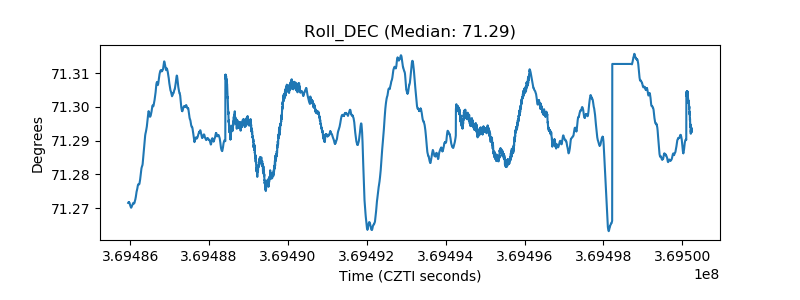 |
| _Roll_RA | 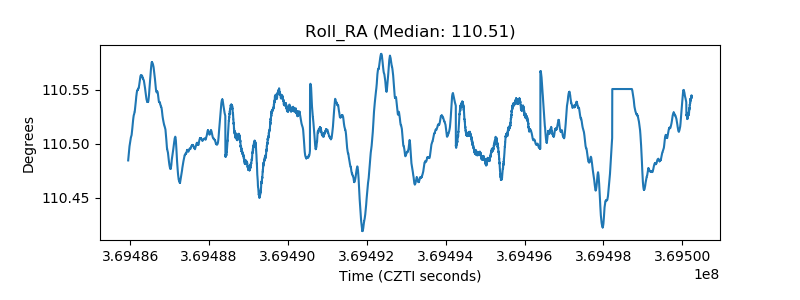 |
| Veto Counter | 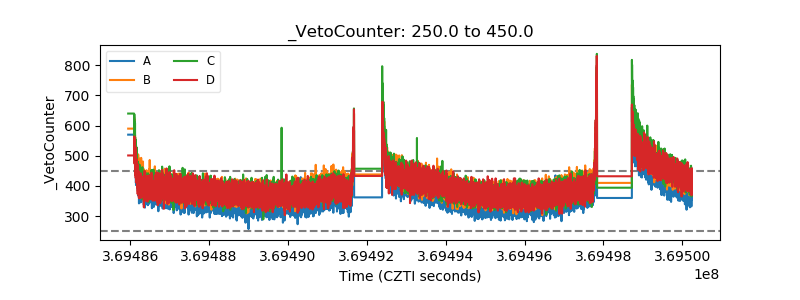 |