| Param | Original file | Final file |
|---|---|---|
| Filename | modeM0/AS1A09_131T01_9000004696_32275cztM0_level2.evt | modeM0/AS1A09_131T01_9000004696_32275cztM0_level2_quad_clean.evt |
| Size (bytes) | 622,581,120 | 80,475,840 |
| Size | 593.7 MB | 76.7 MB |
| Events in quadrant A | 2,829,571 | 519,207 |
| Events in quadrant B | 6,497,656 | 503,628 |
| Events in quadrant C | 3,235,251 | 513,346 |
| Events in quadrant D | 5,890,223 | 484,732 |
| Mode SS | |||
|---|---|---|---|
| Quadrant | BADHDUFLAG | Total packets | Discarded packets |
| A | 0 | 122 | 0 |
| B | 0 | 122 | 0 |
| C | 0 | 122 | 0 |
| D | 0 | 122 | 0 |
| Mode M9 | |||
|---|---|---|---|
| Quadrant | BADHDUFLAG | Total packets | Discarded packets |
| A | 0 | 10 | 0 |
| B | 0 | 10 | 0 |
| C | 0 | 10 | 0 |
| D | 0 | 10 | 0 |
| Mode M0 | |||
|---|---|---|---|
| Quadrant | BADHDUFLAG | Total packets | Discarded packets |
| A | 0 | 12371 | 2 |
| B | 0 | 23583 | 1 |
| C | 0 | 13417 | 1 |
| D | 0 | 21576 | 1 |
| Quadrant | Total seconds | Saturated seconds | Saturation percentage |
|---|---|---|---|
| A | 5949 | 31 | 0.521096% |
| B | 5949 | 742 | 12.472684% |
| C | 5949 | 198 | 3.328290% |
| D | 5949 | 429 | 7.211296% |
Noise dominated data is calculated using 1-second bins in cleaned event files. If a bin has >2000 counts, and if more than 50% of those come from <1% of pixels, then it is considered to be noise-dominated and hence unusable.
| Quadrant | # 1 sec bins | Bins with >0 counts | Bins with >2000 counts | High rate bins dominated by noise | Noise dominated (total time) | Noise dominated (detector-on time) | Marked lightcurve |
|---|---|---|---|---|---|---|---|
| A | 7034 | 5950 | 0 | 0 | 0.00% | 0.00% | 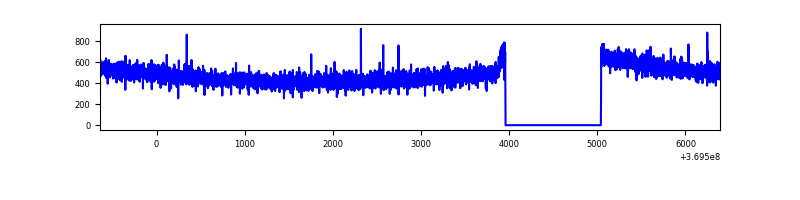 |
| B | 7034 | 5950 | 476 | 476 | 6.77% | 8.00% | 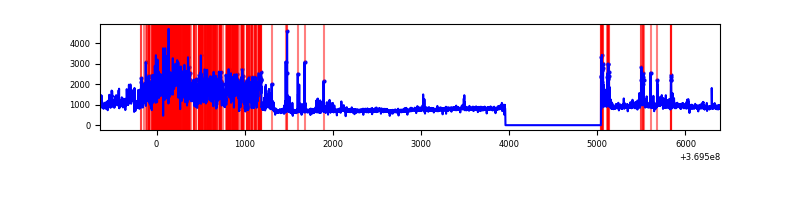 |
| C | 7034 | 5950 | 22 | 22 | 0.31% | 0.37% |  |
| D | 7034 | 5950 | 298 | 298 | 4.24% | 5.01% | 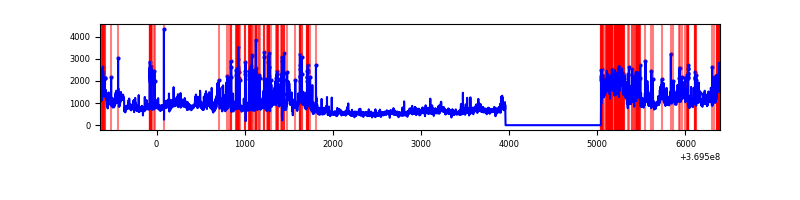 |
Top three noisy pixels from each quadrant. If the there are fewer than three noisy pixels in the level2.evt file, extra rows are filled as -1
| Pixel properties | Quadrant properties | ||||||
|---|---|---|---|---|---|---|---|
| Quadrant | DetID | PixID | Counts | Sigma | Mean | Median | Sigma |
| A | 13 | 254 | 11079 | 70.57 | 729 | 713 | 146.9 |
| A | 13 | 6 | 10430 | 66.15 | 729 | 713 | 146.9 |
| A | 3 | 137 | 7095 | 43.45 | 729 | 713 | 146.9 |
| B | 6 | 159 | 1678322 | 12714.52 | 699 | 682 | 131.9 |
| B | 4 | 80 | 1555977 | 11787.29 | 699 | 682 | 131.9 |
| B | 5 | 172 | 354082 | 2678.35 | 699 | 682 | 131.9 |
| C | 3 | 233 | 163370 | 999.84 | 703 | 706 | 162.7 |
| C | 14 | 238 | 139990 | 856.13 | 703 | 706 | 162.7 |
| C | 4 | 175 | 65172 | 396.25 | 703 | 706 | 162.7 |
| D | 8 | 195 | 1771082 | 10596.21 | 701 | 680 | 167.1 |
| D | 1 | 52 | 751991 | 4496.75 | 701 | 680 | 167.1 |
| D | 12 | 233 | 248347 | 1482.34 | 701 | 680 | 167.1 |
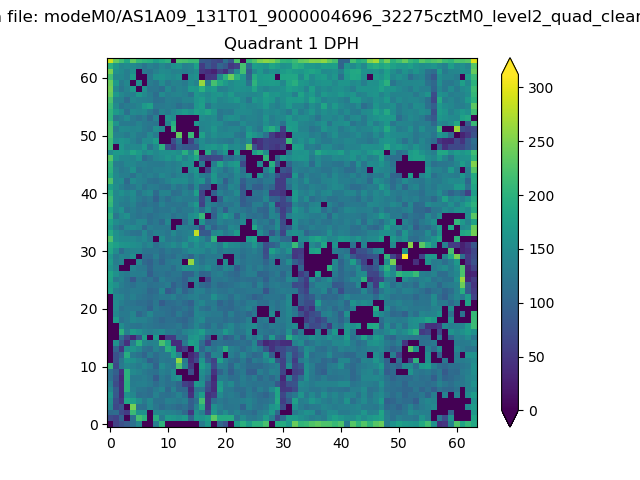
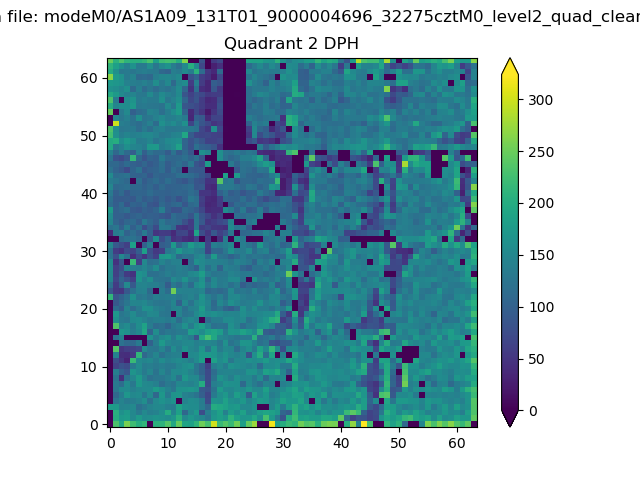
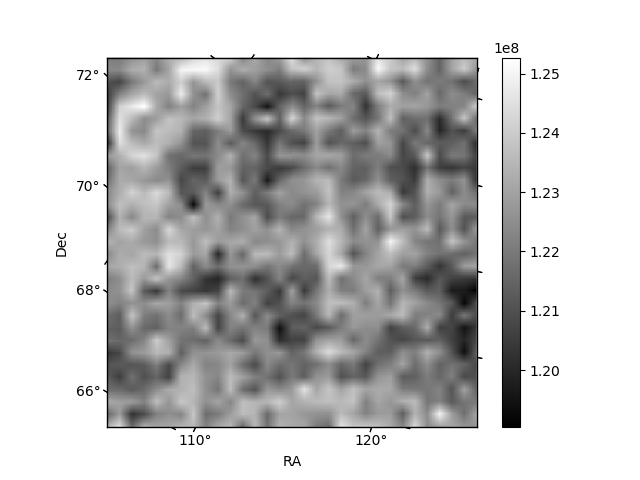
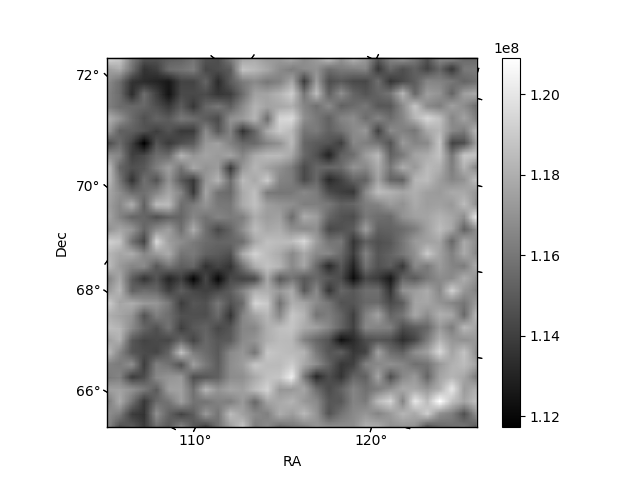
Histogram calculated using DETX and DETY for each event in the final _common_clean file
| Quadrant A |  |
 |
Quadrant B |
|---|---|---|---|
| Quadrant D | 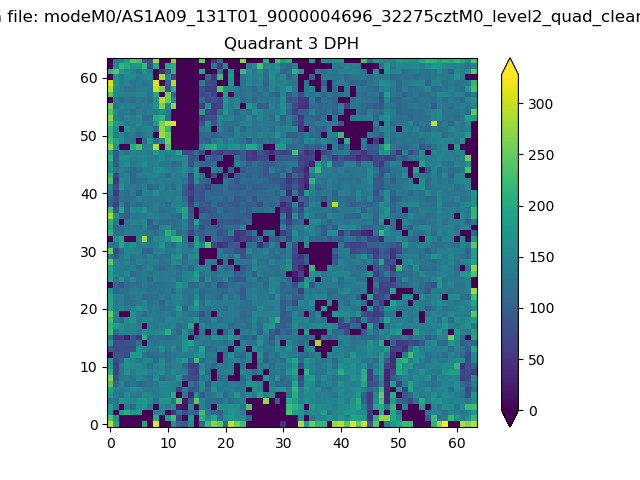 |
 |
Quadrant C |
| Plot type | Count rate plots | Images |
|---|---|---|
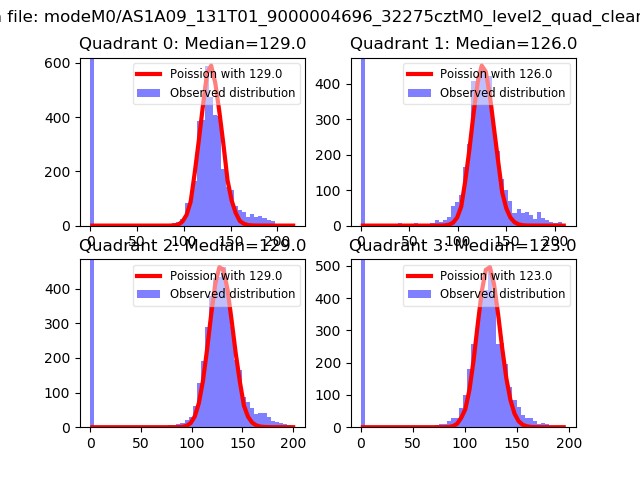
| Comparison with Poisson distribution Blue bars denote a histogram of data divided into 1 sec bins. Red curve is a Poisson curve with rate = median count rate of data. |
 |
 |
| Quadrant-wise count rates Data is divided into 100 sec bins |
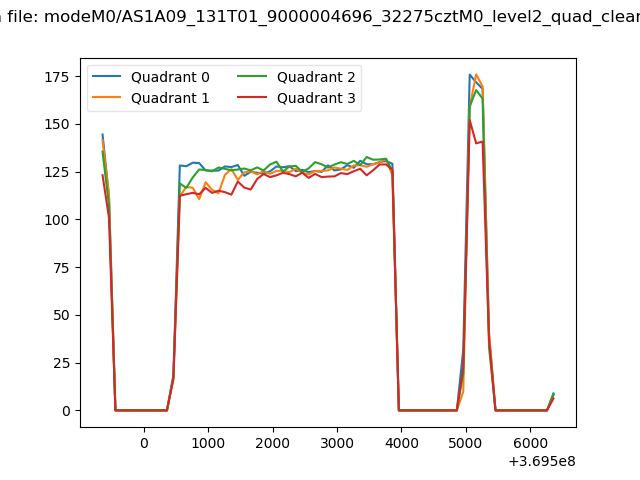 |
|
| Module-wise count rates for Quadrant A Data is divided into 100 sec bins |
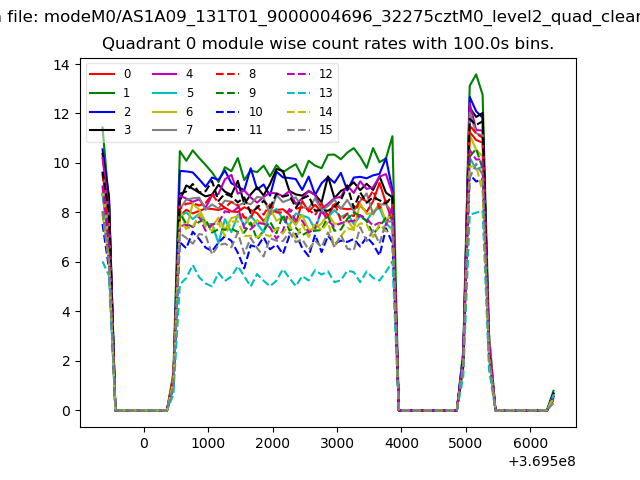 |
 |
| Module-wise count rates for Quadrant B Data is divided into 100 sec bins |
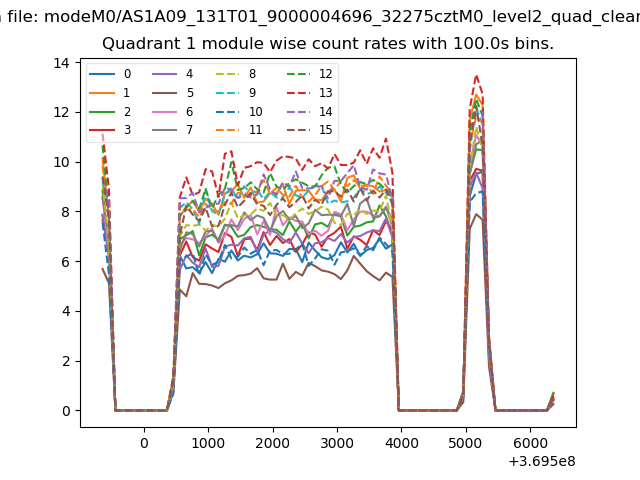 |
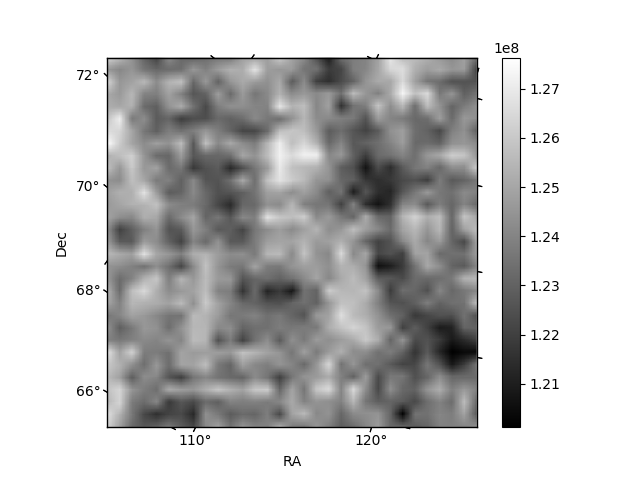 |
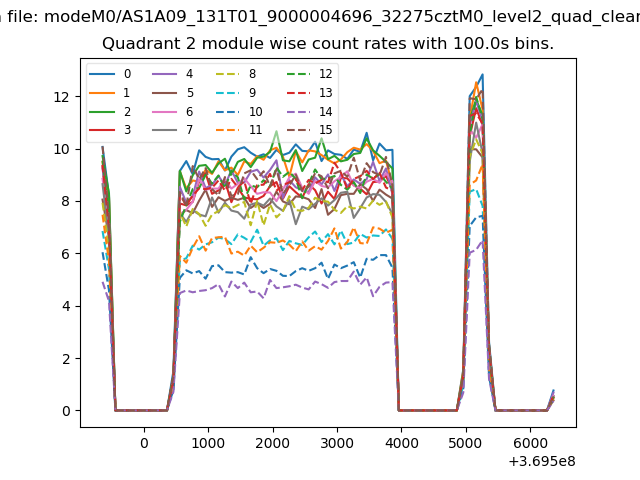
| Module-wise count rates for Quadrant C Data is divided into 100 sec bins |
 |
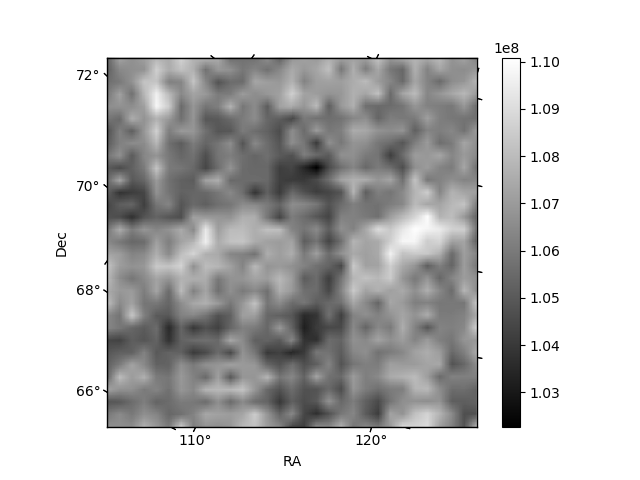 |
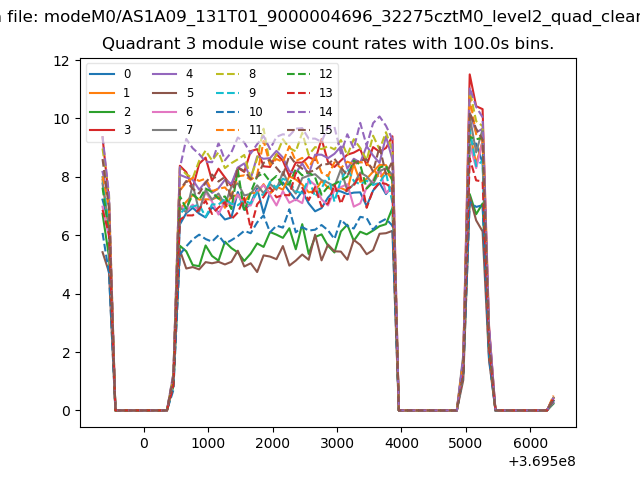
| Module-wise count rates for Quadrant D Data is divided into 100 sec bins |
 |
 |
| Parameter | Plot |
|---|---|
| CZT HV Monitor | 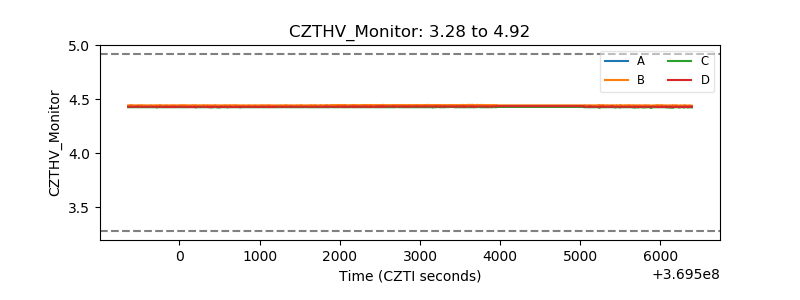 |
| D_VDD | 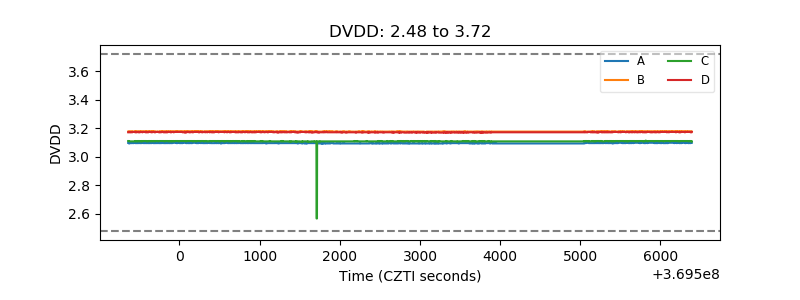 |
| Temperature 1 | 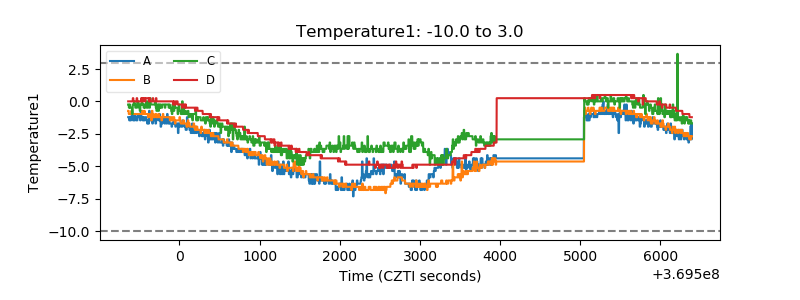 |
| Veto HV Monitor | 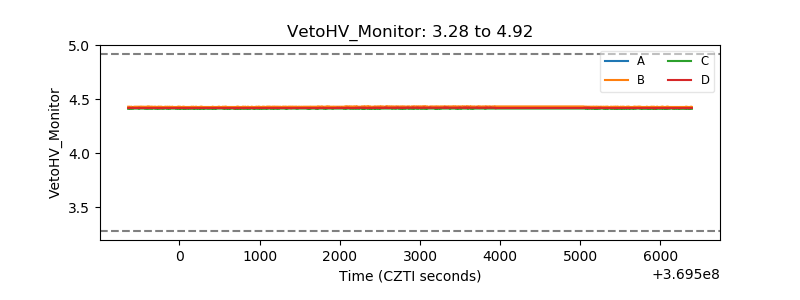 |
| Veto LLD | 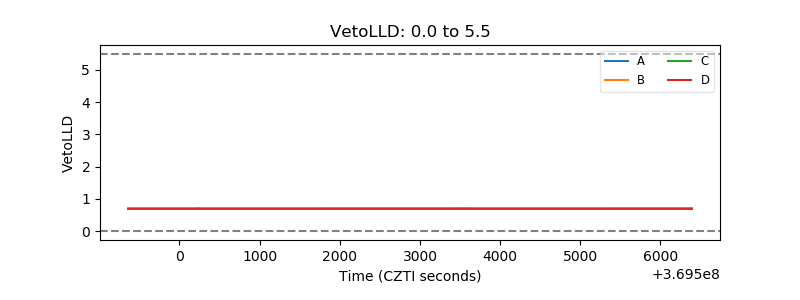 |
| Alpha Counter | 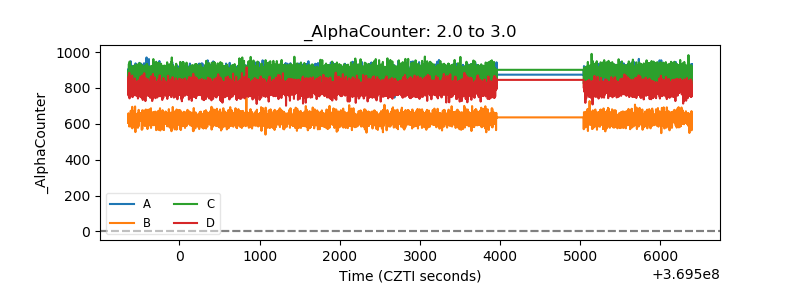 |
| _CPM_Rate | 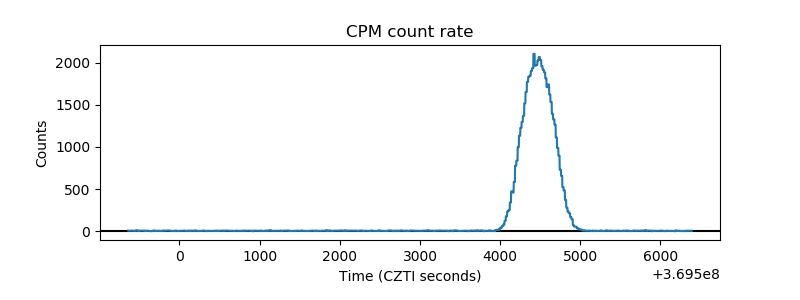 |
| CZT Counter | 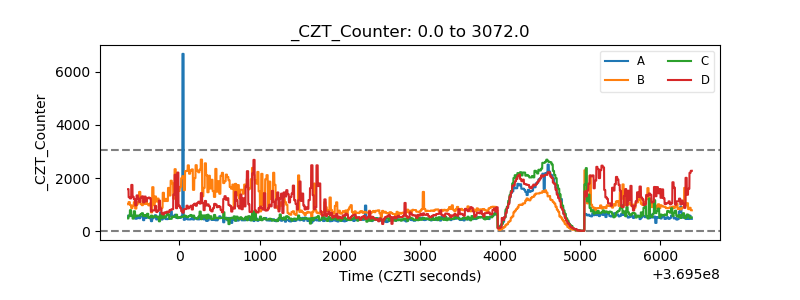 |
| +2.5 Volts monitor | 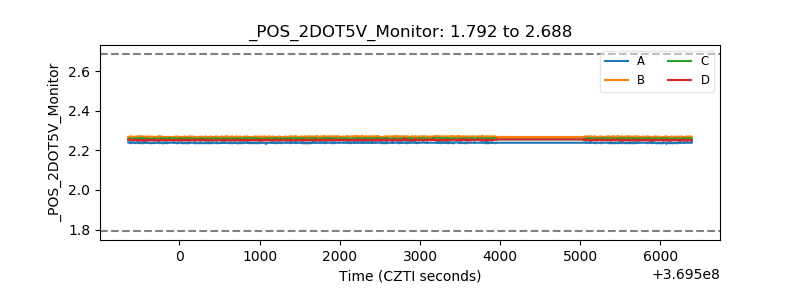 |
| +5 Volts monitor | 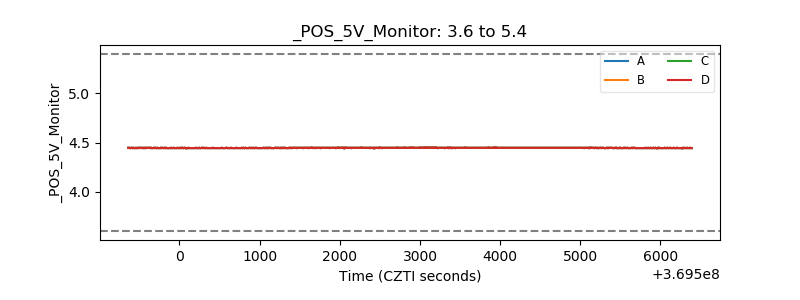 |
| _ROLL_ROT | 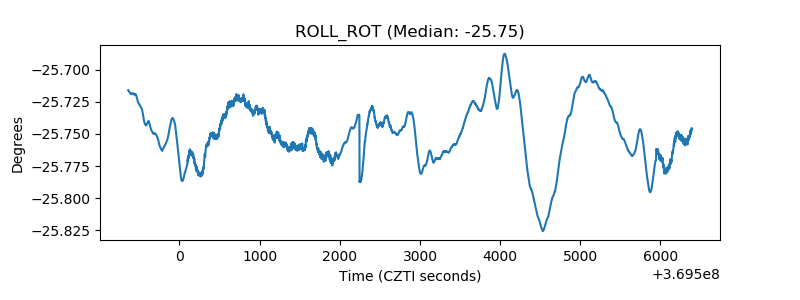 |
| _Roll_DEC | 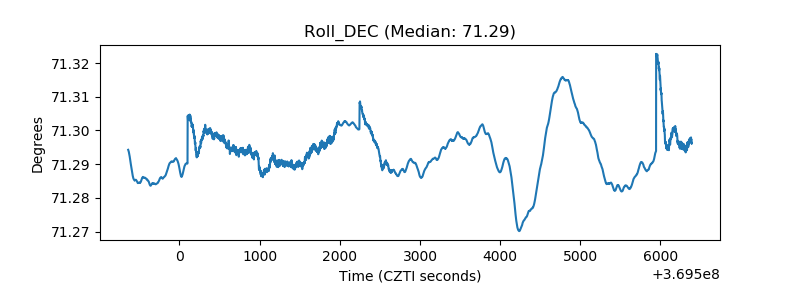 |
| _Roll_RA | 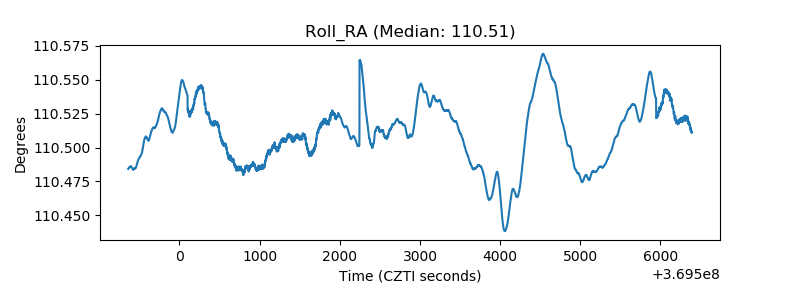 |
| Veto Counter | 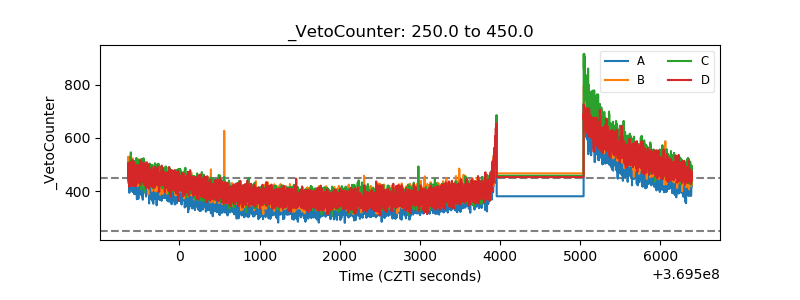 |