| Param | Original file | Final file |
|---|---|---|
| Filename | modeM0/AS1A09_131T01_9000004696_32278cztM0_level2.evt | modeM0/AS1A09_131T01_9000004696_32278cztM0_level2_quad_clean.evt |
| Size (bytes) | 593,444,160 | 103,340,160 |
| Size | 566.0 MB | 98.6 MB |
| Events in quadrant A | 3,077,645 | 680,924 |
| Events in quadrant B | 5,335,092 | 685,846 |
| Events in quadrant C | 3,611,374 | 687,882 |
| Events in quadrant D | 5,542,365 | 655,419 |
| Mode SS | |||
|---|---|---|---|
| Quadrant | BADHDUFLAG | Total packets | Discarded packets |
| A | 0 | 124 | 0 |
| B | 0 | 124 | 0 |
| C | 0 | 124 | 0 |
| D | 0 | 124 | 0 |
| Mode M9 | |||
|---|---|---|---|
| Quadrant | BADHDUFLAG | Total packets | Discarded packets |
| A | 0 | 12 | 0 |
| B | 0 | 12 | 0 |
| C | 0 | 12 | 0 |
| D | 0 | 12 | 0 |
| Mode M0 | |||
|---|---|---|---|
| Quadrant | BADHDUFLAG | Total packets | Discarded packets |
| A | 0 | 13143 | 2 |
| B | 0 | 20274 | 1 |
| C | 0 | 14842 | 1 |
| D | 0 | 20851 | 1 |
| Quadrant | Total seconds | Saturated seconds | Saturation percentage |
|---|---|---|---|
| A | 6003 | 40 | 0.666333% |
| B | 6003 | 170 | 2.831917% |
| C | 6003 | 227 | 3.781443% |
| D | 6003 | 371 | 6.180243% |
Noise dominated data is calculated using 1-second bins in cleaned event files. If a bin has >2000 counts, and if more than 50% of those come from <1% of pixels, then it is considered to be noise-dominated and hence unusable.
| Quadrant | # 1 sec bins | Bins with >0 counts | Bins with >2000 counts | High rate bins dominated by noise | Noise dominated (total time) | Noise dominated (detector-on time) | Marked lightcurve |
|---|---|---|---|---|---|---|---|
| A | 7283 | 6004 | 2 | 2 | 0.03% | 0.03% | 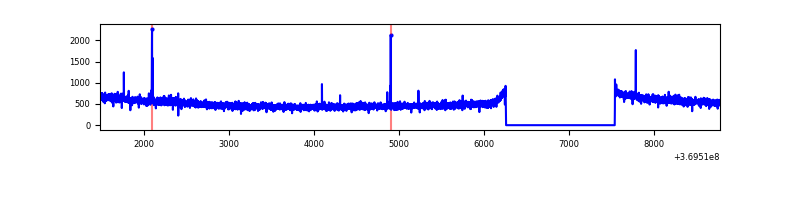 |
| B | 7283 | 6003 | 40 | 40 | 0.55% | 0.67% | 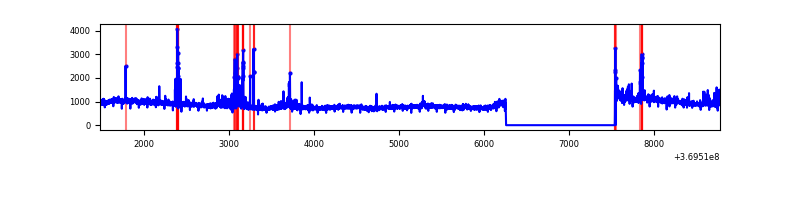 |
| C | 7283 | 6004 | 15 | 15 | 0.21% | 0.25% | 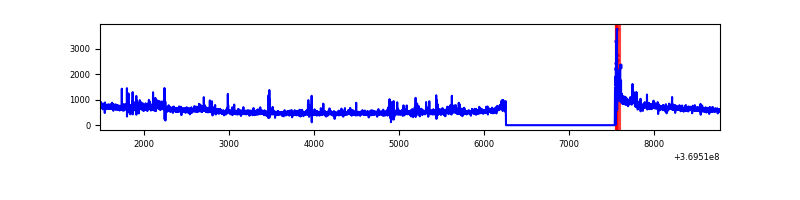 |
| D | 7283 | 6004 | 197 | 197 | 2.70% | 3.28% | 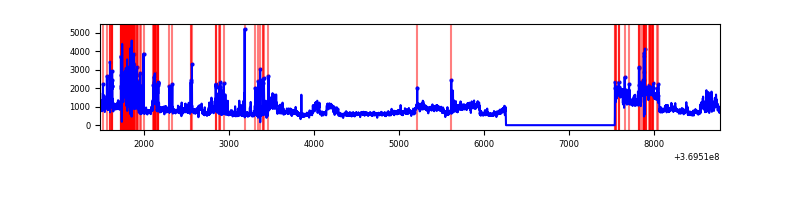 |
Top three noisy pixels from each quadrant. If the there are fewer than three noisy pixels in the level2.evt file, extra rows are filled as -1
| Pixel properties | Quadrant properties | ||||||
|---|---|---|---|---|---|---|---|
| Quadrant | DetID | PixID | Counts | Sigma | Mean | Median | Sigma |
| A | 13 | 6 | 16654 | 102.0 | 787 | 772 | 155.7 |
| A | 13 | 254 | 11577 | 69.39 | 787 | 772 | 155.7 |
| A | 0 | 6 | 11286 | 67.52 | 787 | 772 | 155.7 |
| B | 6 | 159 | 1880733 | 13011.2 | 784 | 765 | 144.5 |
| B | 5 | 172 | 156482 | 1077.71 | 784 | 765 | 144.5 |
| B | 0 | 190 | 114034 | 783.93 | 784 | 765 | 144.5 |
| C | 3 | 233 | 211726 | 1193.25 | 770 | 778 | 176.8 |
| C | 14 | 238 | 155576 | 875.63 | 770 | 778 | 176.8 |
| C | 0 | 10 | 91025 | 510.49 | 770 | 778 | 176.8 |
| D | 8 | 195 | 1993552 | 11092.35 | 760 | 741 | 179.7 |
| D | 12 | 6 | 360461 | 2002.27 | 760 | 741 | 179.7 |
| D | 13 | 249 | 143815 | 796.38 | 760 | 741 | 179.7 |
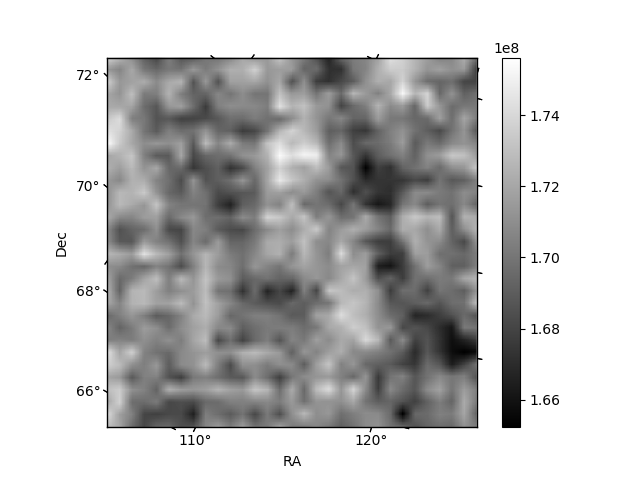
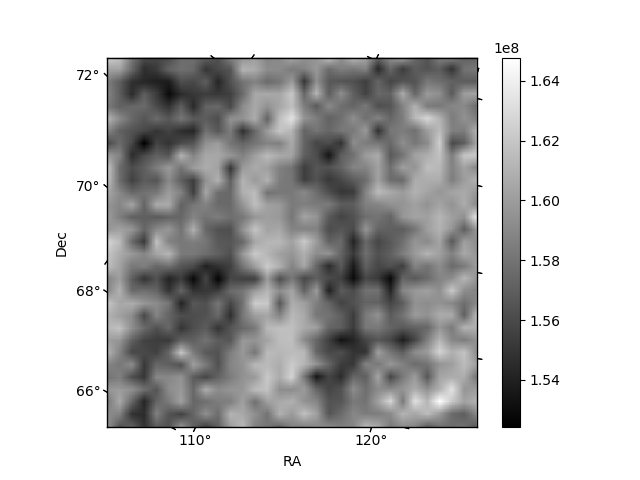
Histogram calculated using DETX and DETY for each event in the final _common_clean file
| Quadrant A | 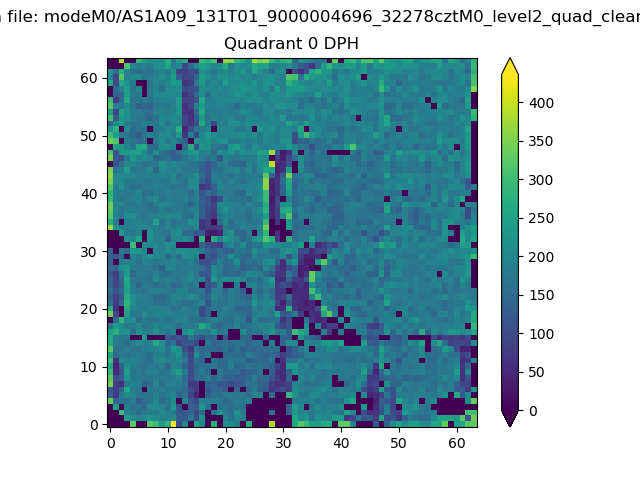 |
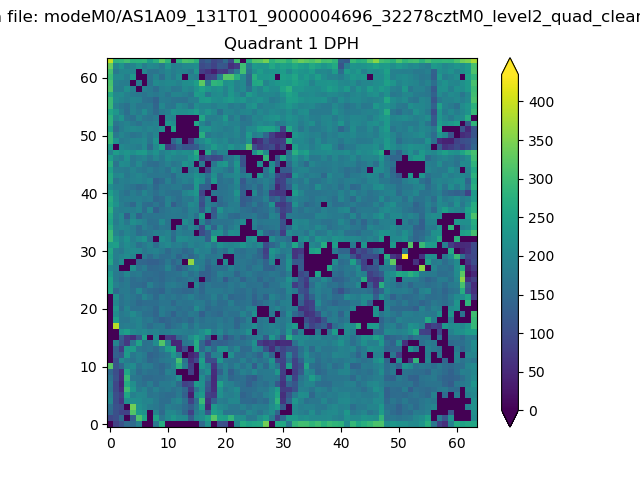 |
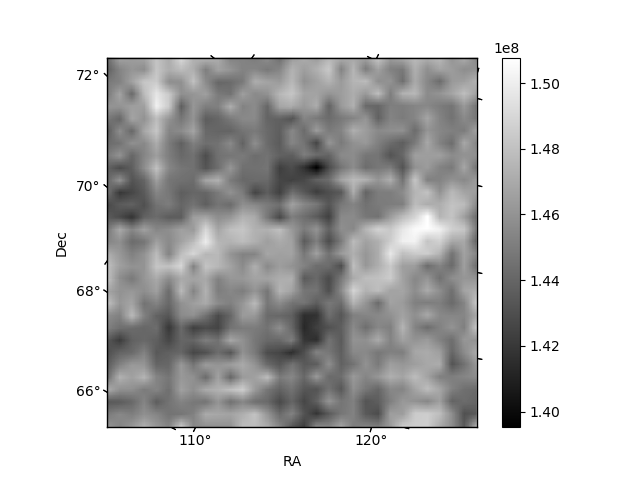
Quadrant B |
|---|---|---|---|
| Quadrant D | 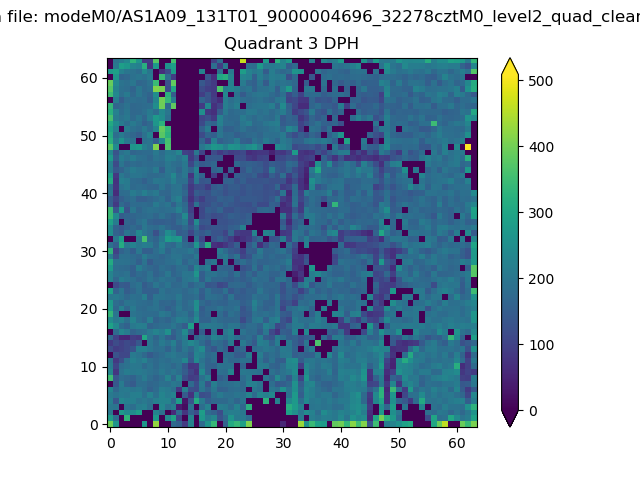 |
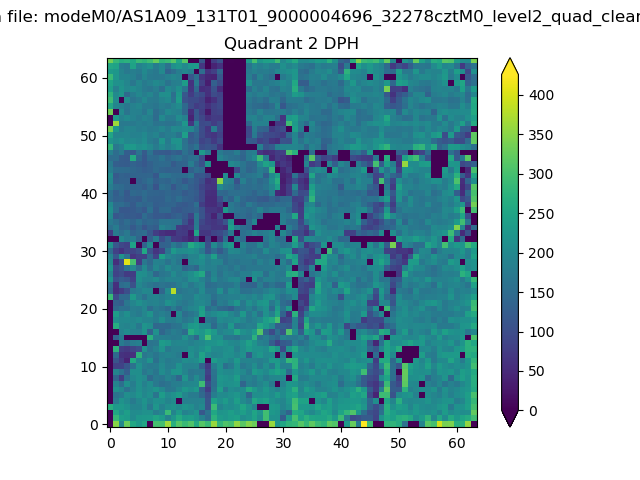 |
Quadrant C |
| Plot type | Count rate plots | Images |
|---|---|---|
| Comparison with Poisson distribution Blue bars denote a histogram of data divided into 1 sec bins. Red curve is a Poisson curve with rate = median count rate of data. |
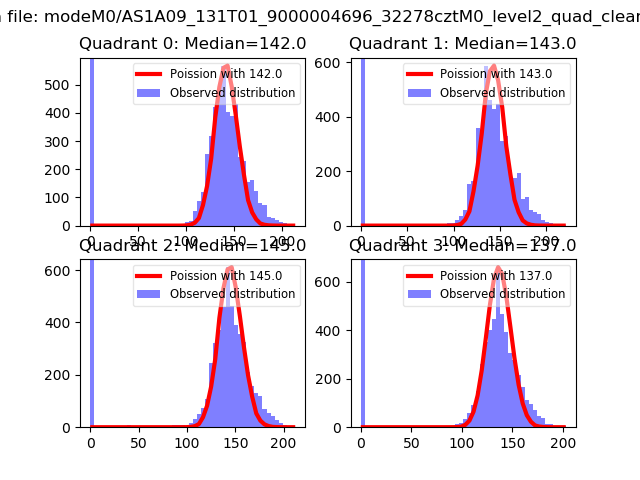 |
 |
| Quadrant-wise count rates Data is divided into 100 sec bins |
 |
|
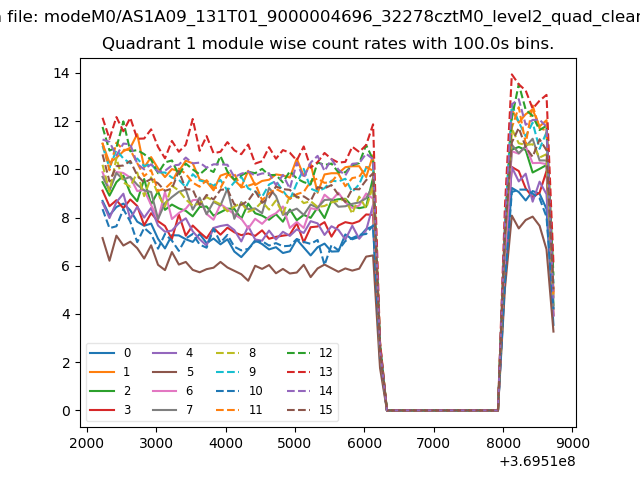
| Module-wise count rates for Quadrant A Data is divided into 100 sec bins |
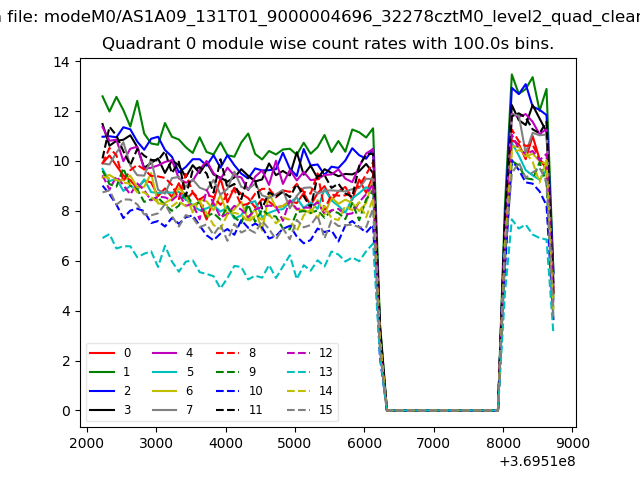 |
 |
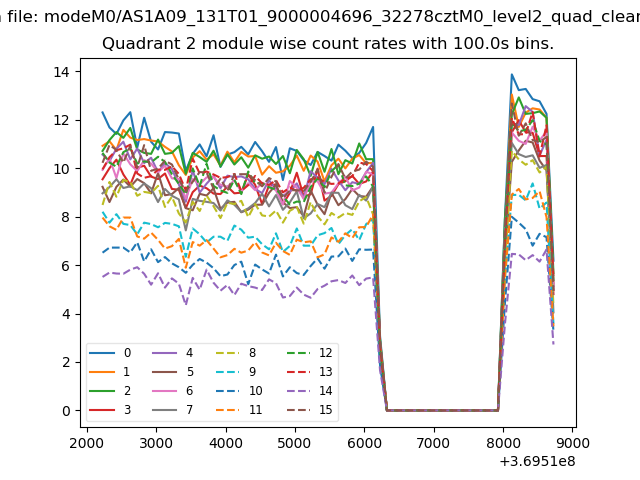
| Module-wise count rates for Quadrant B Data is divided into 100 sec bins |
 |
 |
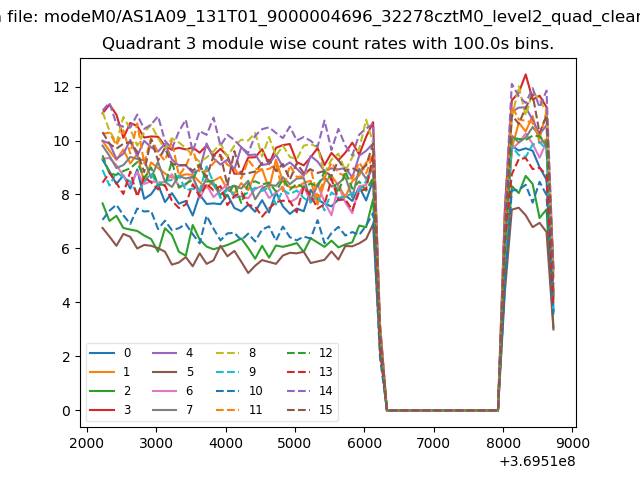
| Module-wise count rates for Quadrant C Data is divided into 100 sec bins |
 |
 |
| Module-wise count rates for Quadrant D Data is divided into 100 sec bins |
 |
 |
| Parameter | Plot |
|---|---|
| CZT HV Monitor | 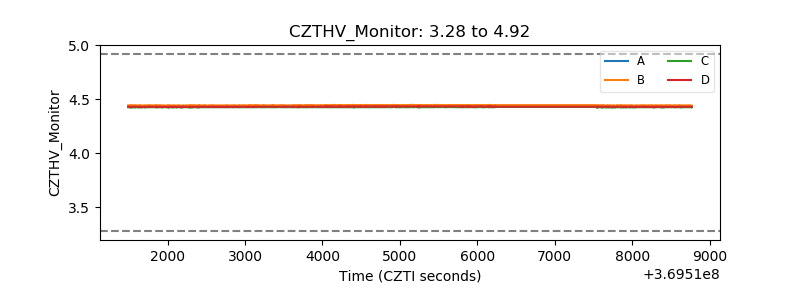 |
| D_VDD | 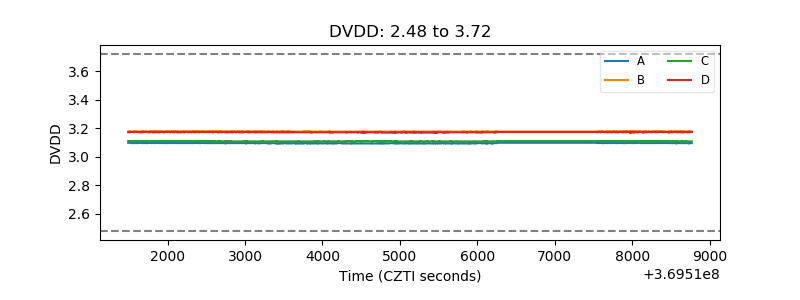 |
| Temperature 1 | 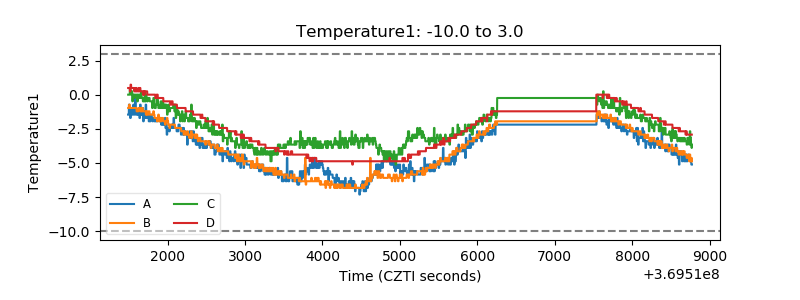 |
| Veto HV Monitor | 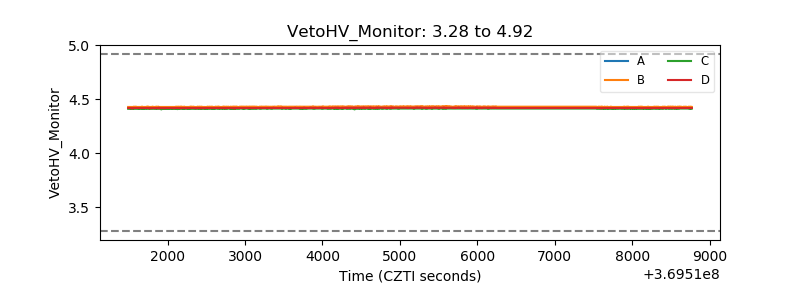 |
| Veto LLD | 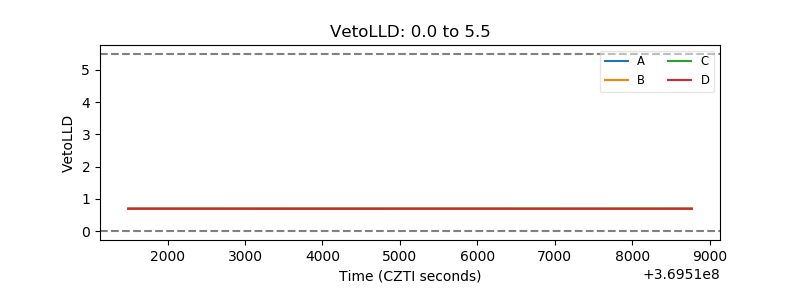 |
| Alpha Counter | 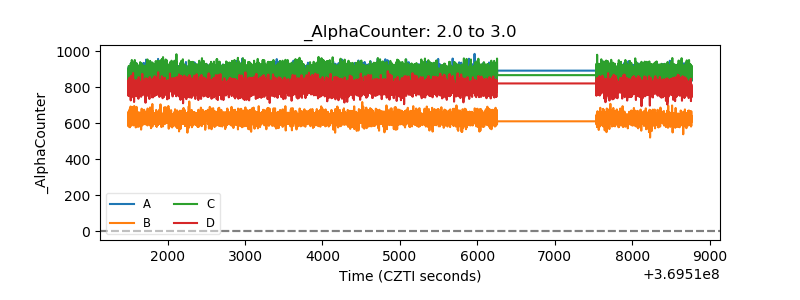 |
| _CPM_Rate | 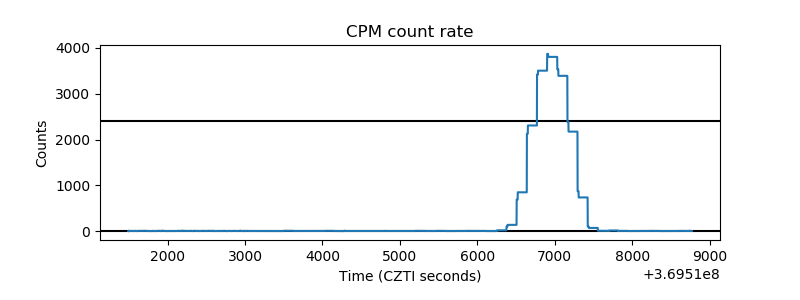 |
| CZT Counter |  |
| +2.5 Volts monitor |  |
| +5 Volts monitor |  |
| _ROLL_ROT | 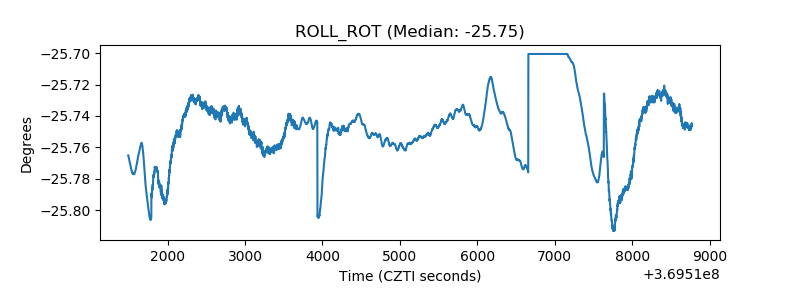 |
| _Roll_DEC | 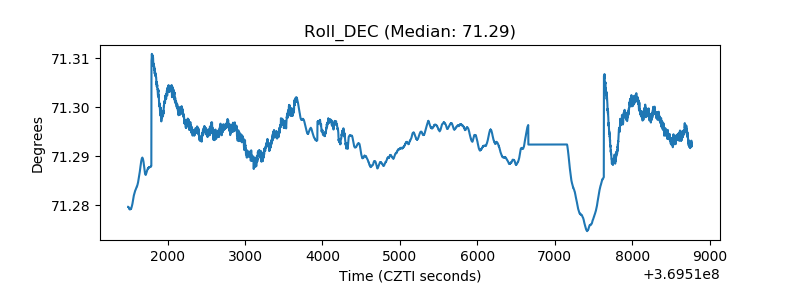 |
| _Roll_RA | 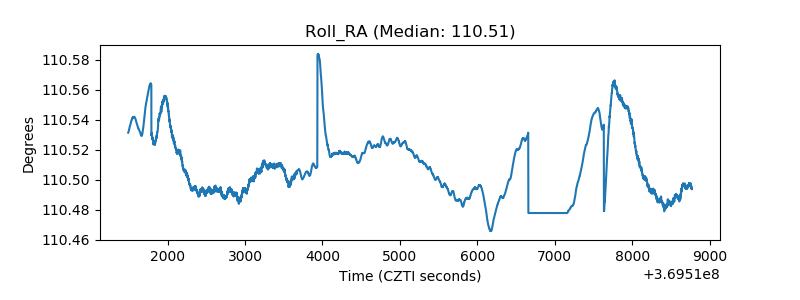 |
| Veto Counter | 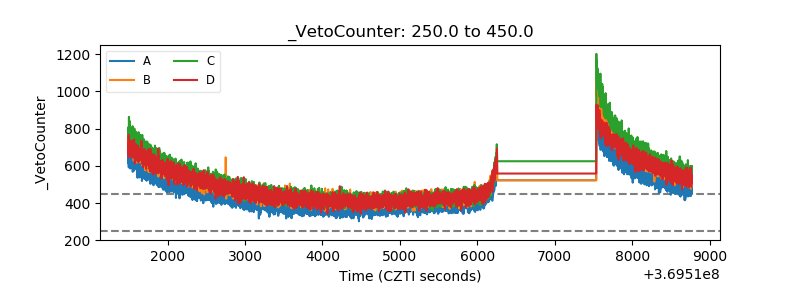 |