| Param | Original file | Final file |
|---|---|---|
| Filename | modeM0/AS1A09_131T01_9000004696_32279cztM0_level2.evt | modeM0/AS1A09_131T01_9000004696_32279cztM0_level2_quad_clean.evt |
| Size (bytes) | 609,079,680 | 124,810,560 |
| Size | 580.9 MB | 119.0 MB |
| Events in quadrant A | 3,247,084 | 838,907 |
| Events in quadrant B | 5,550,955 | 853,465 |
| Events in quadrant C | 3,736,363 | 853,366 |
| Events in quadrant D | 5,491,774 | 800,721 |
| Mode SS | |||
|---|---|---|---|
| Quadrant | BADHDUFLAG | Total packets | Discarded packets |
| A | 0 | 128 | 0 |
| B | 0 | 128 | 0 |
| C | 0 | 128 | 0 |
| D | 0 | 128 | 0 |
| Mode M9 | |||
|---|---|---|---|
| Quadrant | BADHDUFLAG | Total packets | Discarded packets |
| A | 0 | 15 | 0 |
| B | 0 | 15 | 0 |
| C | 0 | 15 | 0 |
| D | 0 | 16 | 0 |
| Mode M0 | |||
|---|---|---|---|
| Quadrant | BADHDUFLAG | Total packets | Discarded packets |
| A | 0 | 13700 | 3 |
| B | 0 | 20963 | 2 |
| C | 0 | 15238 | 2 |
| D | 0 | 20394 | 2 |
| Quadrant | Total seconds | Saturated seconds | Saturation percentage |
|---|---|---|---|
| A | 6209 | 59 | 0.950234% |
| B | 6209 | 208 | 3.349976% |
| C | 6209 | 234 | 3.768723% |
| D | 6209 | 347 | 5.588662% |
Noise dominated data is calculated using 1-second bins in cleaned event files. If a bin has >2000 counts, and if more than 50% of those come from <1% of pixels, then it is considered to be noise-dominated and hence unusable.
| Quadrant | # 1 sec bins | Bins with >0 counts | Bins with >2000 counts | High rate bins dominated by noise | Noise dominated (total time) | Noise dominated (detector-on time) | Marked lightcurve |
|---|---|---|---|---|---|---|---|
| A | 7529 | 6210 | 3 | 3 | 0.04% | 0.05% | 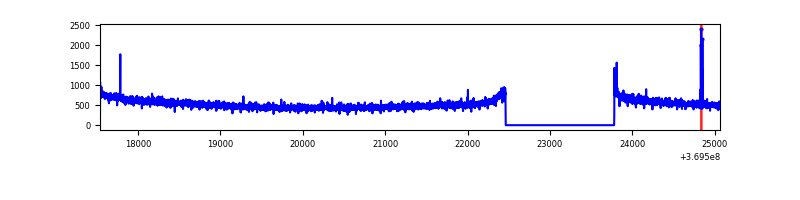 |
| B | 7529 | 6209 | 16 | 16 | 0.21% | 0.26% | 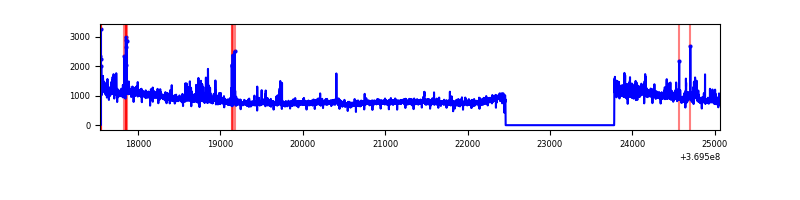 |
| C | 7529 | 6210 | 32 | 32 | 0.43% | 0.52% | 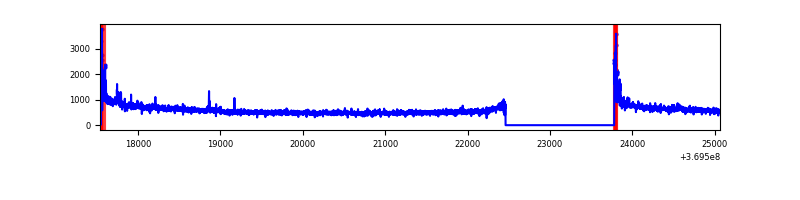 |
| D | 7529 | 6210 | 117 | 117 | 1.55% | 1.88% | 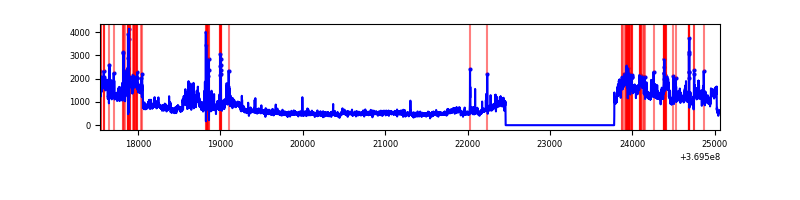 |
Top three noisy pixels from each quadrant. If the there are fewer than three noisy pixels in the level2.evt file, extra rows are filled as -1
| Pixel properties | Quadrant properties | ||||||
|---|---|---|---|---|---|---|---|
| Quadrant | DetID | PixID | Counts | Sigma | Mean | Median | Sigma |
| A | 13 | 6 | 24363 | 143.36 | 830 | 816 | 164.2 |
| A | 0 | 6 | 16463 | 95.27 | 830 | 816 | 164.2 |
| A | 13 | 254 | 12052 | 68.41 | 830 | 816 | 164.2 |
| B | 6 | 159 | 1890576 | 12383.13 | 831 | 811 | 152.6 |
| B | 0 | 190 | 215095 | 1404.15 | 831 | 811 | 152.6 |
| B | 5 | 172 | 70250 | 455.02 | 831 | 811 | 152.6 |
| C | 0 | 10 | 179827 | 961.06 | 816 | 822 | 186.3 |
| C | 14 | 238 | 136667 | 729.34 | 816 | 822 | 186.3 |
| C | 3 | 233 | 134097 | 715.54 | 816 | 822 | 186.3 |
| D | 8 | 195 | 2152735 | 11326.6 | 808 | 787 | 190.0 |
| D | 13 | 249 | 127188 | 665.3 | 808 | 787 | 190.0 |
| D | 12 | 233 | 31012 | 159.09 | 808 | 787 | 190.0 |
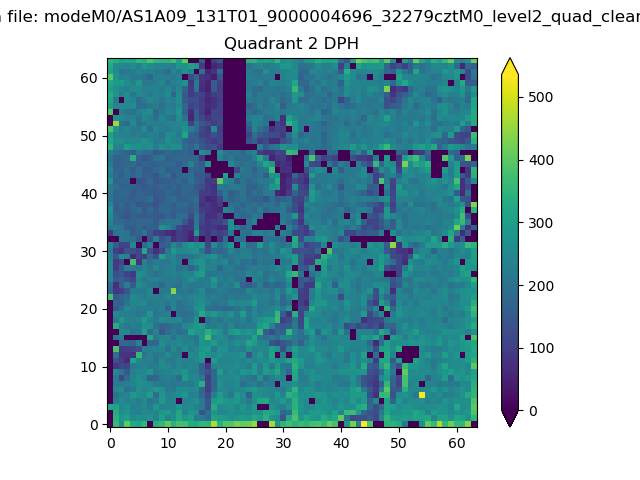
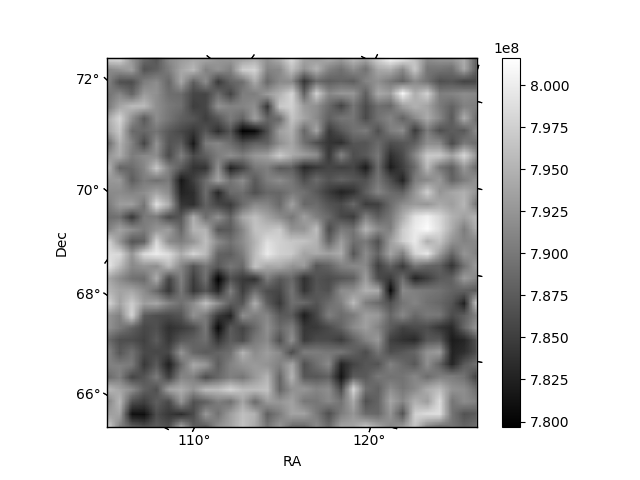
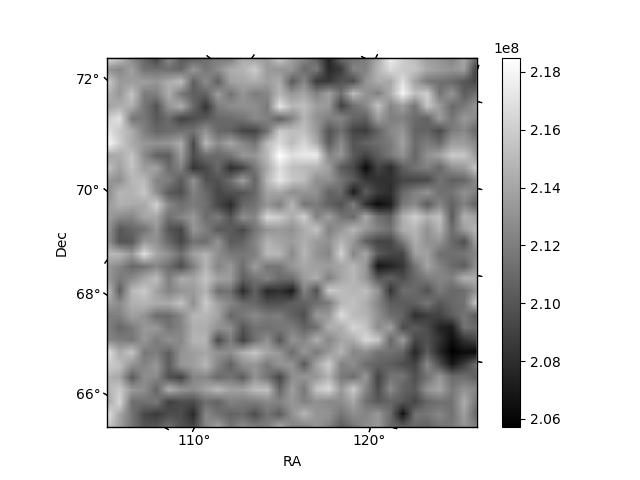
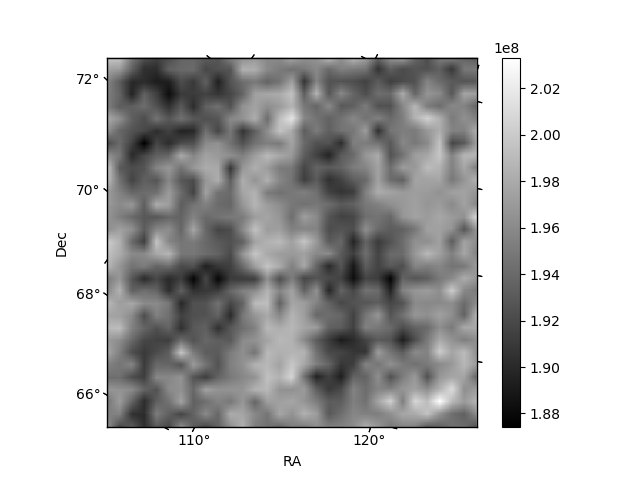
Histogram calculated using DETX and DETY for each event in the final _common_clean file
| Quadrant A | 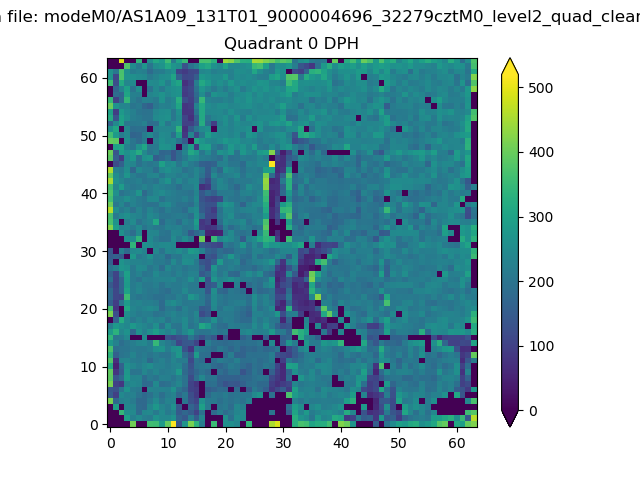 |
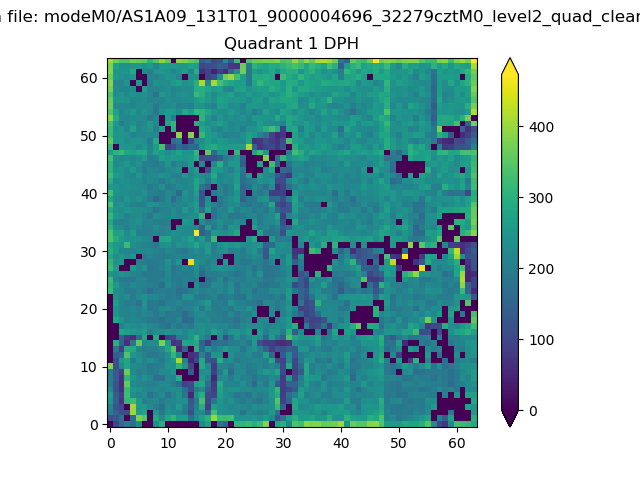 |
Quadrant B |
|---|---|---|---|
| Quadrant D | 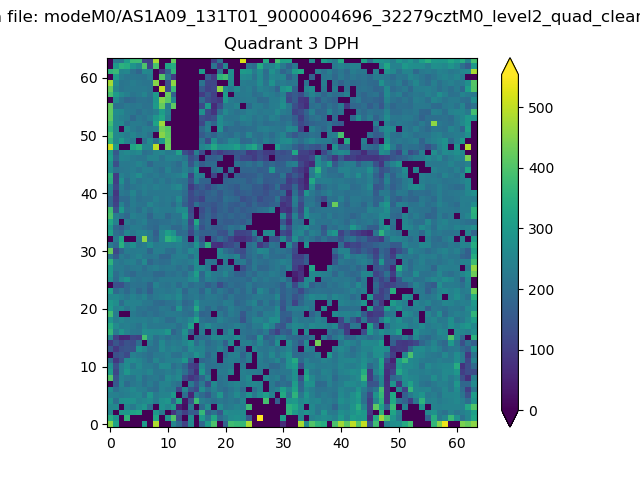 |
 |
Quadrant C |
| Plot type | Count rate plots | Images |
|---|---|---|
| Comparison with Poisson distribution Blue bars denote a histogram of data divided into 1 sec bins. Red curve is a Poisson curve with rate = median count rate of data. |
 |
 |
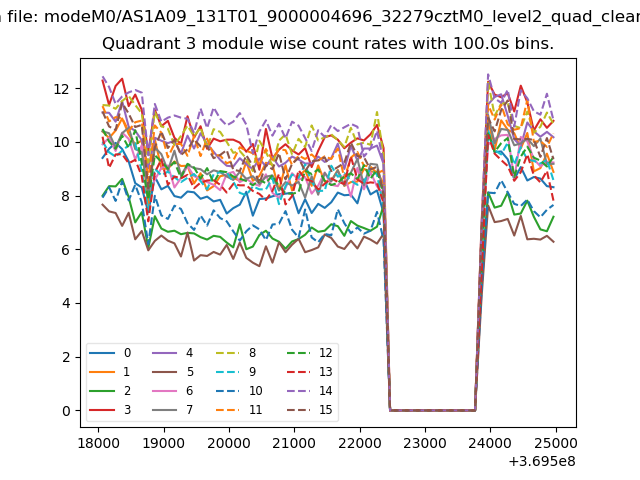
| Quadrant-wise count rates Data is divided into 100 sec bins |
 |
|
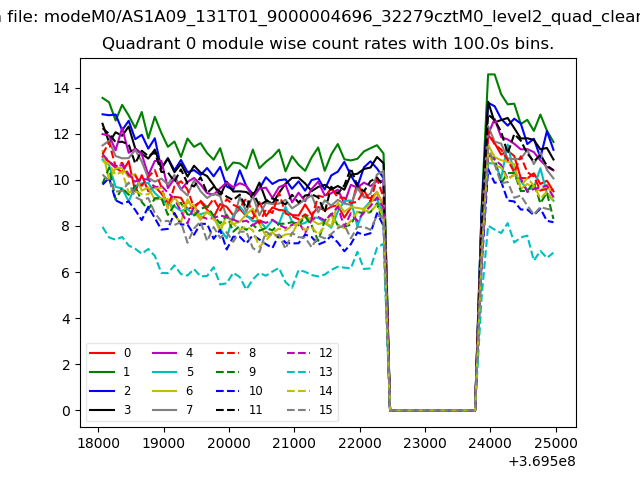
| Module-wise count rates for Quadrant A Data is divided into 100 sec bins |
 |
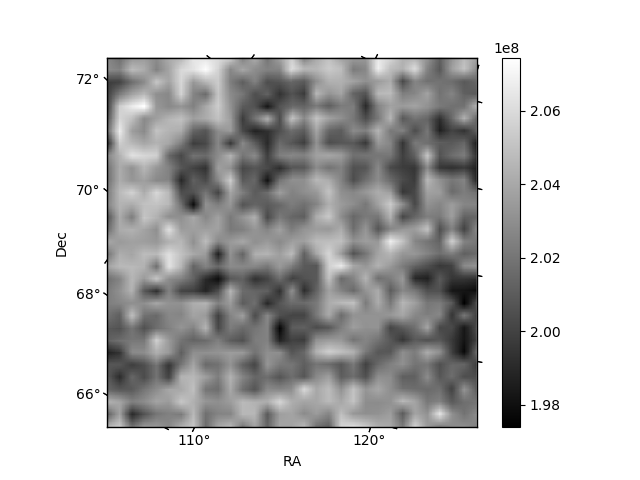 |
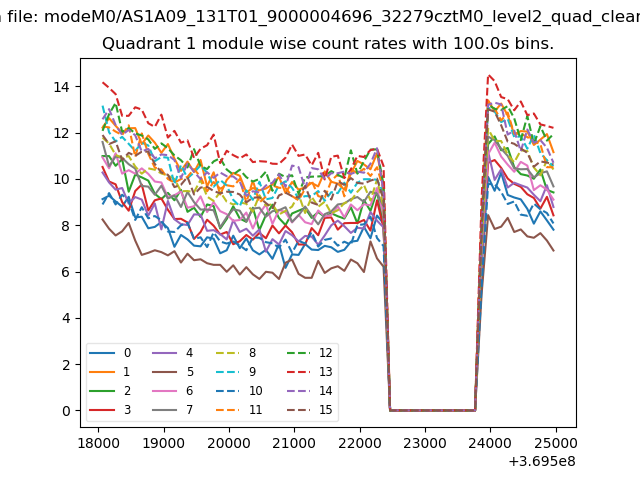
| Module-wise count rates for Quadrant B Data is divided into 100 sec bins |
 |
 |
| Module-wise count rates for Quadrant C Data is divided into 100 sec bins |
 |
 |
| Module-wise count rates for Quadrant D Data is divided into 100 sec bins |
 |
 |
| Parameter | Plot |
|---|---|
| CZT HV Monitor | 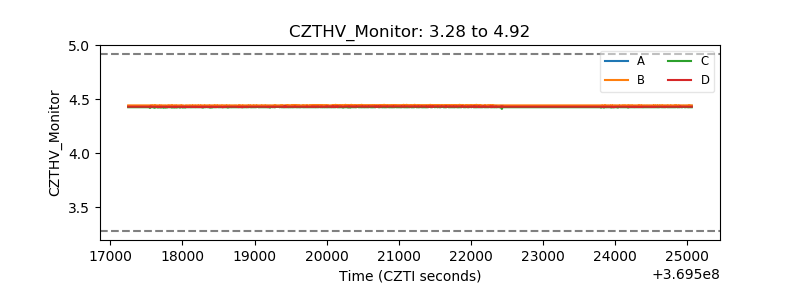 |
| D_VDD | 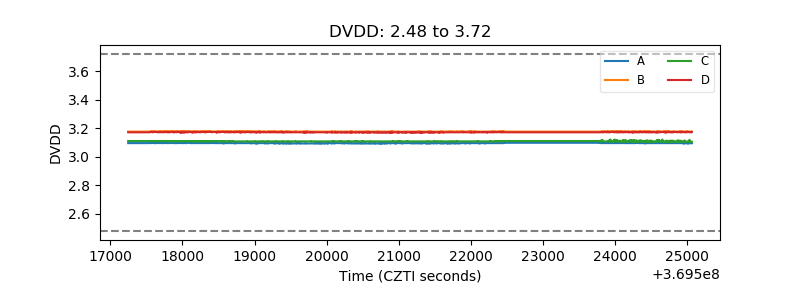 |
| Temperature 1 | 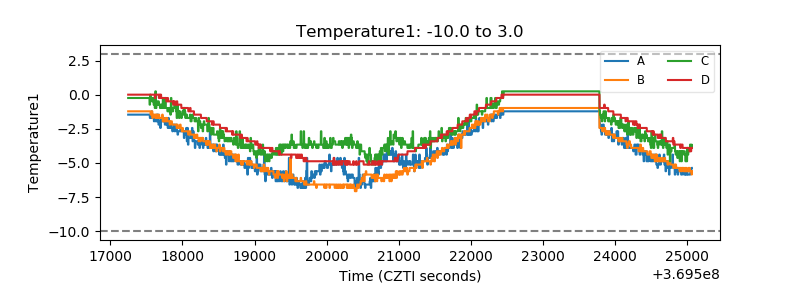 |
| Veto HV Monitor | 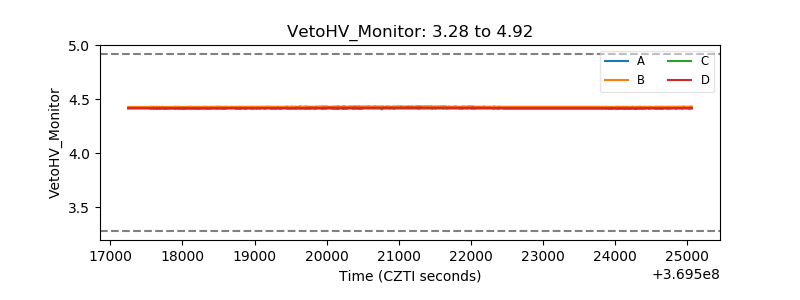 |
| Veto LLD | 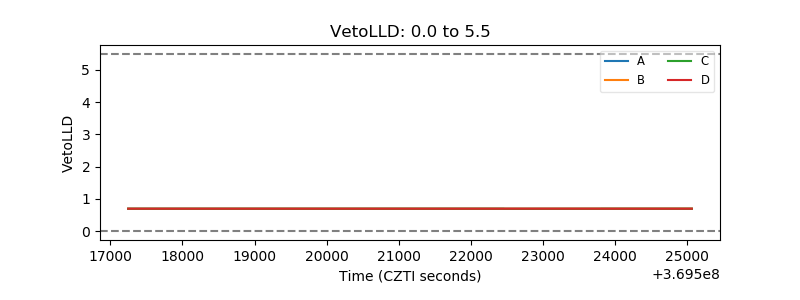 |
| Alpha Counter |  |
| _CPM_Rate | 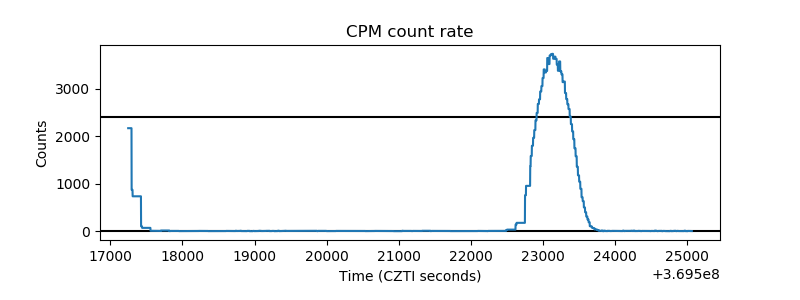 |
| CZT Counter | 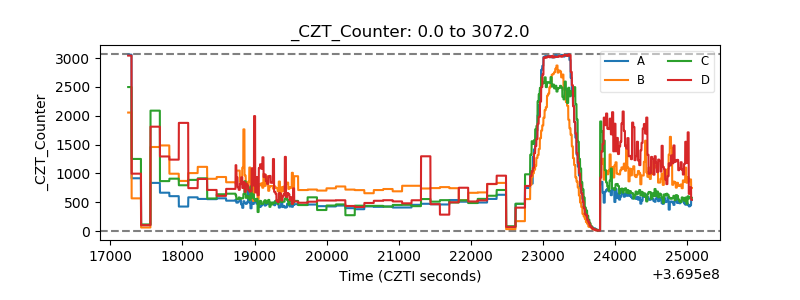 |
| +2.5 Volts monitor |  |
| +5 Volts monitor |  |
| _ROLL_ROT | 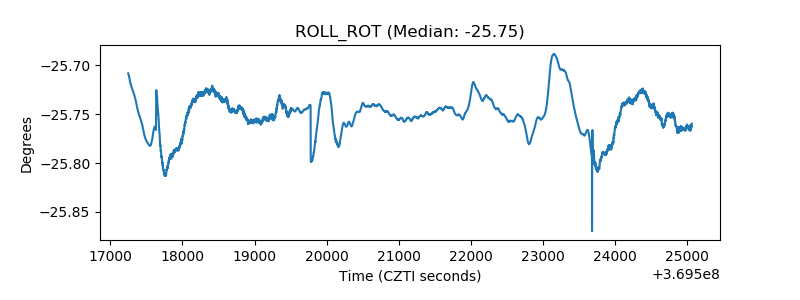 |
| _Roll_DEC | 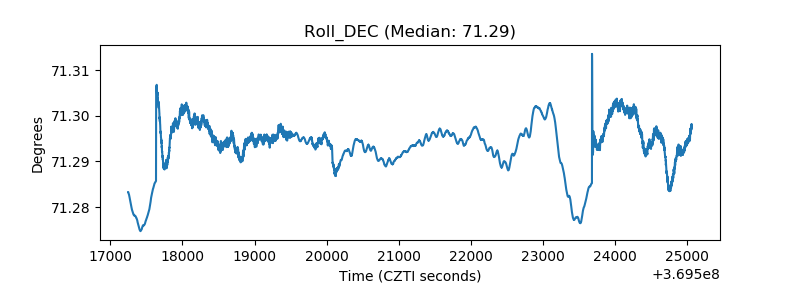 |
| _Roll_RA | 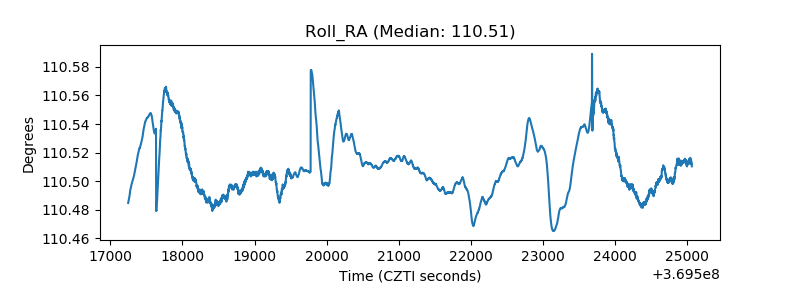 |
| Veto Counter | 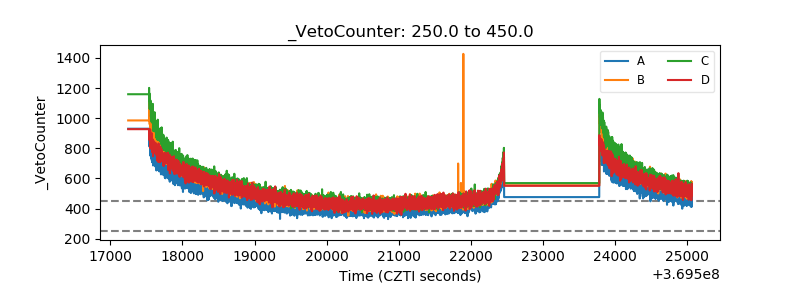 |