| Param | Original file | Final file |
|---|---|---|
| Filename | modeM0/AS1A09_131T01_9000004696_32280cztM0_level2.evt | modeM0/AS1A09_131T01_9000004696_32280cztM0_level2_quad_clean.evt |
| Size (bytes) | 607,849,920 | 132,986,880 |
| Size | 579.7 MB | 126.8 MB |
| Events in quadrant A | 3,161,224 | 909,852 |
| Events in quadrant B | 5,361,406 | 926,918 |
| Events in quadrant C | 3,711,274 | 915,069 |
| Events in quadrant D | 5,757,808 | 845,019 |
| Mode SS | |||
|---|---|---|---|
| Quadrant | BADHDUFLAG | Total packets | Discarded packets |
| A | 0 | 126 | 0 |
| B | 0 | 126 | 0 |
| C | 0 | 126 | 0 |
| D | 0 | 126 | 0 |
| Mode M9 | |||
|---|---|---|---|
| Quadrant | BADHDUFLAG | Total packets | Discarded packets |
| A | 0 | 22 | 0 |
| B | 0 | 22 | 0 |
| C | 0 | 22 | 0 |
| D | 0 | 23 | 0 |
| Mode M0 | |||
|---|---|---|---|
| Quadrant | BADHDUFLAG | Total packets | Discarded packets |
| A | 0 | 13341 | 3 |
| B | 0 | 20330 | 2 |
| C | 0 | 15082 | 2 |
| D | 0 | 21390 | 2 |
| Quadrant | Total seconds | Saturated seconds | Saturation percentage |
|---|---|---|---|
| A | 6172 | 57 | 0.923526% |
| B | 6172 | 226 | 3.661698% |
| C | 6172 | 284 | 4.601426% |
| D | 6172 | 481 | 7.793260% |
Noise dominated data is calculated using 1-second bins in cleaned event files. If a bin has >2000 counts, and if more than 50% of those come from <1% of pixels, then it is considered to be noise-dominated and hence unusable.
| Quadrant | # 1 sec bins | Bins with >0 counts | Bins with >2000 counts | High rate bins dominated by noise | Noise dominated (total time) | Noise dominated (detector-on time) | Marked lightcurve |
|---|---|---|---|---|---|---|---|
| A | 7502 | 6173 | 3 | 3 | 0.04% | 0.05% | 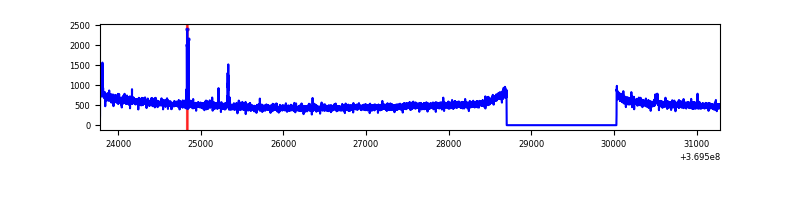 |
| B | 7502 | 6173 | 26 | 26 | 0.35% | 0.42% | 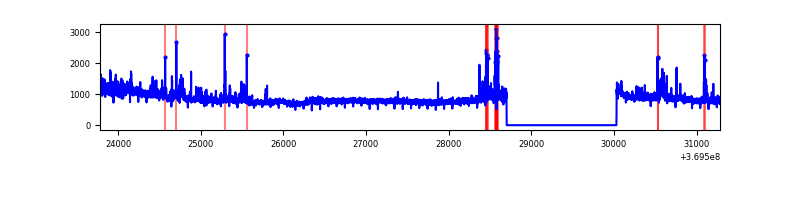 |
| C | 7502 | 6173 | 45 | 45 | 0.60% | 0.73% | 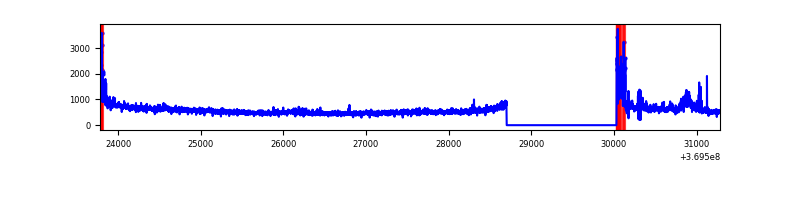 |
| D | 7502 | 6173 | 256 | 256 | 3.41% | 4.15% | 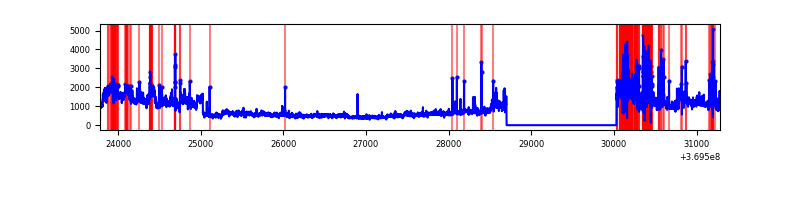 |
Top three noisy pixels from each quadrant. If the there are fewer than three noisy pixels in the level2.evt file, extra rows are filled as -1
| Pixel properties | Quadrant properties | ||||||
|---|---|---|---|---|---|---|---|
| Quadrant | DetID | PixID | Counts | Sigma | Mean | Median | Sigma |
| A | 13 | 6 | 32545 | 201.52 | 801 | 789 | 157.6 |
| A | 0 | 6 | 30363 | 187.67 | 801 | 789 | 157.6 |
| A | 13 | 254 | 12554 | 74.66 | 801 | 789 | 157.6 |
| B | 6 | 159 | 1804736 | 12228.71 | 803 | 785 | 147.5 |
| B | 0 | 190 | 194708 | 1314.57 | 803 | 785 | 147.5 |
| B | 5 | 172 | 73947 | 495.95 | 803 | 785 | 147.5 |
| C | 0 | 10 | 193085 | 1070.12 | 785 | 792 | 179.7 |
| C | 3 | 233 | 171608 | 950.6 | 785 | 792 | 179.7 |
| C | 14 | 238 | 146544 | 811.11 | 785 | 792 | 179.7 |
| D | 8 | 195 | 2182402 | 12017.35 | 767 | 746 | 181.5 |
| D | 13 | 249 | 453156 | 2492.04 | 767 | 746 | 181.5 |
| D | 7 | 38 | 91083 | 497.61 | 767 | 746 | 181.5 |
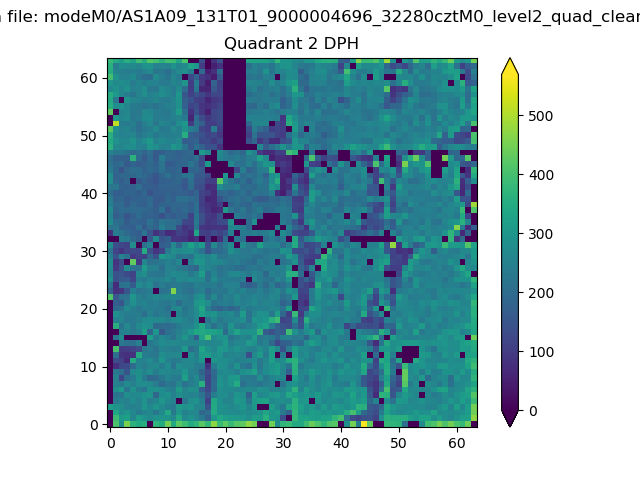
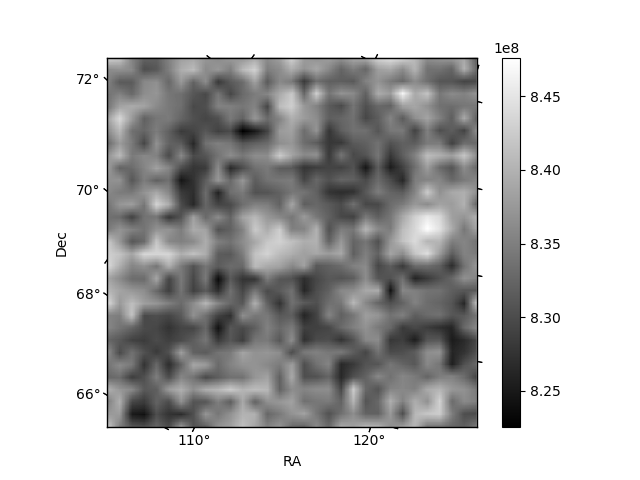
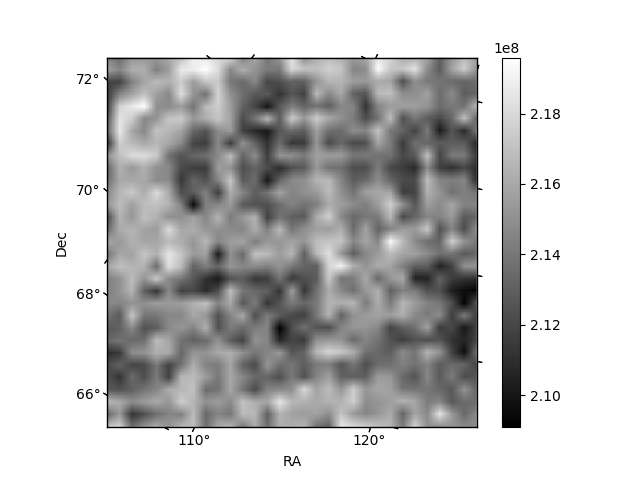
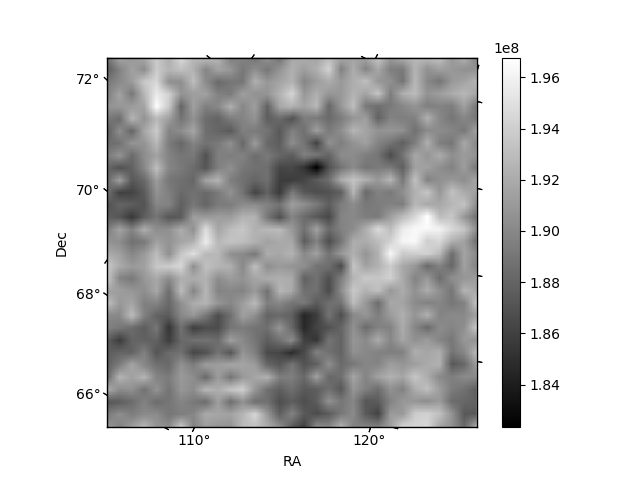
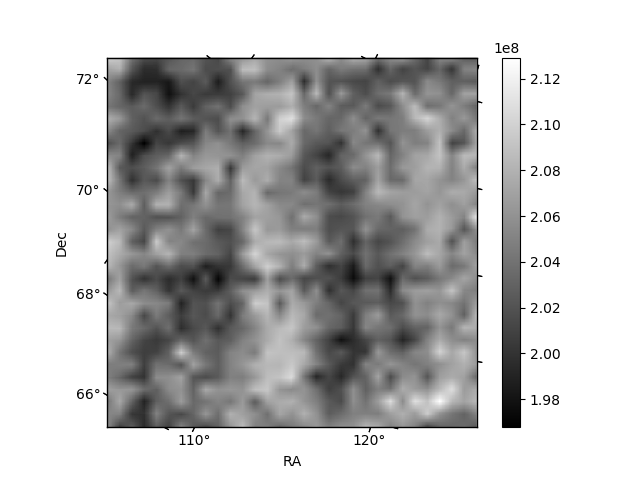
Histogram calculated using DETX and DETY for each event in the final _common_clean file
| Quadrant A | 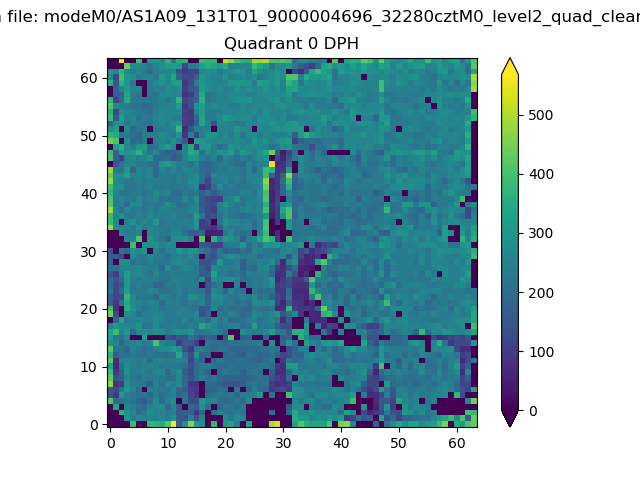 |
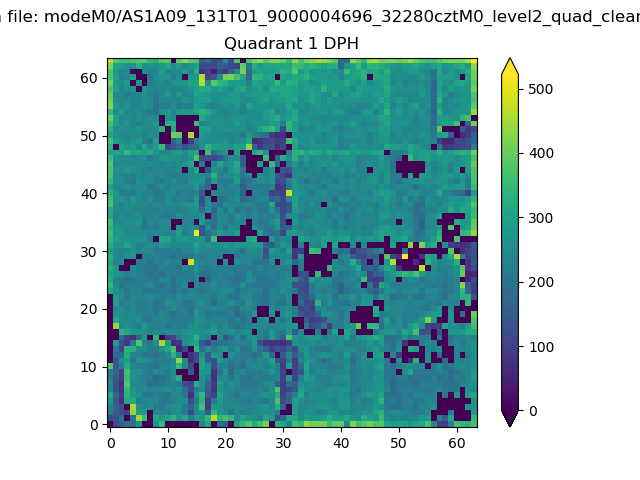 |
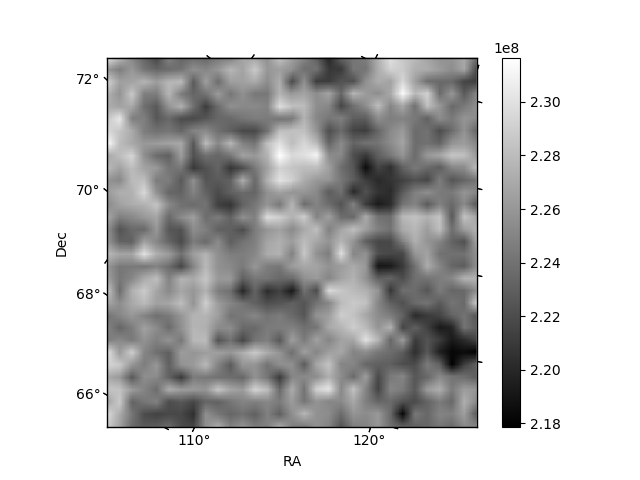
Quadrant B |
|---|---|---|---|
| Quadrant D | 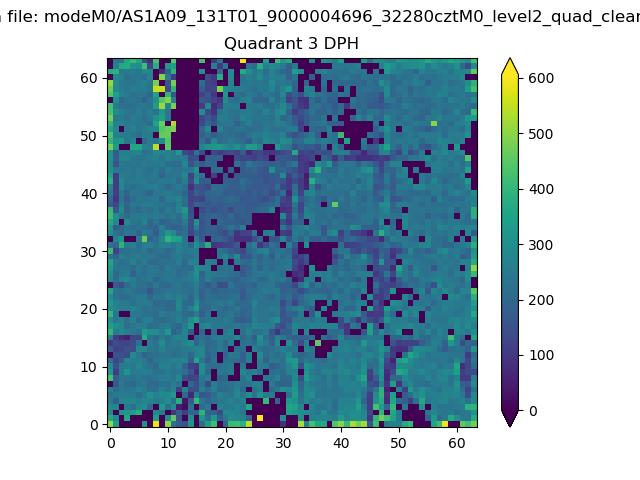 |
 |
Quadrant C |
| Plot type | Count rate plots | Images |
|---|---|---|
| Comparison with Poisson distribution Blue bars denote a histogram of data divided into 1 sec bins. Red curve is a Poisson curve with rate = median count rate of data. |
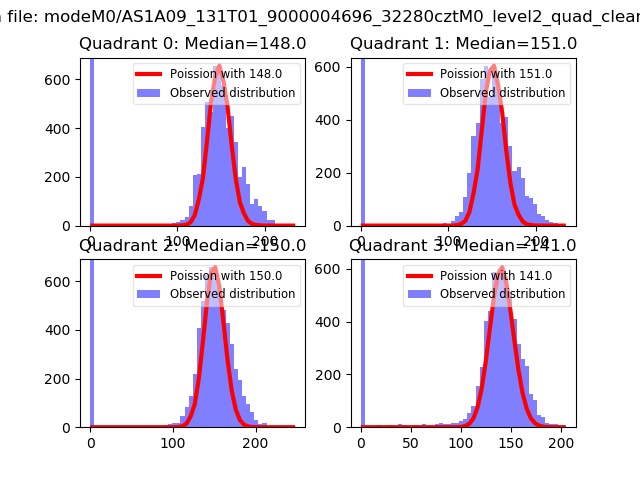 |
 |
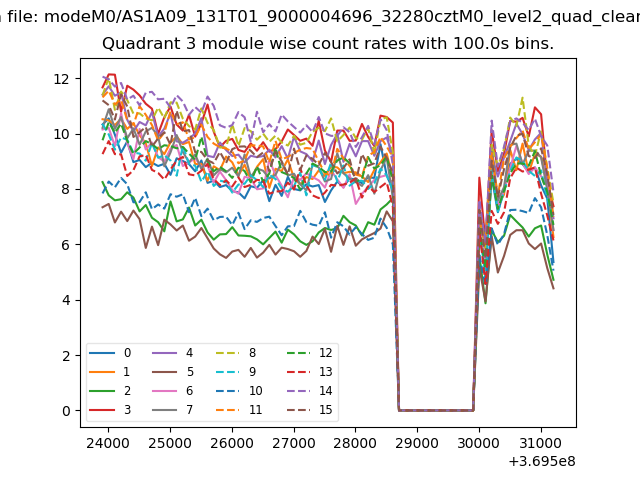
| Quadrant-wise count rates Data is divided into 100 sec bins |
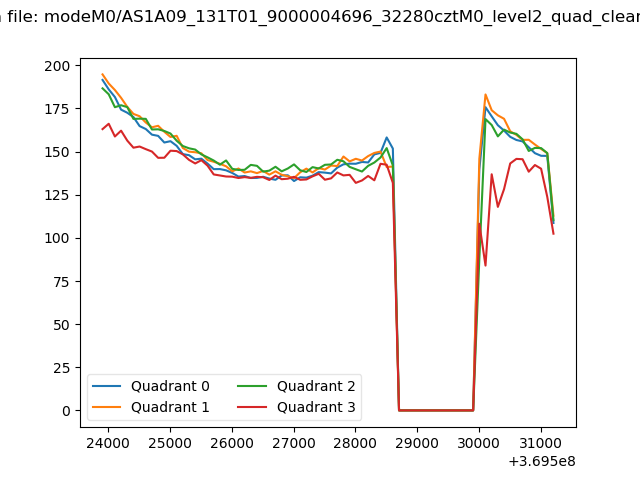 |
|
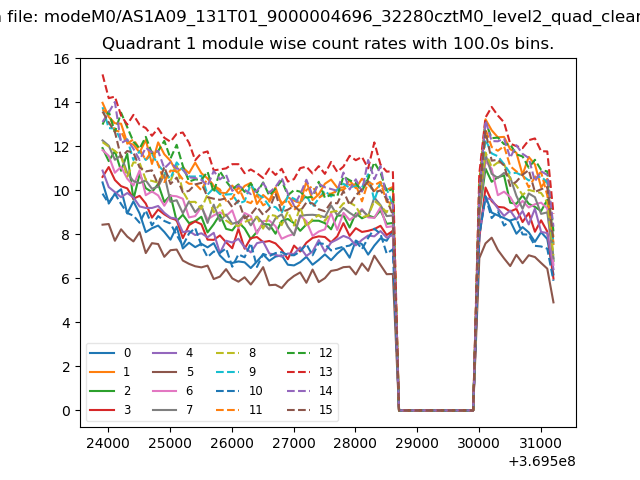
| Module-wise count rates for Quadrant A Data is divided into 100 sec bins |
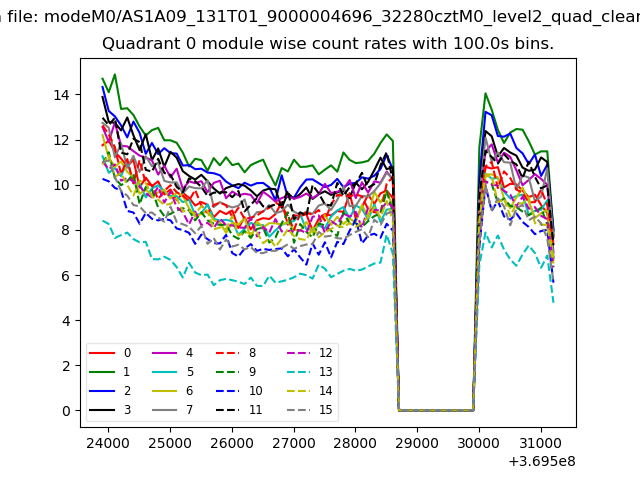 |
 |
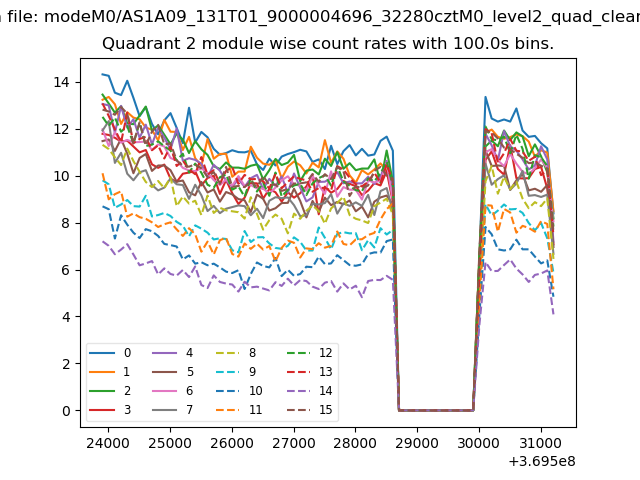
| Module-wise count rates for Quadrant B Data is divided into 100 sec bins |
 |
 |
| Module-wise count rates for Quadrant C Data is divided into 100 sec bins |
 |
 |
| Module-wise count rates for Quadrant D Data is divided into 100 sec bins |
 |
 |
| Parameter | Plot |
|---|---|
| CZT HV Monitor | 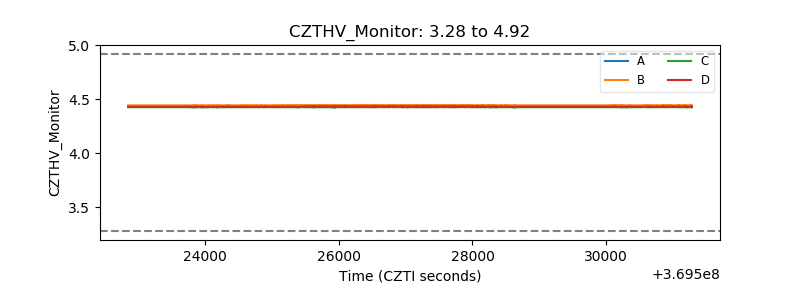 |
| D_VDD | 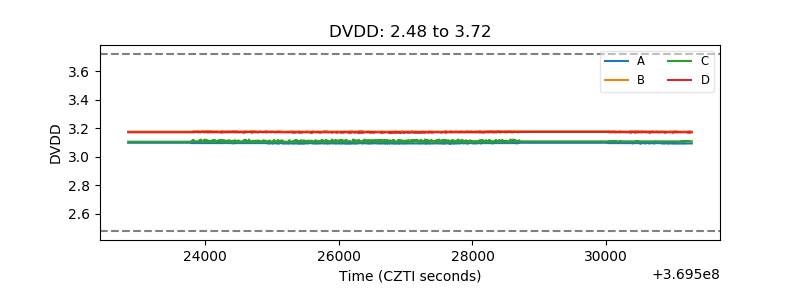 |
| Temperature 1 | 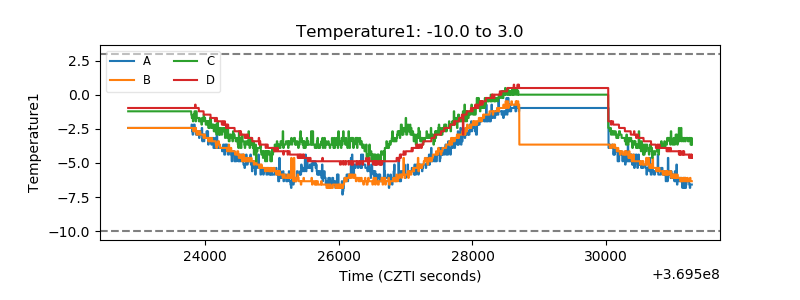 |
| Veto HV Monitor | 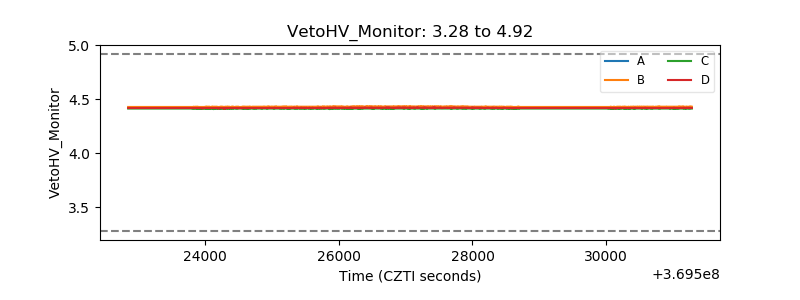 |
| Veto LLD | 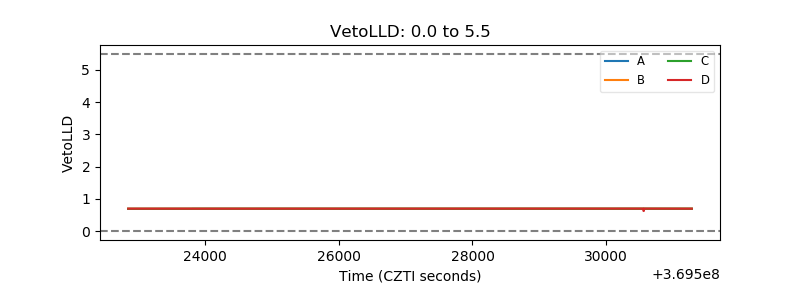 |
| Alpha Counter | 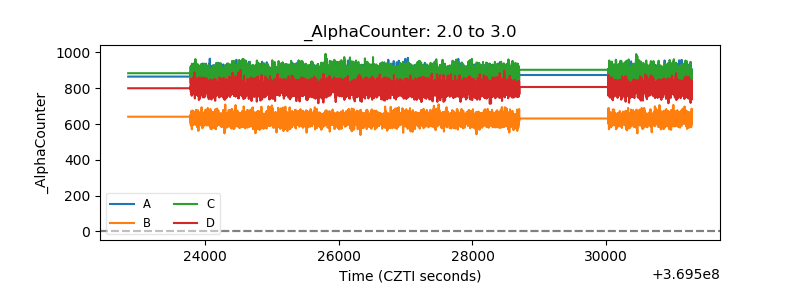 |
| _CPM_Rate |  |
| CZT Counter | 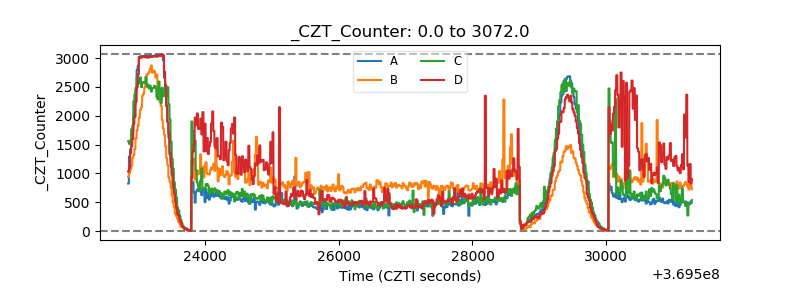 |
| +2.5 Volts monitor |  |
| +5 Volts monitor | 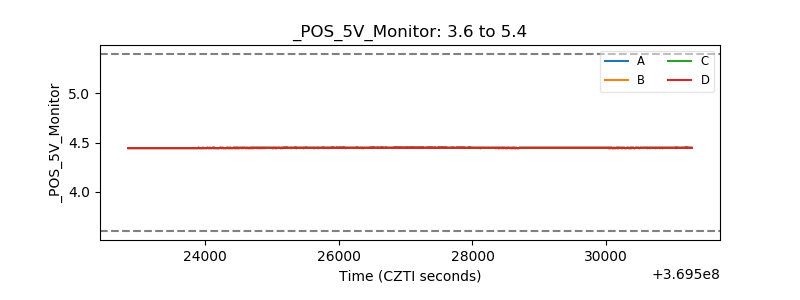 |
| _ROLL_ROT | 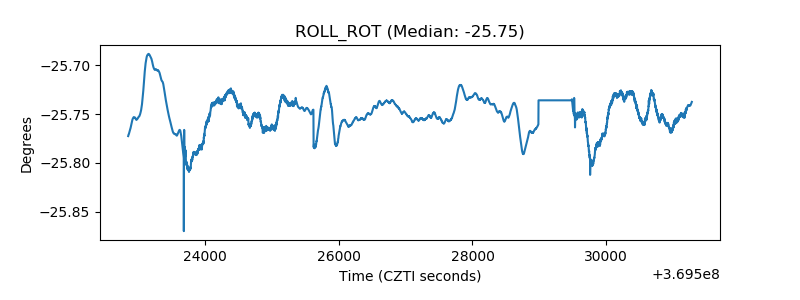 |
| _Roll_DEC | 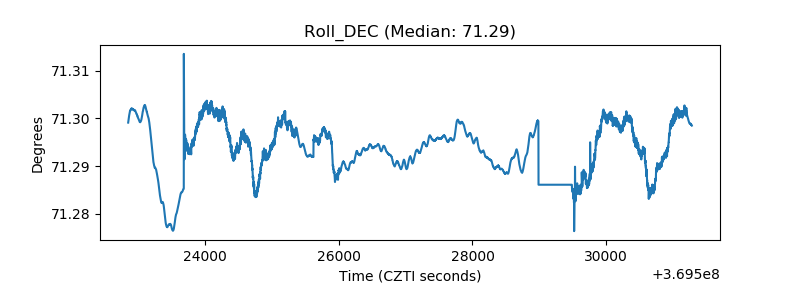 |
| _Roll_RA | 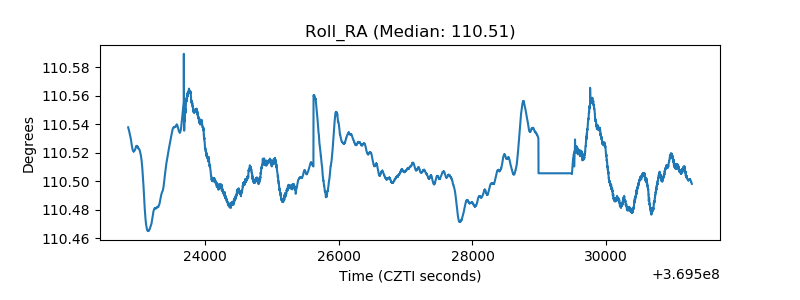 |
| Veto Counter | 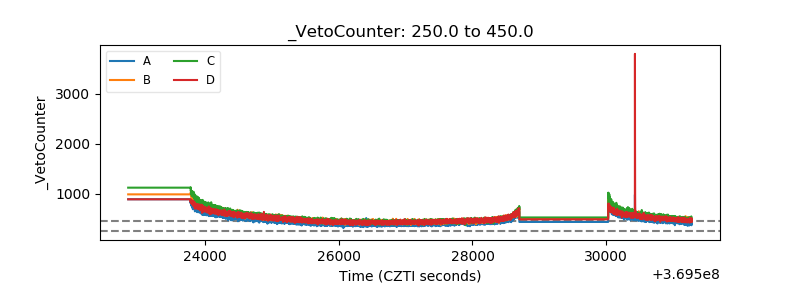 |