| Param | Original file | Final file |
|---|---|---|
| Filename | modeM0/AS1A09_131T01_9000004696_32284cztM0_level2.evt | modeM0/AS1A09_131T01_9000004696_32284cztM0_level2_quad_clean.evt |
| Size (bytes) | 571,461,120 | 115,024,320 |
| Size | 545.0 MB | 109.7 MB |
| Events in quadrant A | 3,206,983 | 757,537 |
| Events in quadrant B | 5,374,004 | 761,899 |
| Events in quadrant C | 3,578,646 | 750,697 |
| Events in quadrant D | 4,675,154 | 727,999 |
| Mode SS | |||
|---|---|---|---|
| Quadrant | BADHDUFLAG | Total packets | Discarded packets |
| A | 0 | 144 | 0 |
| B | 0 | 144 | 0 |
| C | 0 | 144 | 0 |
| D | 0 | 144 | 0 |
| Mode M9 | |||
|---|---|---|---|
| Quadrant | BADHDUFLAG | Total packets | Discarded packets |
| A | 0 | 1 | 0 |
| B | 0 | 1 | 0 |
| C | 0 | 1 | 0 |
| D | 0 | 1 | 0 |
| Mode M0 | |||
|---|---|---|---|
| Quadrant | BADHDUFLAG | Total packets | Discarded packets |
| A | 0 | 14299 | 3 |
| B | 0 | 21242 | 2 |
| C | 0 | 15123 | 2 |
| D | 0 | 18879 | 2 |
| Quadrant | Total seconds | Saturated seconds | Saturation percentage |
|---|---|---|---|
| A | 6958 | 110 | 1.580914% |
| B | 6958 | 200 | 2.874389% |
| C | 6958 | 234 | 3.363035% |
| D | 6958 | 182 | 2.615694% |
Noise dominated data is calculated using 1-second bins in cleaned event files. If a bin has >2000 counts, and if more than 50% of those come from <1% of pixels, then it is considered to be noise-dominated and hence unusable.
| Quadrant | # 1 sec bins | Bins with >0 counts | Bins with >2000 counts | High rate bins dominated by noise | Noise dominated (total time) | Noise dominated (detector-on time) | Marked lightcurve |
|---|---|---|---|---|---|---|---|
| A | 7123 | 6961 | 0 | 0 | 0.00% | 0.00% | 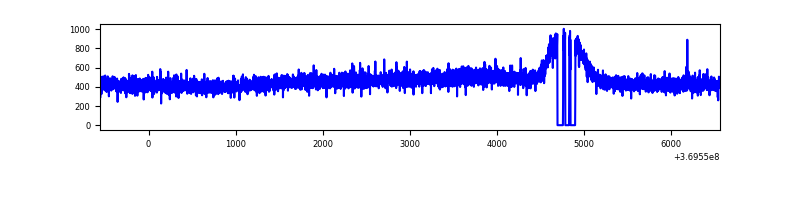 |
| B | 7123 | 6961 | 8 | 8 | 0.11% | 0.11% | 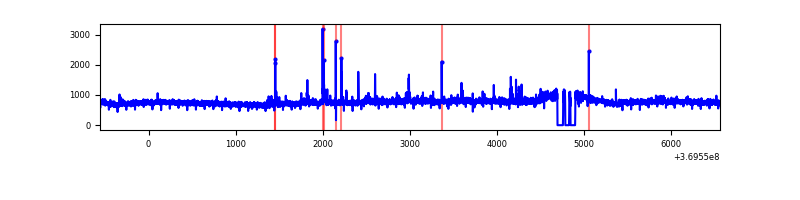 |
| C | 7123 | 6961 | 0 | 0 | 0.00% | 0.00% | 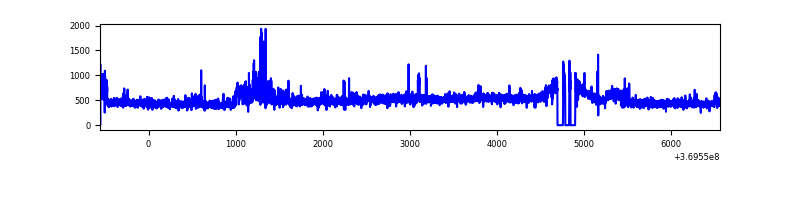 |
| D | 7123 | 6961 | 48 | 48 | 0.67% | 0.69% | 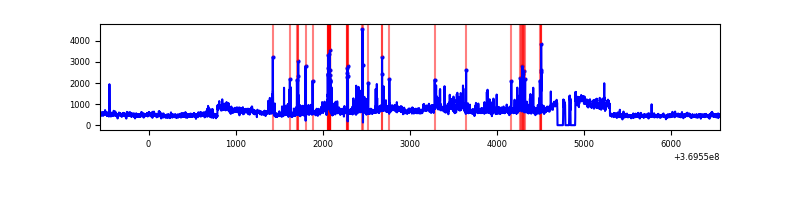 |
Top three noisy pixels from each quadrant. If the there are fewer than three noisy pixels in the level2.evt file, extra rows are filled as -1
| Pixel properties | Quadrant properties | ||||||
|---|---|---|---|---|---|---|---|
| Quadrant | DetID | PixID | Counts | Sigma | Mean | Median | Sigma |
| A | 13 | 254 | 13047 | 73.34 | 828 | 809 | 166.9 |
| A | 3 | 137 | 8625 | 46.84 | 828 | 809 | 166.9 |
| A | 0 | 226 | 7050 | 37.4 | 828 | 809 | 166.9 |
| B | 6 | 159 | 1992041 | 12698.24 | 819 | 798 | 156.8 |
| B | 0 | 229 | 33633 | 209.39 | 819 | 798 | 156.8 |
| B | 3 | 209 | 31434 | 195.37 | 819 | 798 | 156.8 |
| C | 14 | 238 | 167671 | 909.63 | 793 | 796 | 183.5 |
| C | 0 | 10 | 126161 | 683.36 | 793 | 796 | 183.5 |
| C | 14 | 254 | 55101 | 296.02 | 793 | 796 | 183.5 |
| D | 8 | 195 | 1194729 | 6269.61 | 801 | 779 | 190.4 |
| D | 14 | 52 | 107514 | 560.48 | 801 | 779 | 190.4 |
| D | 13 | 249 | 105990 | 552.48 | 801 | 779 | 190.4 |
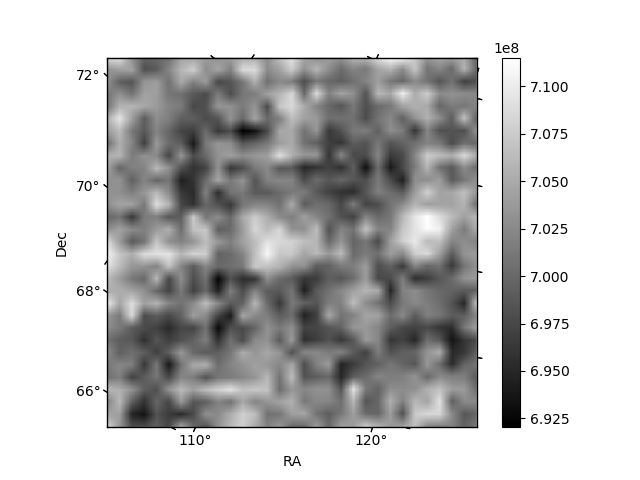
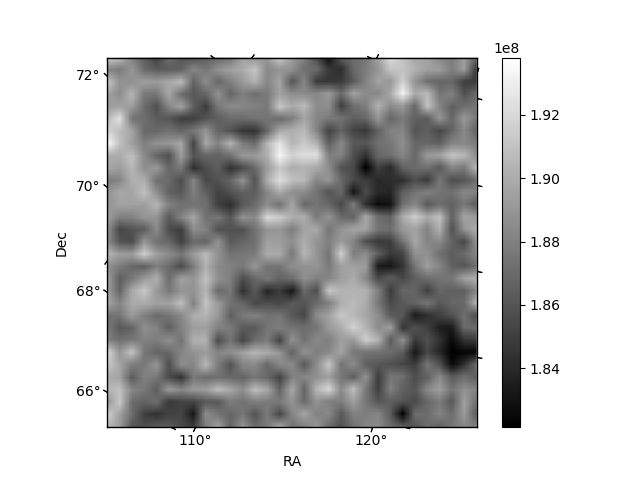
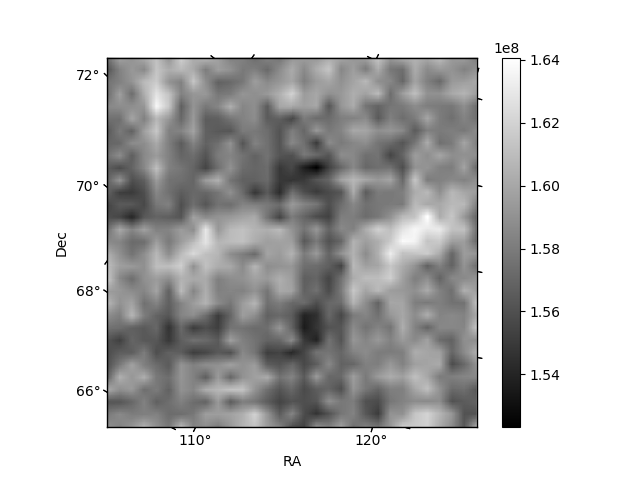
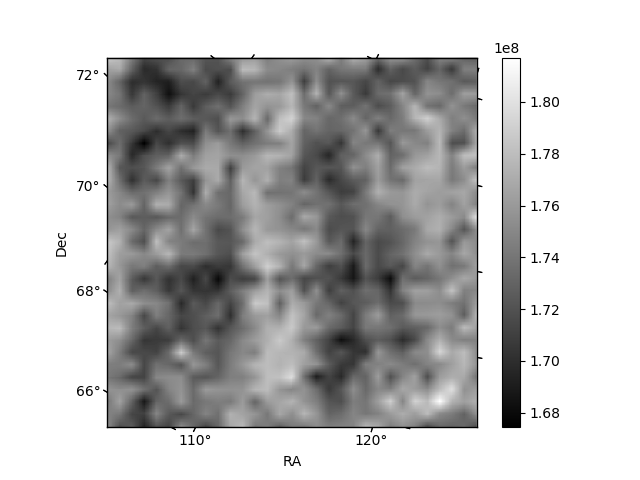
Histogram calculated using DETX and DETY for each event in the final _common_clean file
| Quadrant A | 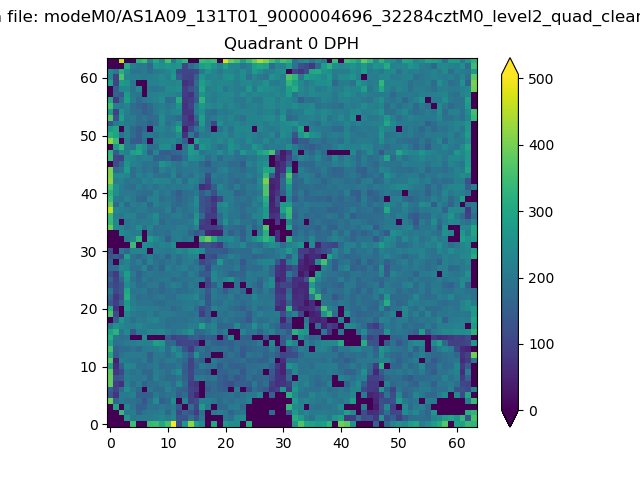 |
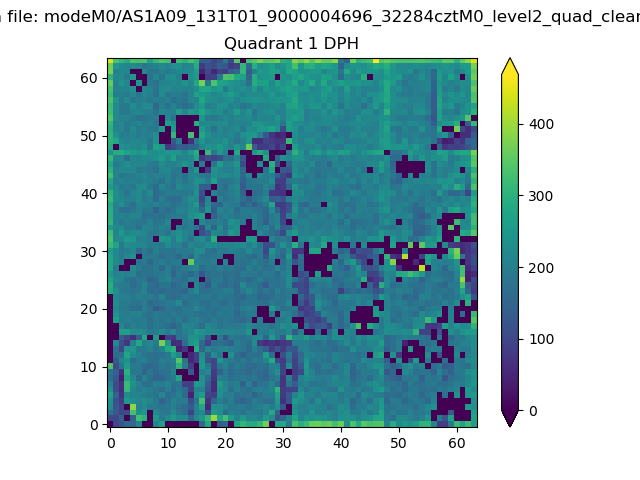 |
Quadrant B |
|---|---|---|---|
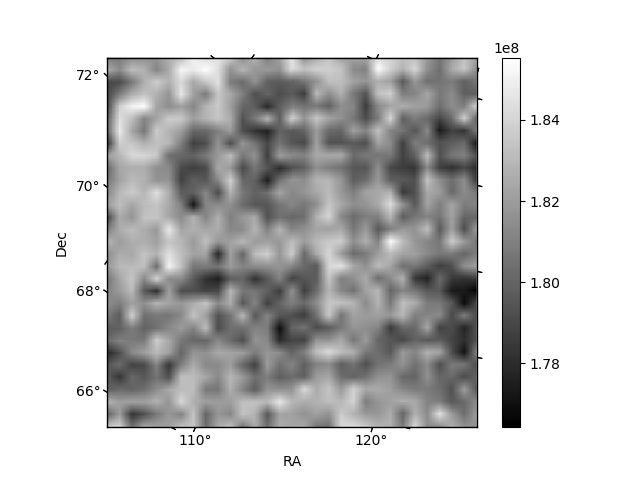
| Quadrant D | 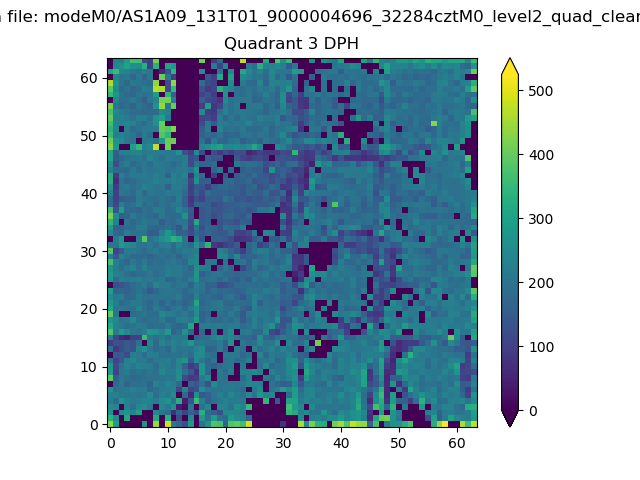 |
 |
Quadrant C |
| Plot type | Count rate plots | Images |
|---|---|---|
| Comparison with Poisson distribution Blue bars denote a histogram of data divided into 1 sec bins. Red curve is a Poisson curve with rate = median count rate of data. |
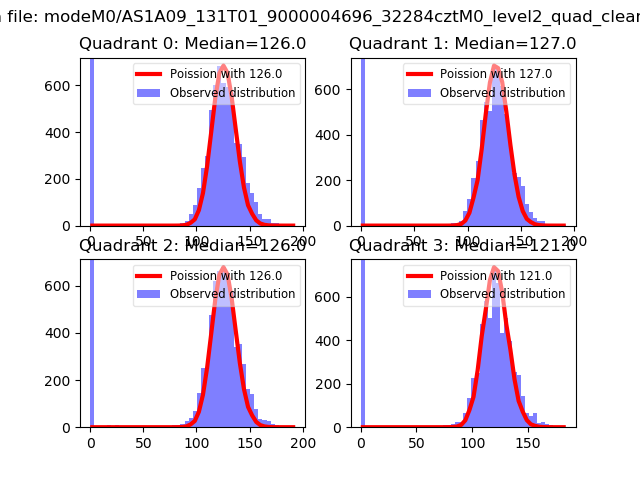 |
 |
| Quadrant-wise count rates Data is divided into 100 sec bins |
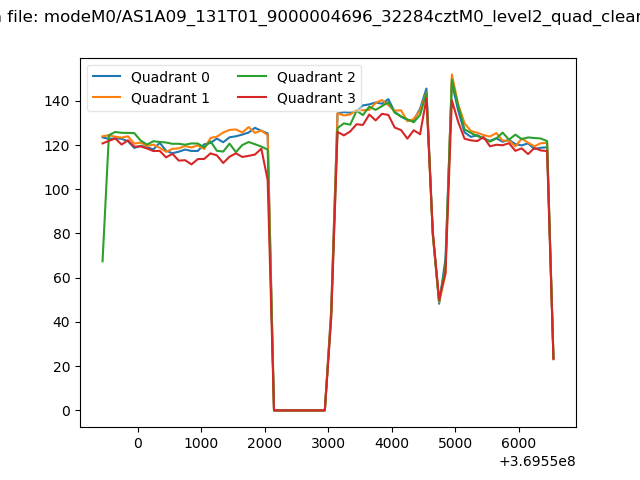 |
|
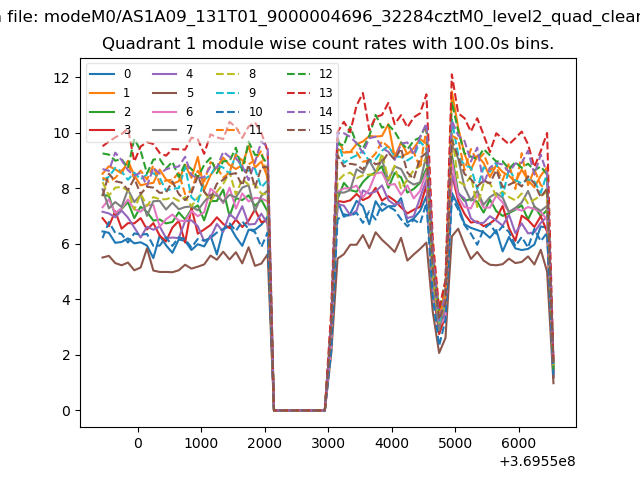
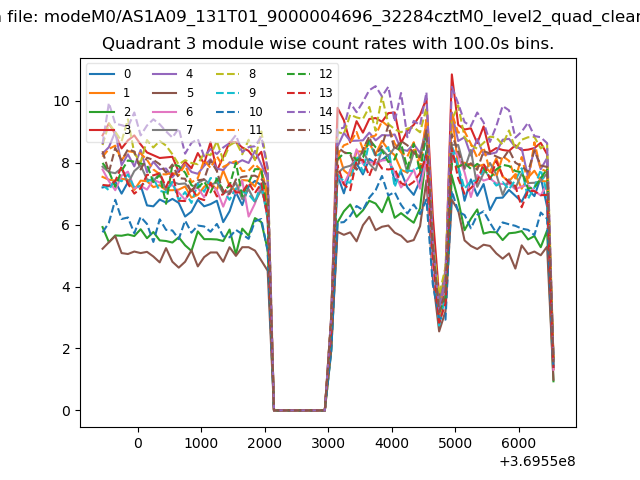
| Module-wise count rates for Quadrant A Data is divided into 100 sec bins |
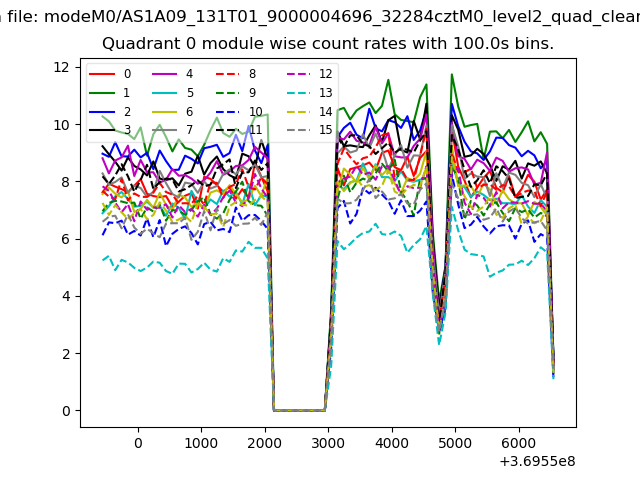 |
 |
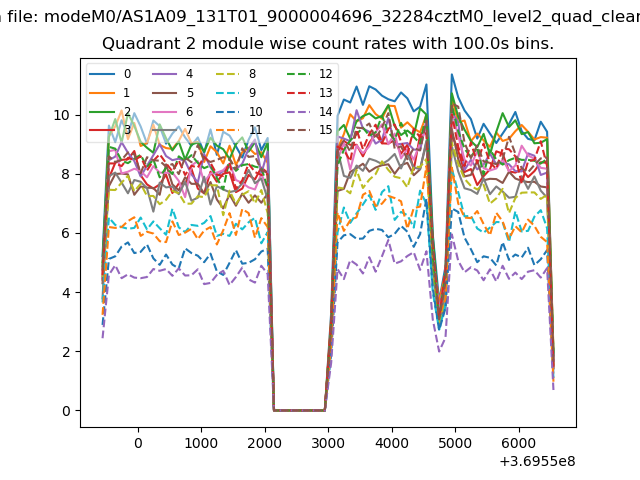
| Module-wise count rates for Quadrant B Data is divided into 100 sec bins |
 |
 |
| Module-wise count rates for Quadrant C Data is divided into 100 sec bins |
 |
 |
| Module-wise count rates for Quadrant D Data is divided into 100 sec bins |
 |
 |
| Parameter | Plot |
|---|---|
| CZT HV Monitor | 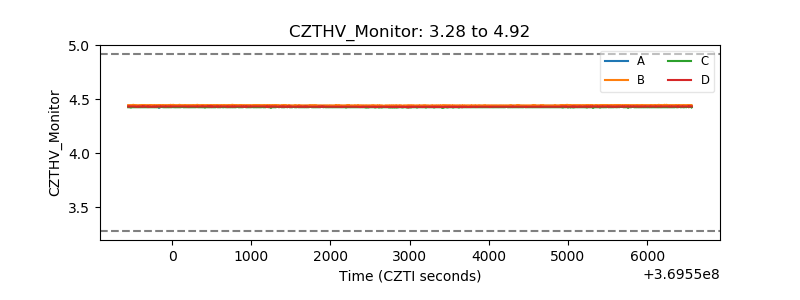 |
| D_VDD | 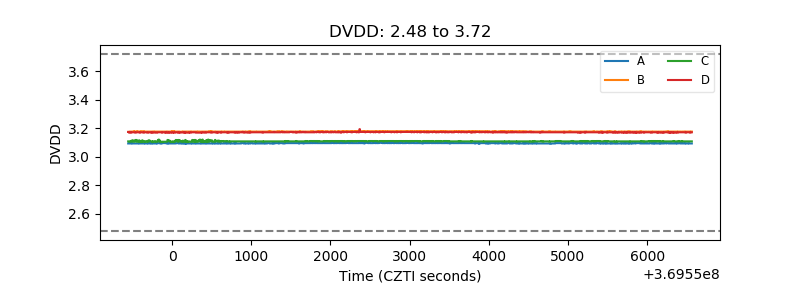 |
| Temperature 1 |  |
| Veto HV Monitor |  |
| Veto LLD | 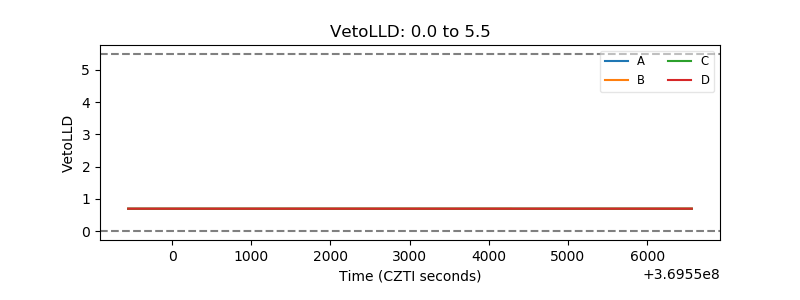 |
| Alpha Counter | 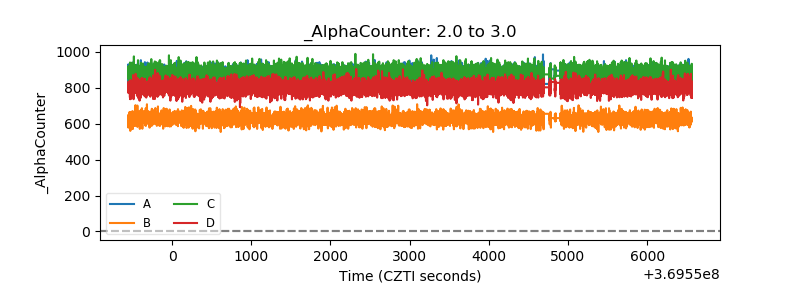 |
| _CPM_Rate | 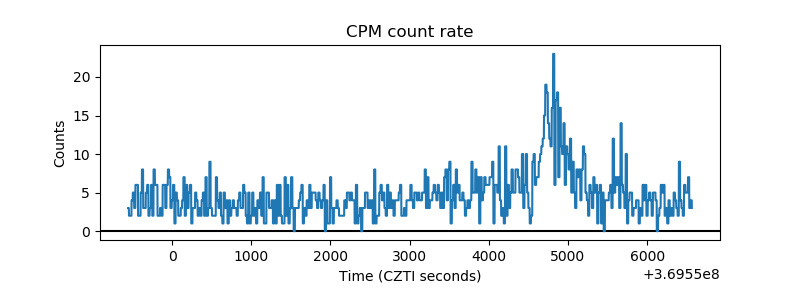 |
| CZT Counter |  |
| +2.5 Volts monitor |  |
| +5 Volts monitor |  |
| _ROLL_ROT | 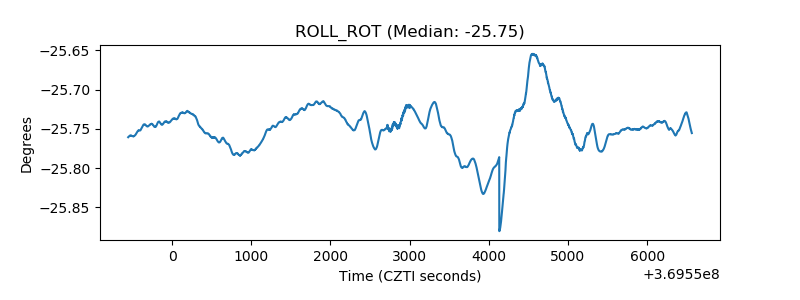 |
| _Roll_DEC | 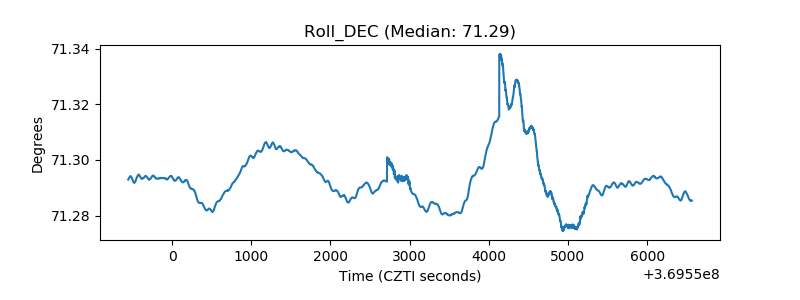 |
| _Roll_RA | 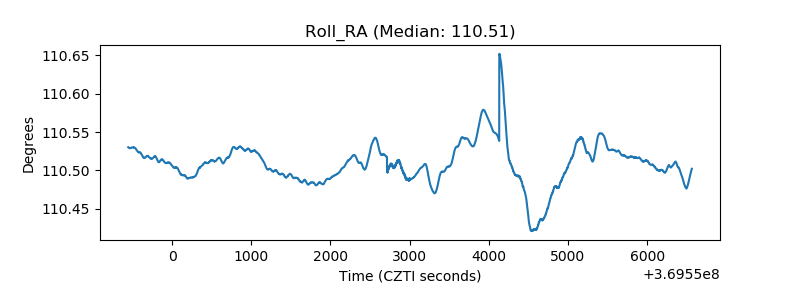 |
| Veto Counter | 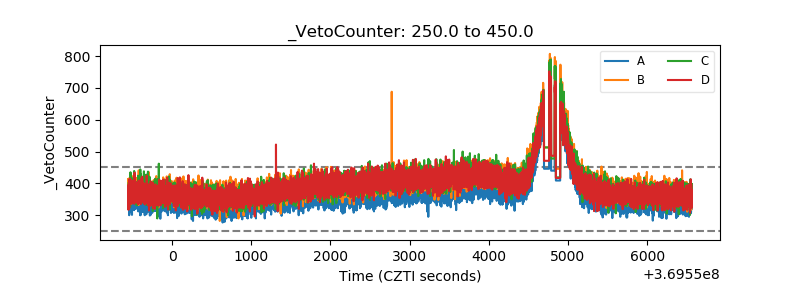 |