| Param | Original file | Final file |
|---|---|---|
| Filename | modeM0/AS1A09_131T01_9000004696_32285cztM0_level2.evt | modeM0/AS1A09_131T01_9000004696_32285cztM0_level2_quad_clean.evt |
| Size (bytes) | 550,281,600 | 111,539,520 |
| Size | 524.8 MB | 106.4 MB |
| Events in quadrant A | 3,113,673 | 731,731 |
| Events in quadrant B | 5,376,188 | 735,441 |
| Events in quadrant C | 3,348,439 | 732,872 |
| Events in quadrant D | 4,366,987 | 705,015 |
| Mode SS | |||
|---|---|---|---|
| Quadrant | BADHDUFLAG | Total packets | Discarded packets |
| A | 0 | 138 | 0 |
| B | 0 | 138 | 0 |
| C | 0 | 138 | 0 |
| D | 0 | 138 | 0 |
| Mode M9 | |||
|---|---|---|---|
| Quadrant | BADHDUFLAG | Total packets | Discarded packets |
| A | 0 | 3 | 0 |
| B | 0 | 3 | 0 |
| C | 0 | 3 | 0 |
| D | 0 | 3 | 0 |
| Mode M0 | |||
|---|---|---|---|
| Quadrant | BADHDUFLAG | Total packets | Discarded packets |
| A | 0 | 13845 | 2 |
| B | 0 | 21140 | 1 |
| C | 0 | 14388 | 1 |
| D | 0 | 17722 | 1 |
| Quadrant | Total seconds | Saturated seconds | Saturation percentage |
|---|---|---|---|
| A | 6787 | 80 | 1.178724% |
| B | 6787 | 164 | 2.416384% |
| C | 6787 | 126 | 1.856490% |
| D | 6787 | 153 | 2.254310% |
Noise dominated data is calculated using 1-second bins in cleaned event files. If a bin has >2000 counts, and if more than 50% of those come from <1% of pixels, then it is considered to be noise-dominated and hence unusable.
| Quadrant | # 1 sec bins | Bins with >0 counts | Bins with >2000 counts | High rate bins dominated by noise | Noise dominated (total time) | Noise dominated (detector-on time) | Marked lightcurve |
|---|---|---|---|---|---|---|---|
| A | 7067 | 6788 | 0 | 0 | 0.00% | 0.00% | 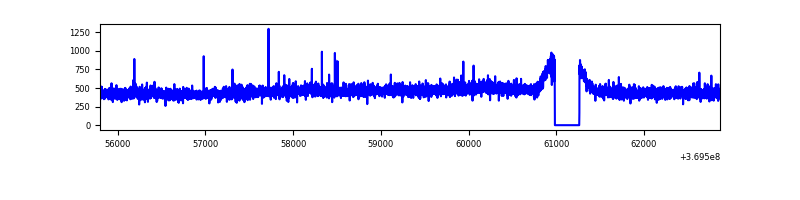 |
| B | 7067 | 6788 | 8 | 8 | 0.11% | 0.12% | 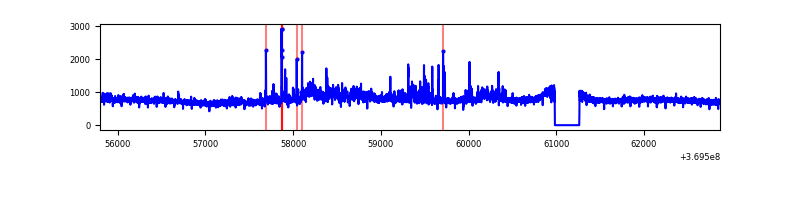 |
| C | 7067 | 6788 | 3 | 3 | 0.04% | 0.04% | 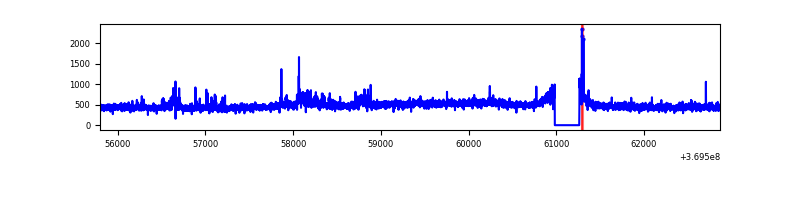 |
| D | 7067 | 6788 | 71 | 71 | 1.00% | 1.05% | 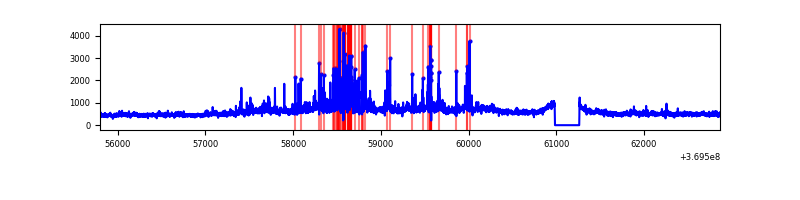 |
Top three noisy pixels from each quadrant. If the there are fewer than three noisy pixels in the level2.evt file, extra rows are filled as -1
| Pixel properties | Quadrant properties | ||||||
|---|---|---|---|---|---|---|---|
| Quadrant | DetID | PixID | Counts | Sigma | Mean | Median | Sigma |
| A | 13 | 254 | 12545 | 72.33 | 802 | 784 | 162.6 |
| A | 13 | 6 | 10638 | 60.6 | 802 | 784 | 162.6 |
| A | 3 | 137 | 8340 | 46.47 | 802 | 784 | 162.6 |
| B | 6 | 159 | 1909852 | 12549.95 | 791 | 771 | 152.1 |
| B | 0 | 190 | 155085 | 1014.43 | 791 | 771 | 152.1 |
| B | 15 | 219 | 116196 | 758.78 | 791 | 771 | 152.1 |
| C | 14 | 238 | 130429 | 721.83 | 769 | 772 | 179.6 |
| C | 0 | 10 | 129061 | 714.21 | 769 | 772 | 179.6 |
| C | 3 | 233 | 49905 | 273.53 | 769 | 772 | 179.6 |
| D | 8 | 195 | 983593 | 5426.87 | 771 | 749 | 181.1 |
| D | 12 | 233 | 298876 | 1646.14 | 771 | 749 | 181.1 |
| D | 7 | 38 | 82160 | 449.52 | 771 | 749 | 181.1 |
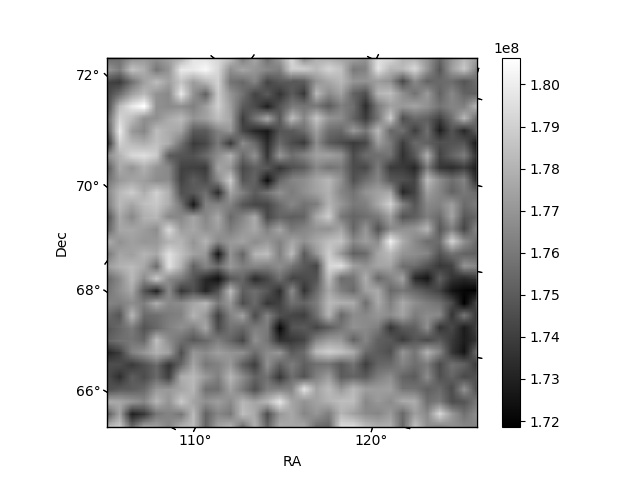
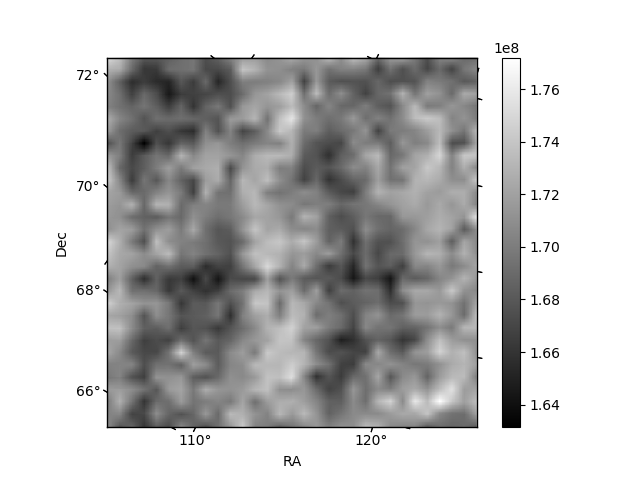
Histogram calculated using DETX and DETY for each event in the final _common_clean file
| Quadrant A | 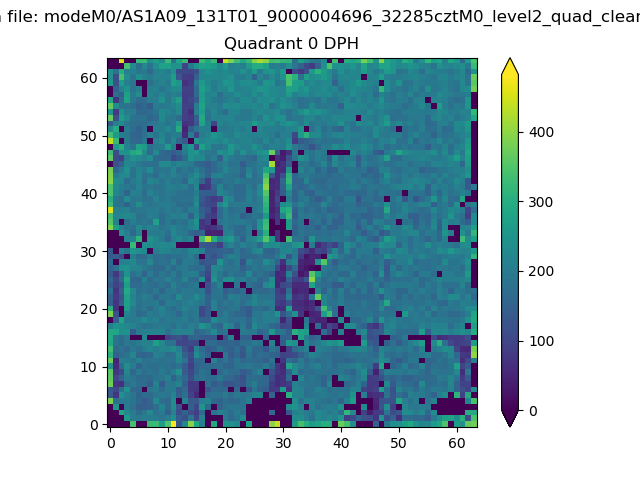 |
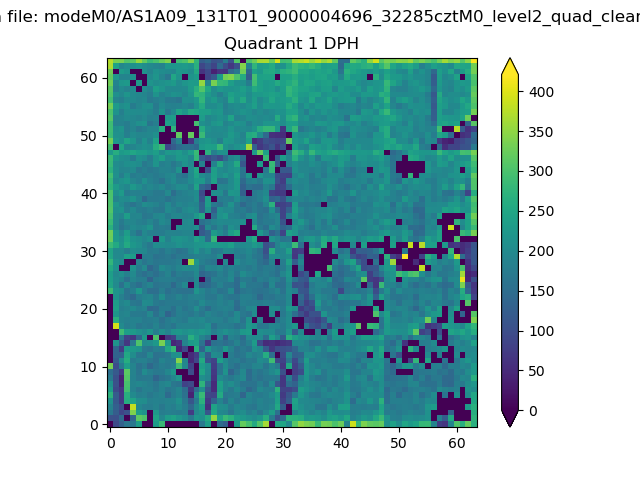 |
Quadrant B |
|---|---|---|---|
| Quadrant D |  |
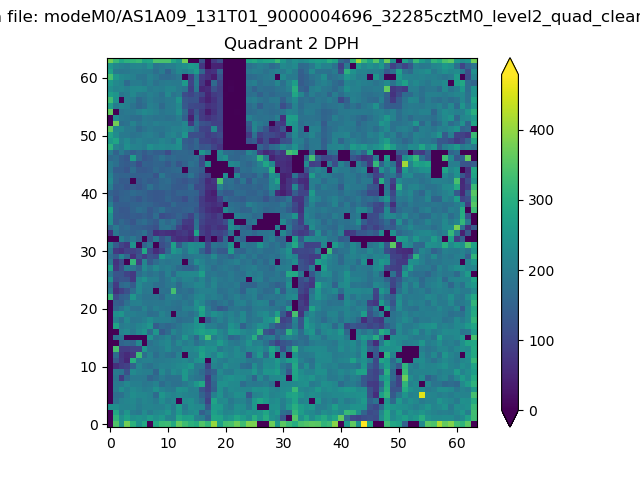 |
Quadrant C |
| Plot type | Count rate plots | Images |
|---|---|---|
| Comparison with Poisson distribution Blue bars denote a histogram of data divided into 1 sec bins. Red curve is a Poisson curve with rate = median count rate of data. |
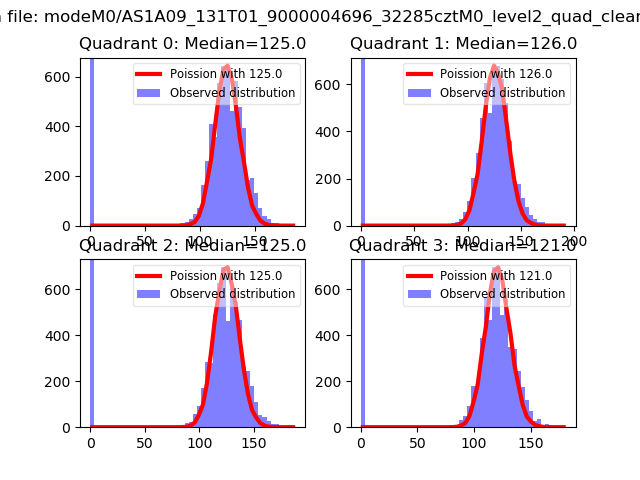 |
 |
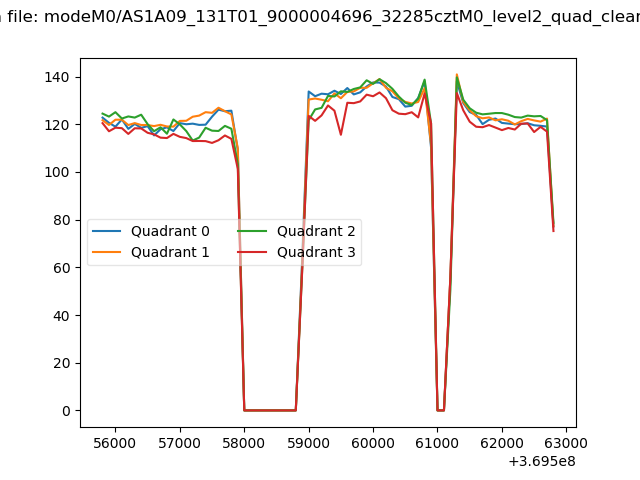
| Quadrant-wise count rates Data is divided into 100 sec bins |
 |
|
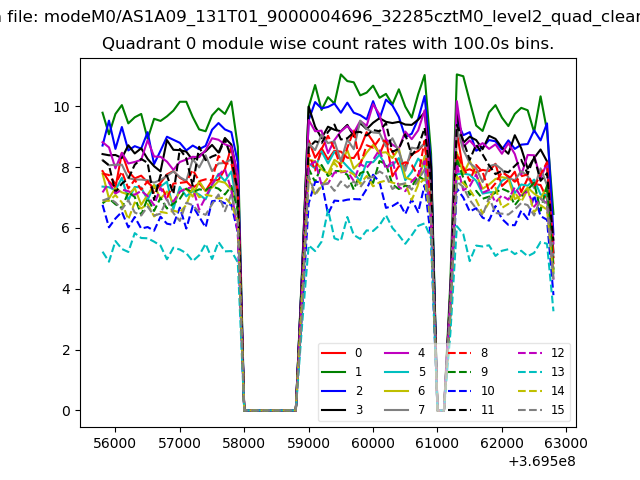
| Module-wise count rates for Quadrant A Data is divided into 100 sec bins |
 |
 |
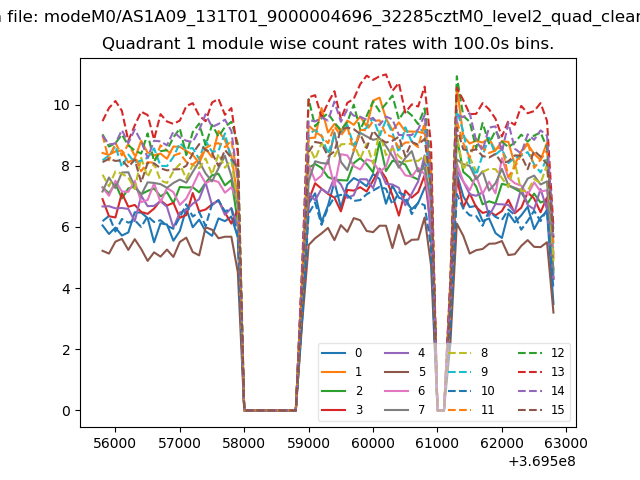
| Module-wise count rates for Quadrant B Data is divided into 100 sec bins |
 |
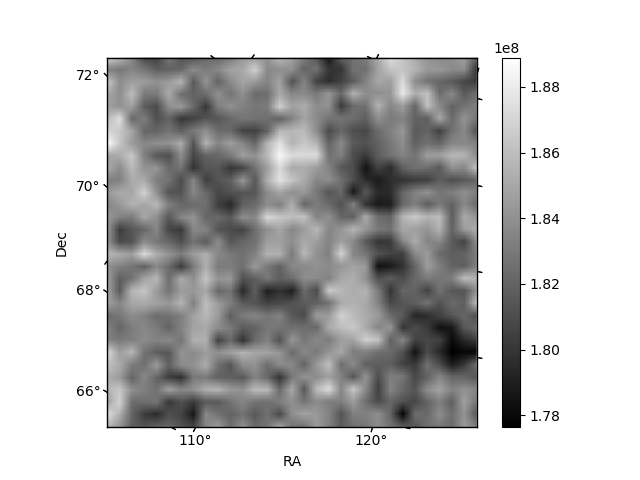 |
| Module-wise count rates for Quadrant C Data is divided into 100 sec bins |
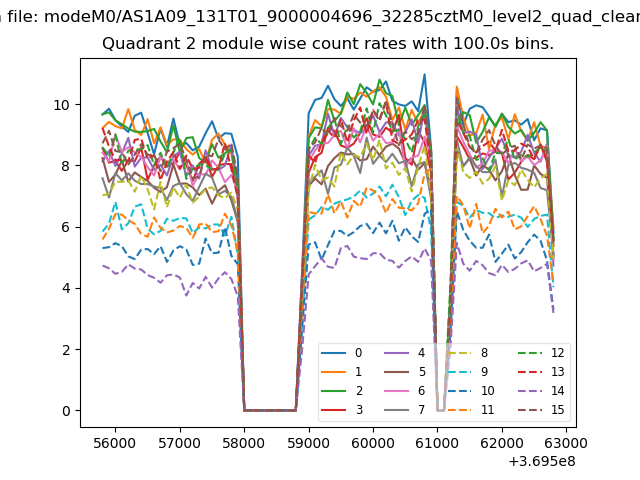 |
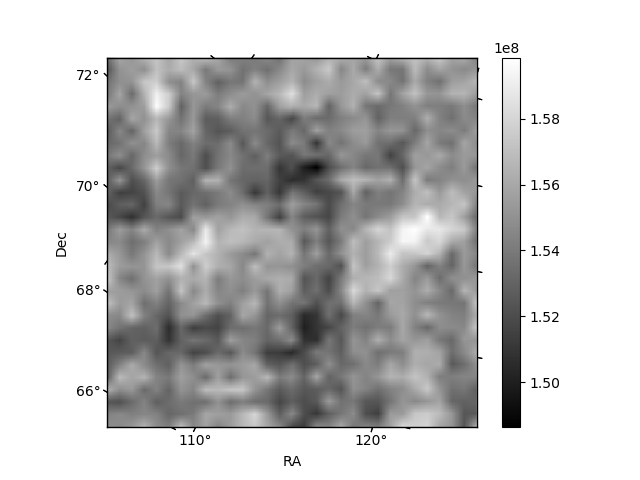 |
| Module-wise count rates for Quadrant D Data is divided into 100 sec bins |
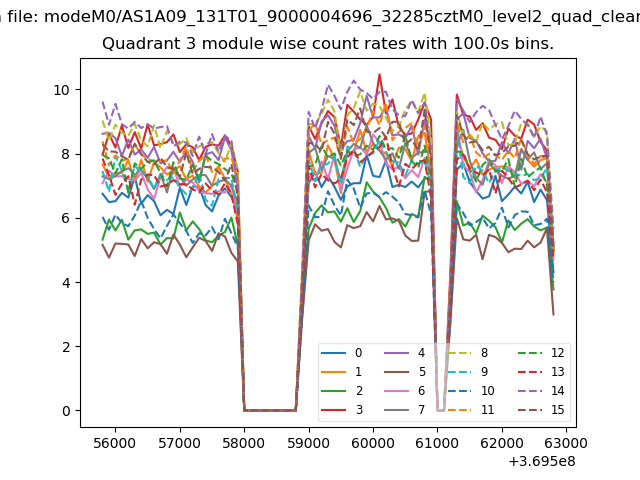 |
 |
| Parameter | Plot |
|---|---|
| CZT HV Monitor | 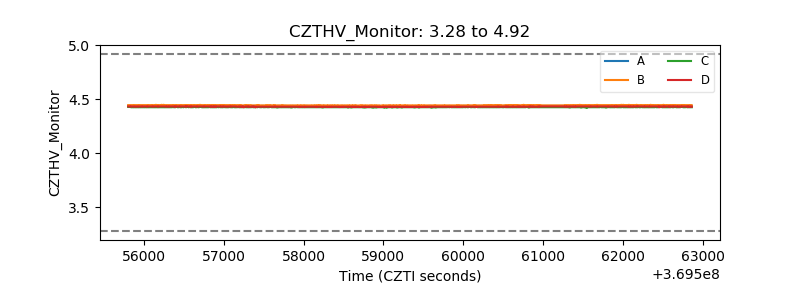 |
| D_VDD | 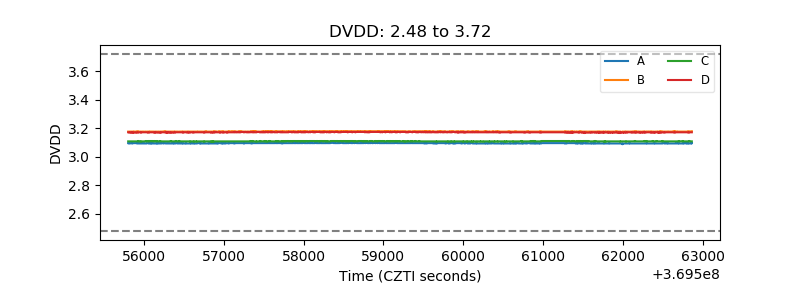 |
| Temperature 1 | 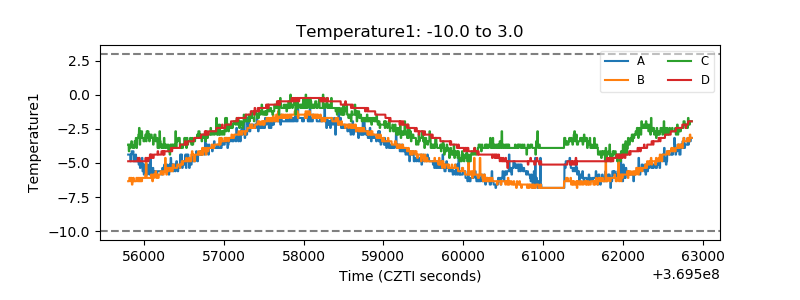 |
| Veto HV Monitor |  |
| Veto LLD | 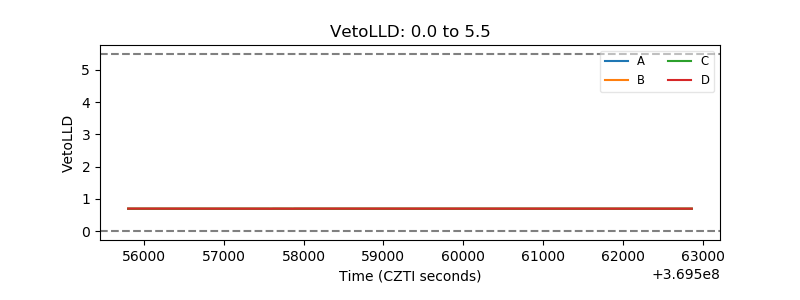 |
| Alpha Counter | 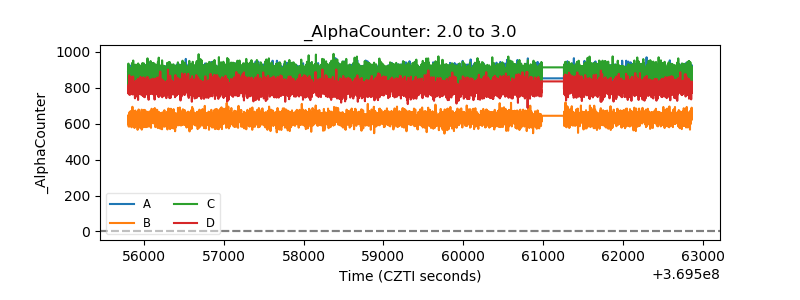 |
| _CPM_Rate | 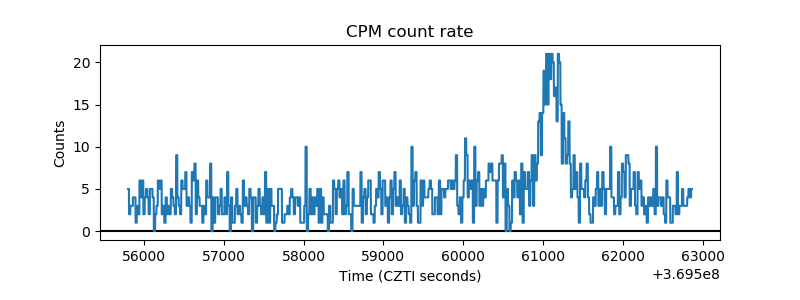 |
| CZT Counter | 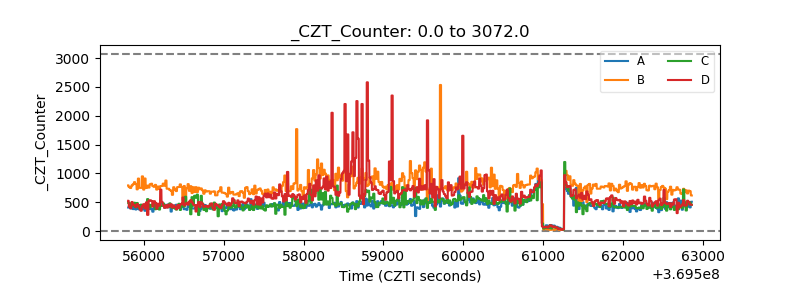 |
| +2.5 Volts monitor |  |
| +5 Volts monitor |  |
| _ROLL_ROT | 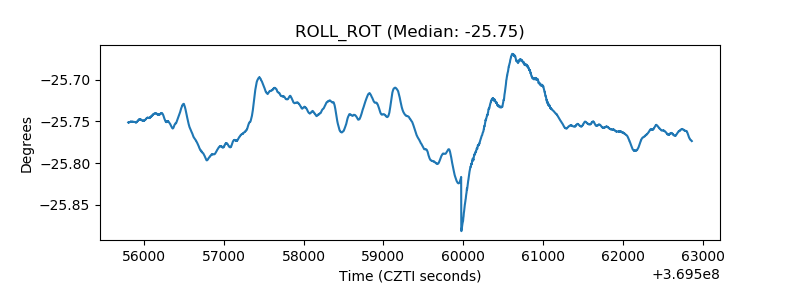 |
| _Roll_DEC | 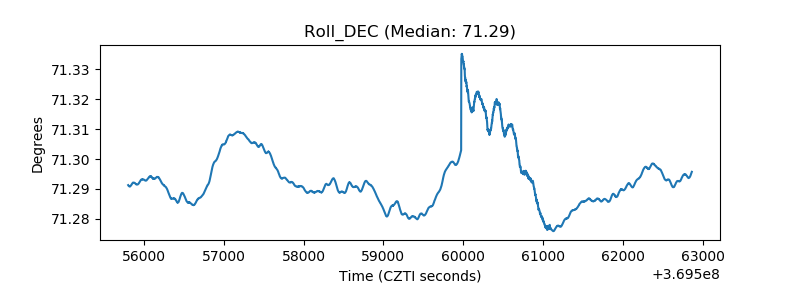 |
| _Roll_RA |  |
| Veto Counter | 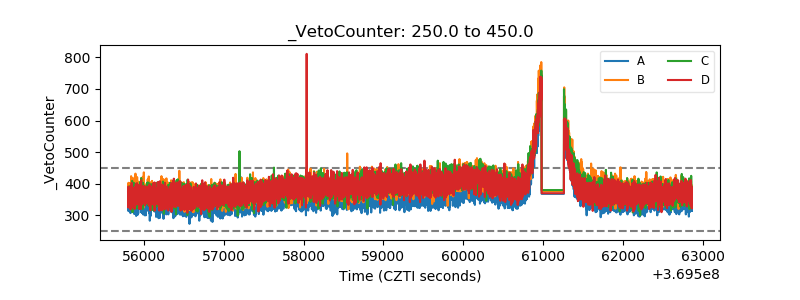 |