| Param | Original file | Final file |
|---|---|---|
| Filename | modeM0/AS1A09_131T01_9000004696_32289cztM0_level2.evt | modeM0/AS1A09_131T01_9000004696_32289cztM0_level2_quad_clean.evt |
| Size (bytes) | 665,026,560 | 92,724,480 |
| Size | 634.2 MB | 88.4 MB |
| Events in quadrant A | 3,472,031 | 605,945 |
| Events in quadrant B | 5,433,977 | 602,375 |
| Events in quadrant C | 3,604,086 | 597,101 |
| Events in quadrant D | 7,201,530 | 558,962 |
| Mode SS | |||
|---|---|---|---|
| Quadrant | BADHDUFLAG | Total packets | Discarded packets |
| A | 0 | 128 | 0 |
| B | 0 | 128 | 0 |
| C | 0 | 128 | 0 |
| D | 0 | 128 | 0 |
| Mode M9 | |||
|---|---|---|---|
| Quadrant | BADHDUFLAG | Total packets | Discarded packets |
| A | 0 | 10 | 0 |
| B | 0 | 10 | 0 |
| C | 0 | 10 | 0 |
| D | 0 | 10 | 0 |
| Mode M0 | |||
|---|---|---|---|
| Quadrant | BADHDUFLAG | Total packets | Discarded packets |
| A | 0 | 14413 | 2 |
| B | 0 | 20438 | 1 |
| C | 0 | 14699 | 1 |
| D | 0 | 25916 | 1 |
| Quadrant | Total seconds | Saturated seconds | Saturation percentage |
|---|---|---|---|
| A | 6358 | 122 | 1.918842% |
| B | 6358 | 173 | 2.720981% |
| C | 6358 | 188 | 2.956905% |
| D | 6358 | 652 | 10.254797% |
Noise dominated data is calculated using 1-second bins in cleaned event files. If a bin has >2000 counts, and if more than 50% of those come from <1% of pixels, then it is considered to be noise-dominated and hence unusable.
| Quadrant | # 1 sec bins | Bins with >0 counts | Bins with >2000 counts | High rate bins dominated by noise | Noise dominated (total time) | Noise dominated (detector-on time) | Marked lightcurve |
|---|---|---|---|---|---|---|---|
| A | 7313 | 6359 | 43 | 43 | 0.59% | 0.68% | 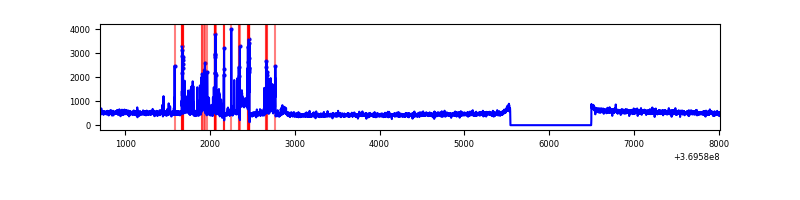 |
| B | 7313 | 6359 | 40 | 40 | 0.55% | 0.63% | 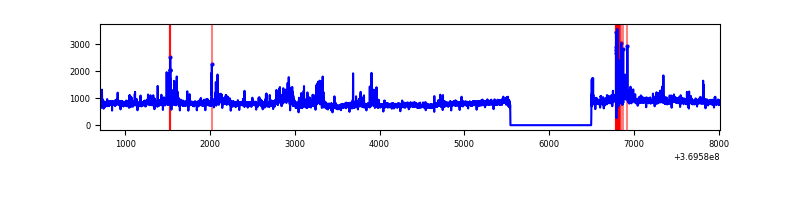 |
| C | 7313 | 6359 | 19 | 19 | 0.26% | 0.30% | 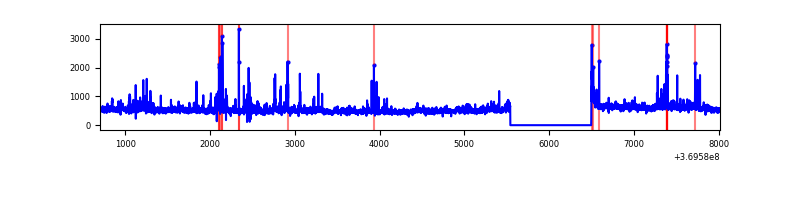 |
| D | 7313 | 6359 | 486 | 486 | 6.65% | 7.64% | 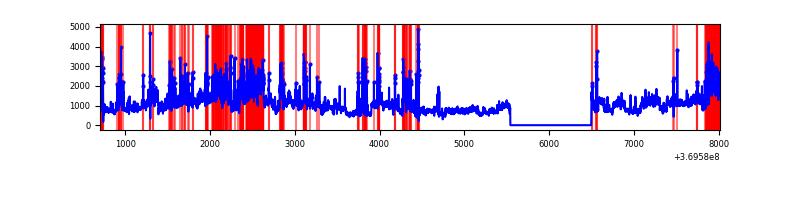 |
Top three noisy pixels from each quadrant. If the there are fewer than three noisy pixels in the level2.evt file, extra rows are filled as -1
| Pixel properties | Quadrant properties | ||||||
|---|---|---|---|---|---|---|---|
| Quadrant | DetID | PixID | Counts | Sigma | Mean | Median | Sigma |
| A | 0 | 6 | 431804 | 2751.97 | 777 | 762 | 156.6 |
| A | 0 | 226 | 33762 | 210.69 | 777 | 762 | 156.6 |
| A | 13 | 254 | 12309 | 73.72 | 777 | 762 | 156.6 |
| B | 6 | 159 | 1876053 | 12777.74 | 767 | 745 | 146.8 |
| B | 0 | 190 | 150113 | 1017.74 | 767 | 745 | 146.8 |
| B | 5 | 172 | 132423 | 897.21 | 767 | 745 | 146.8 |
| C | 3 | 233 | 257725 | 1463.47 | 748 | 751 | 175.6 |
| C | 0 | 10 | 156504 | 887.02 | 748 | 751 | 175.6 |
| C | 14 | 238 | 139914 | 792.54 | 748 | 751 | 175.6 |
| D | 8 | 195 | 2822931 | 16205.9 | 735 | 714 | 174.1 |
| D | 12 | 233 | 619365 | 3552.45 | 735 | 714 | 174.1 |
| D | 13 | 249 | 476182 | 2730.26 | 735 | 714 | 174.1 |
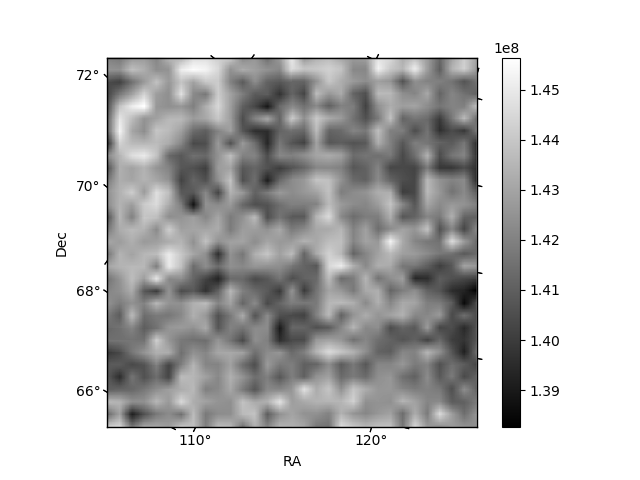
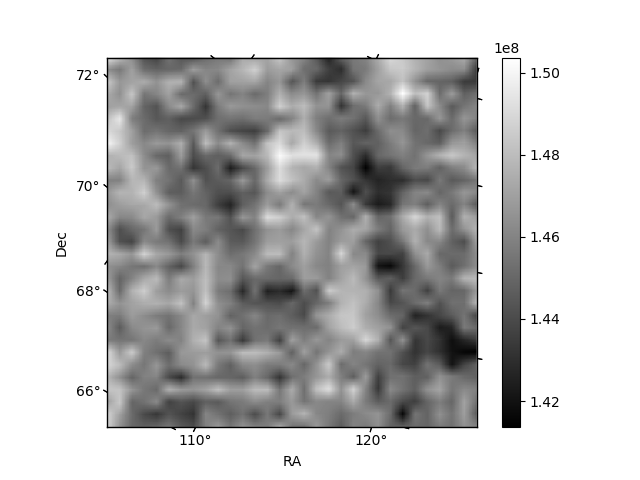
Histogram calculated using DETX and DETY for each event in the final _common_clean file
| Quadrant A | 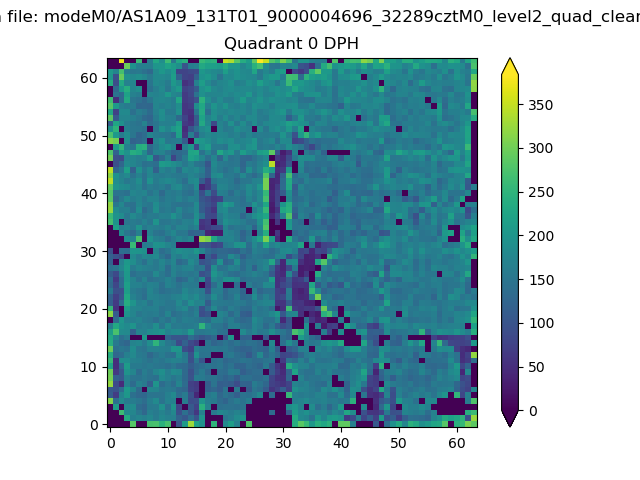 |
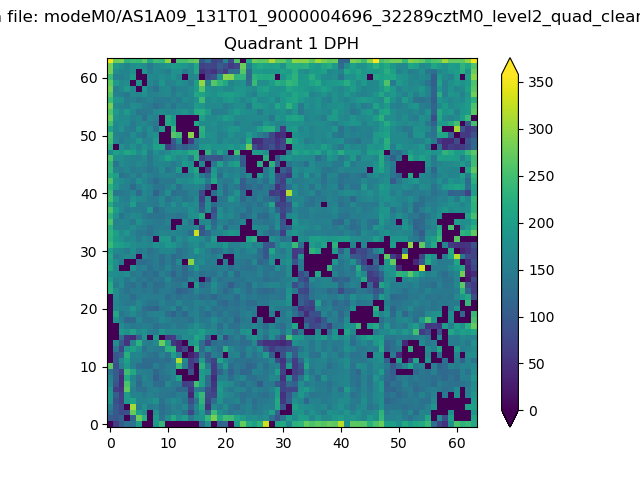 |
Quadrant B |
|---|---|---|---|
| Quadrant D | 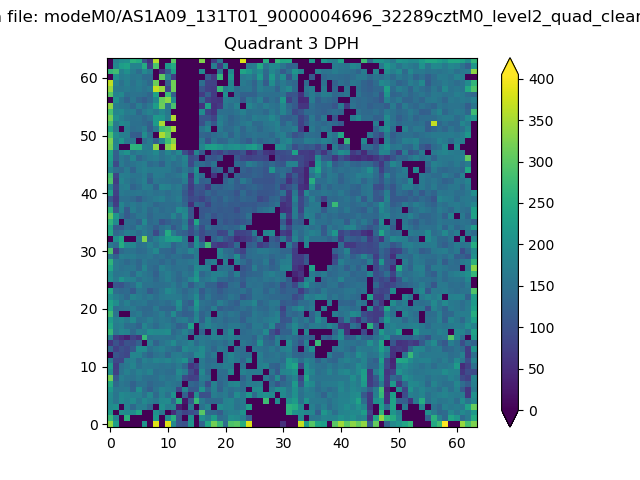 |
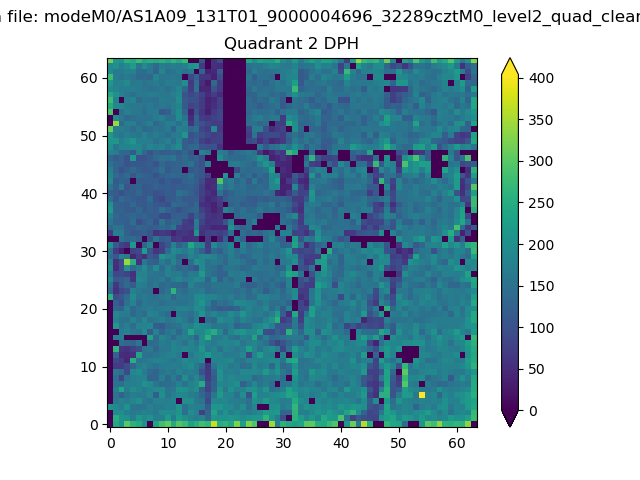 |
Quadrant C |
| Plot type | Count rate plots | Images |
|---|---|---|
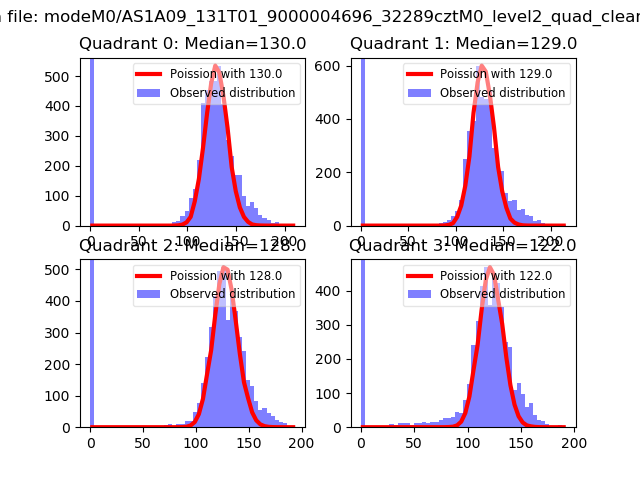
| Comparison with Poisson distribution Blue bars denote a histogram of data divided into 1 sec bins. Red curve is a Poisson curve with rate = median count rate of data. |
 |
 |
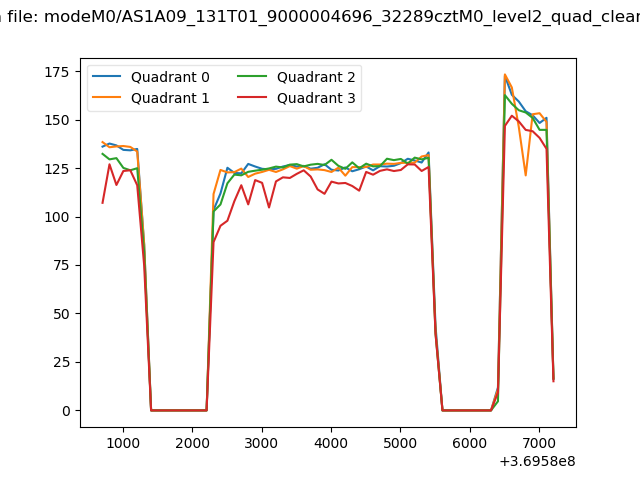
| Quadrant-wise count rates Data is divided into 100 sec bins |
 |
|
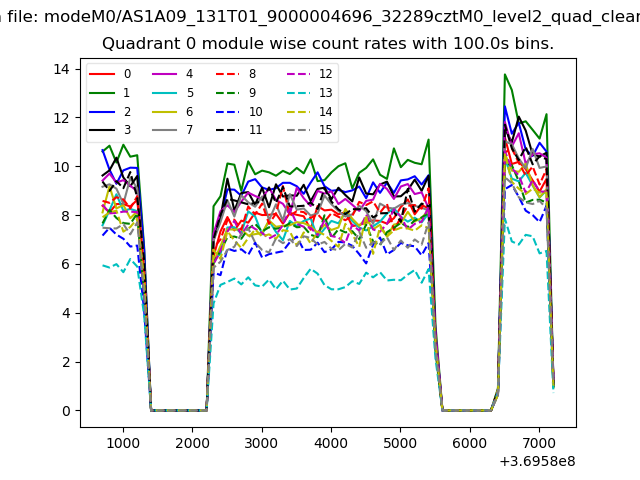
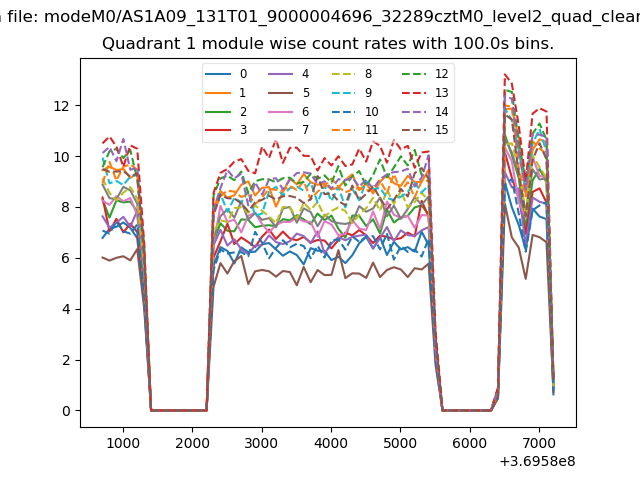
| Module-wise count rates for Quadrant A Data is divided into 100 sec bins |
 |
 |
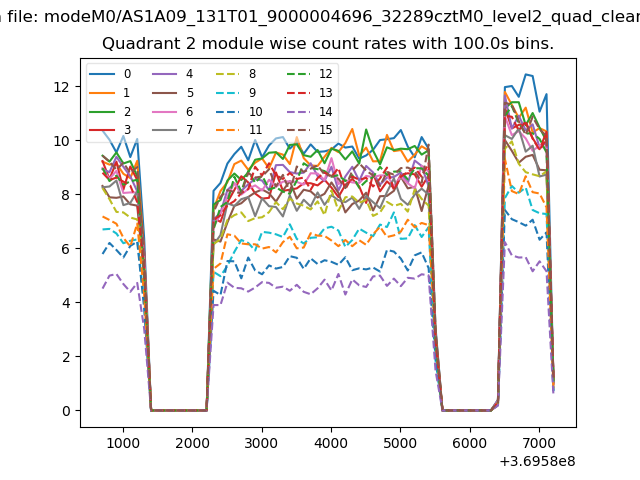
| Module-wise count rates for Quadrant B Data is divided into 100 sec bins |
 |
 |
| Module-wise count rates for Quadrant C Data is divided into 100 sec bins |
 |
 |
| Module-wise count rates for Quadrant D Data is divided into 100 sec bins |
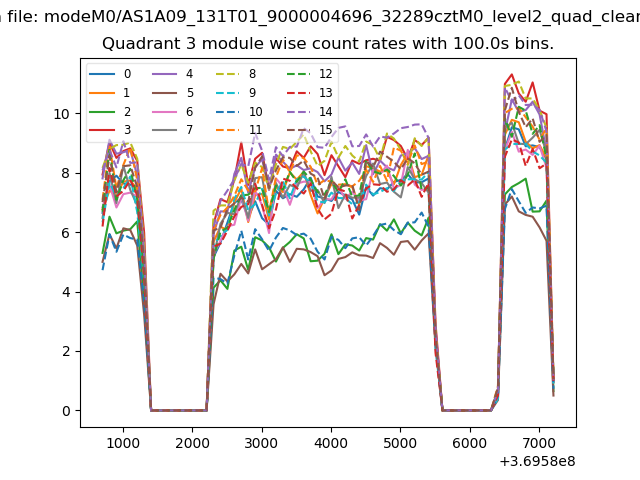 |
 |
| Parameter | Plot |
|---|---|
| CZT HV Monitor | 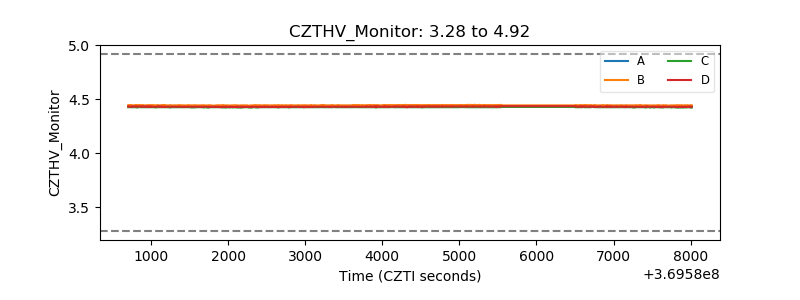 |
| D_VDD | 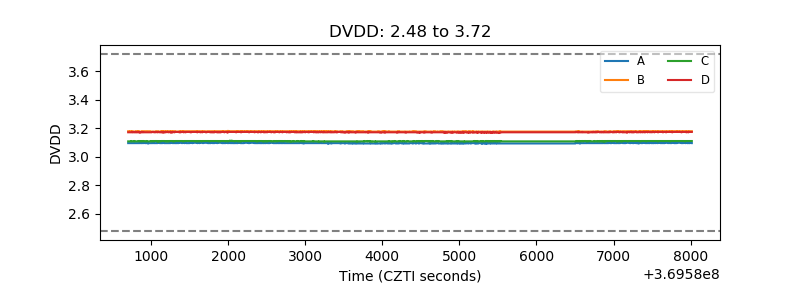 |
| Temperature 1 | 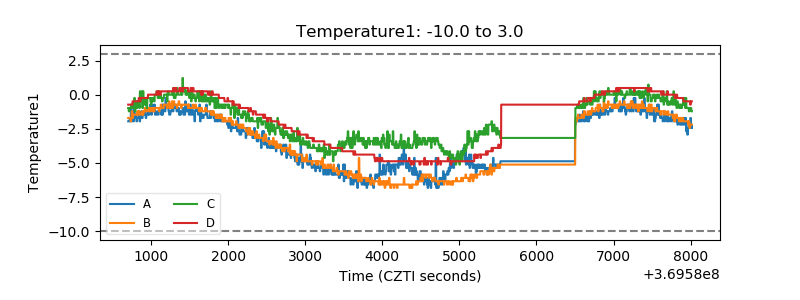 |
| Veto HV Monitor | 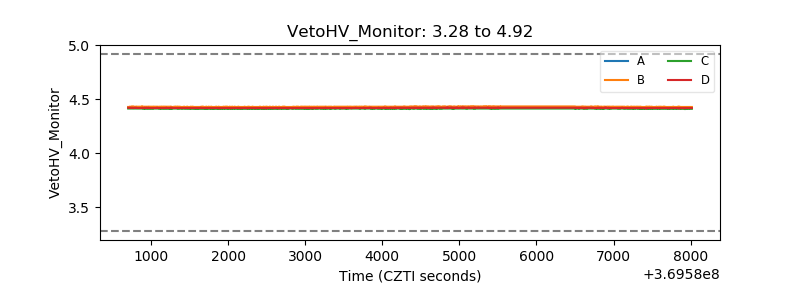 |
| Veto LLD | 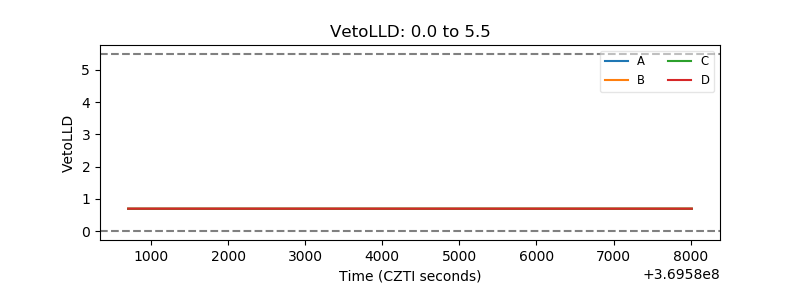 |
| Alpha Counter | 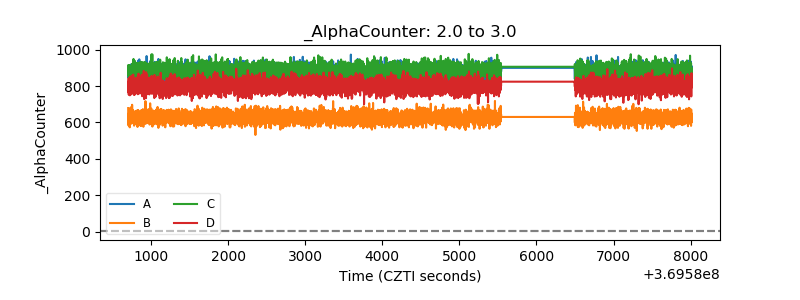 |
| _CPM_Rate | 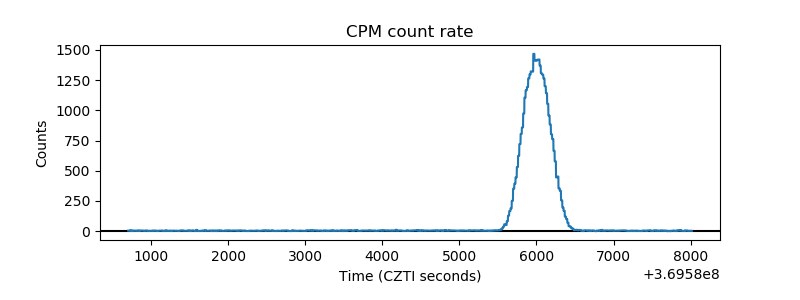 |
| CZT Counter | 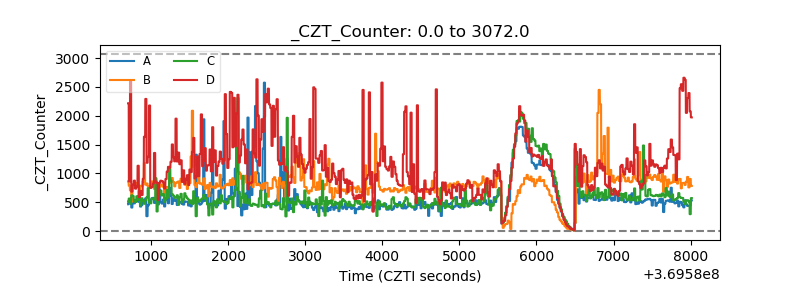 |
| +2.5 Volts monitor | 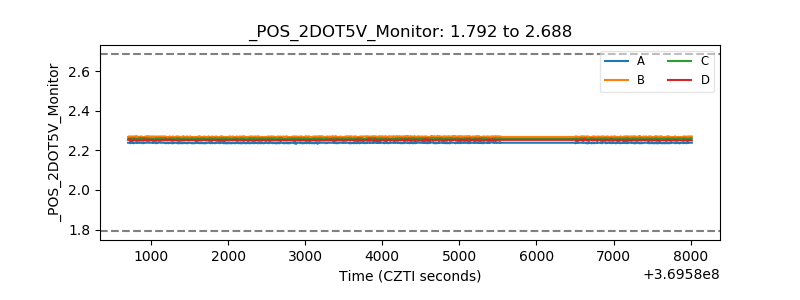 |
| +5 Volts monitor | 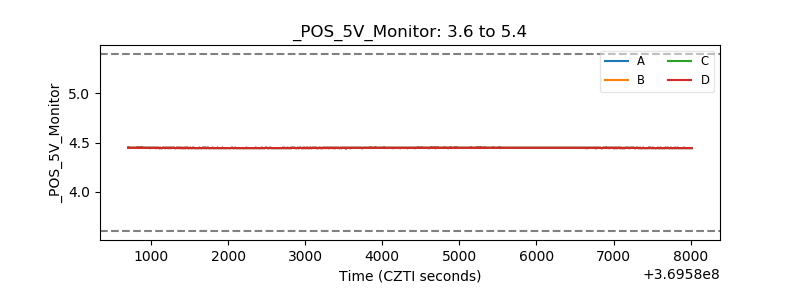 |
| _ROLL_ROT | 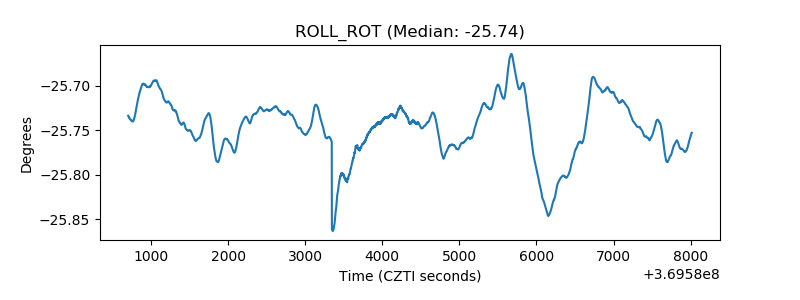 |
| _Roll_DEC | 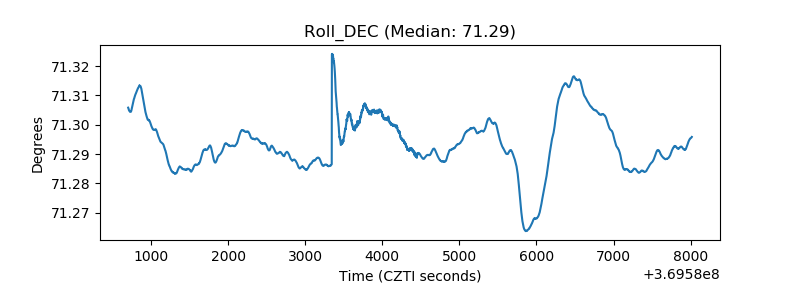 |
| _Roll_RA | 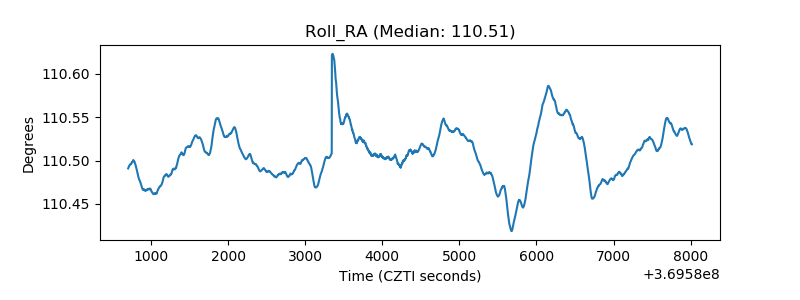 |
| Veto Counter | 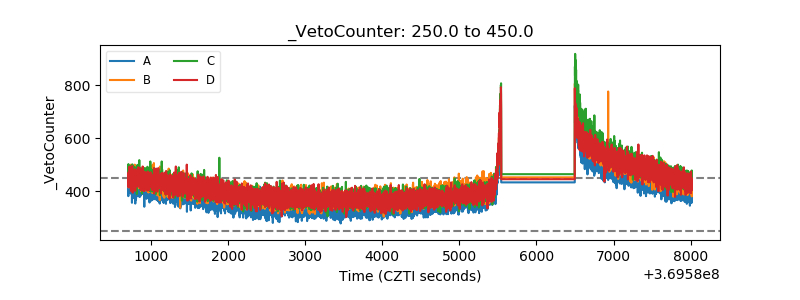 |