| Param | Original file | Final file |
|---|---|---|
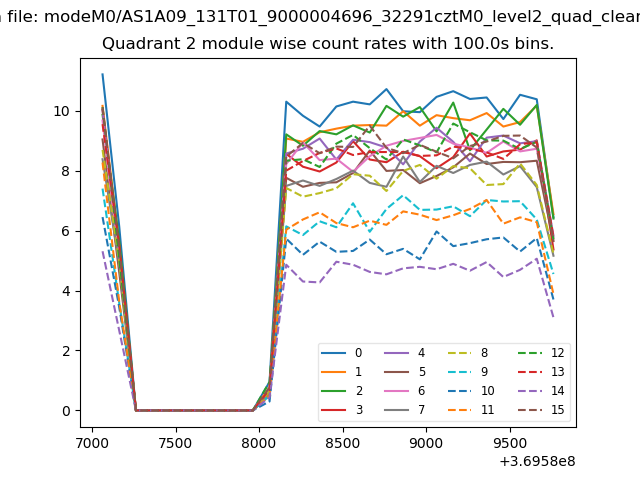
| Filename | modeM0/AS1A09_131T01_9000004696_32291cztM0_level2.evt | modeM0/AS1A09_131T01_9000004696_32291cztM0_level2_quad_clean.evt |
| Size (bytes) | 290,157,120 | 37,258,560 |
| Size | 276.7 MB | 35.5 MB |
| Events in quadrant A | 1,284,640 | 240,728 |
| Events in quadrant B | 2,279,266 | 237,100 |
| Events in quadrant C | 1,578,448 | 236,989 |
| Events in quadrant D | 3,456,319 | 215,091 |
| Mode SS | |||
|---|---|---|---|
| Quadrant | BADHDUFLAG | Total packets | Discarded packets |
| A | 0 | 54 | 0 |
| B | 0 | 54 | 0 |
| C | 0 | 54 | 0 |
| D | 0 | 54 | 0 |
| Mode M0 | |||
|---|---|---|---|
| Quadrant | BADHDUFLAG | Total packets | Discarded packets |
| A | 0 | 5632 | 0 |
| B | 0 | 8676 | 0 |
| C | 0 | 6487 | 0 |
| D | 0 | 12159 | 0 |
| Quadrant | Total seconds | Saturated seconds | Saturation percentage |
|---|---|---|---|
| A | 2770 | 1 | 0.036101% |
| B | 2770 | 15 | 0.541516% |
| C | 2770 | 32 | 1.155235% |
| D | 2770 | 461 | 16.642599% |
Noise dominated data is calculated using 1-second bins in cleaned event files. If a bin has >2000 counts, and if more than 50% of those come from <1% of pixels, then it is considered to be noise-dominated and hence unusable.
| Quadrant | # 1 sec bins | Bins with >0 counts | Bins with >2000 counts | High rate bins dominated by noise | Noise dominated (total time) | Noise dominated (detector-on time) | Marked lightcurve |
|---|---|---|---|---|---|---|---|
| A | 2770 | 2770 | 0 | 0 | 0.00% | 0.00% | 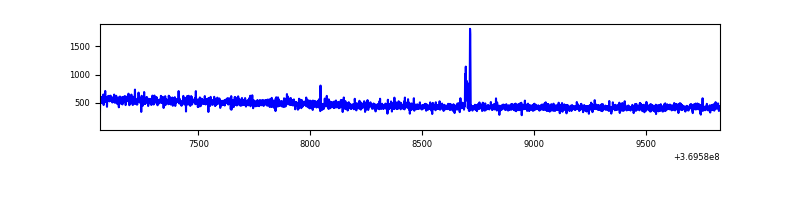 |
| B | 2770 | 2770 | 3 | 3 | 0.11% | 0.11% | 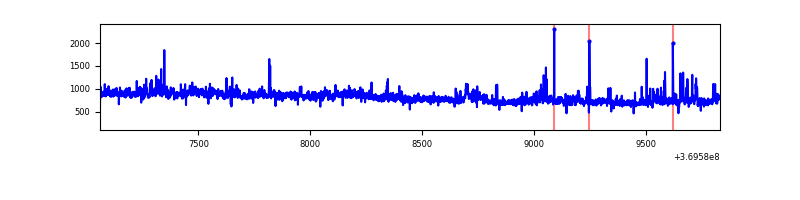 |
| C | 2770 | 2770 | 7 | 7 | 0.25% | 0.25% | 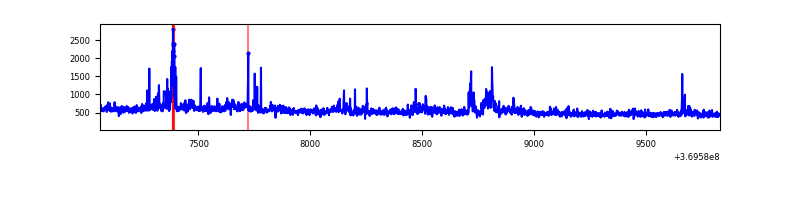 |
| D | 2770 | 2770 | 408 | 408 | 14.73% | 14.73% | 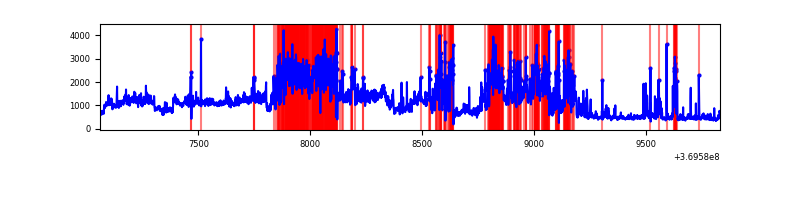 |
Top three noisy pixels from each quadrant. If the there are fewer than three noisy pixels in the level2.evt file, extra rows are filled as -1
| Pixel properties | Quadrant properties | ||||||
|---|---|---|---|---|---|---|---|
| Quadrant | DetID | PixID | Counts | Sigma | Mean | Median | Sigma |
| A | 0 | 6 | 9809 | 141.06 | 328 | 321 | 67.3 |
| A | 13 | 6 | 7455 | 106.06 | 328 | 321 | 67.3 |
| A | 13 | 254 | 5783 | 81.2 | 328 | 321 | 67.3 |
| B | 6 | 159 | 847878 | 13516.01 | 326 | 318 | 62.7 |
| B | 0 | 190 | 45591 | 721.97 | 326 | 318 | 62.7 |
| B | 0 | 229 | 34114 | 538.94 | 326 | 318 | 62.7 |
| C | 3 | 233 | 195599 | 2551.82 | 321 | 323 | 76.5 |
| C | 14 | 238 | 51505 | 668.83 | 321 | 323 | 76.5 |
| C | 0 | 10 | 41232 | 534.59 | 321 | 323 | 76.5 |
| D | 8 | 195 | 947311 | 13046.1 | 304 | 296 | 72.6 |
| D | 7 | 38 | 662334 | 9120.25 | 304 | 296 | 72.6 |
| D | 13 | 249 | 322439 | 4437.85 | 304 | 296 | 72.6 |
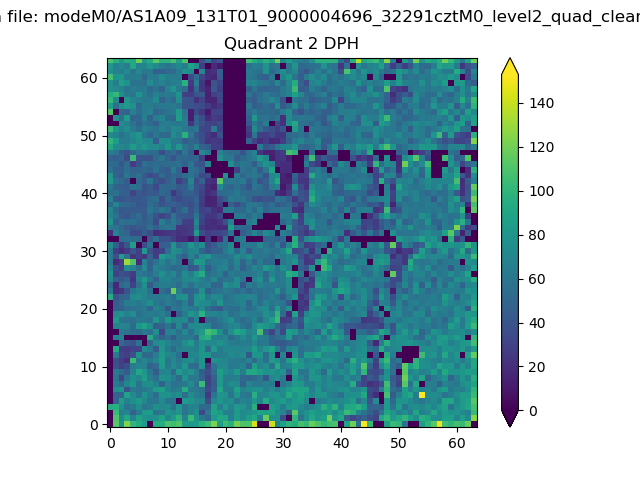
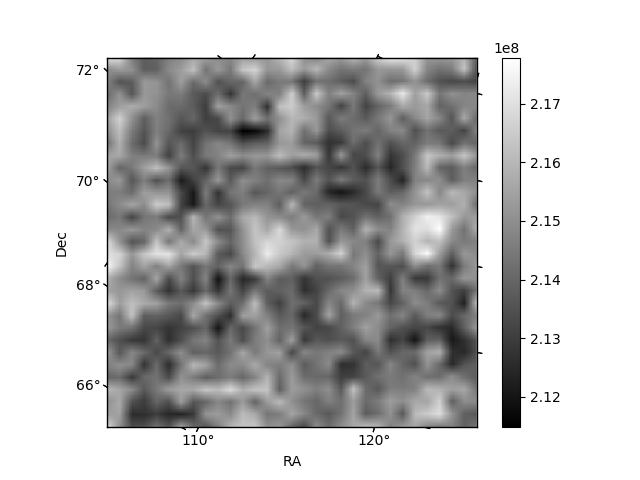
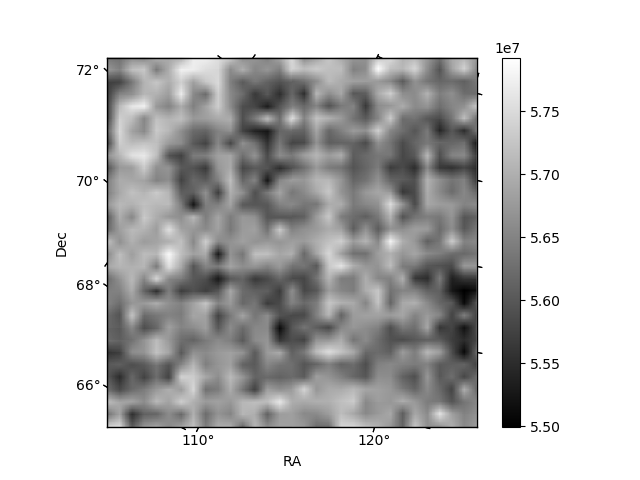
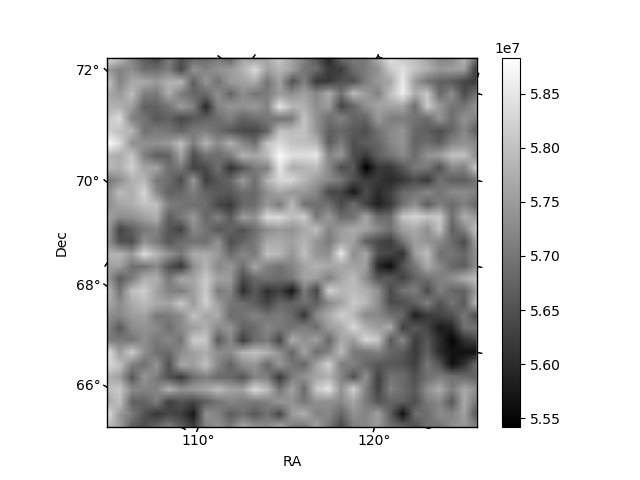
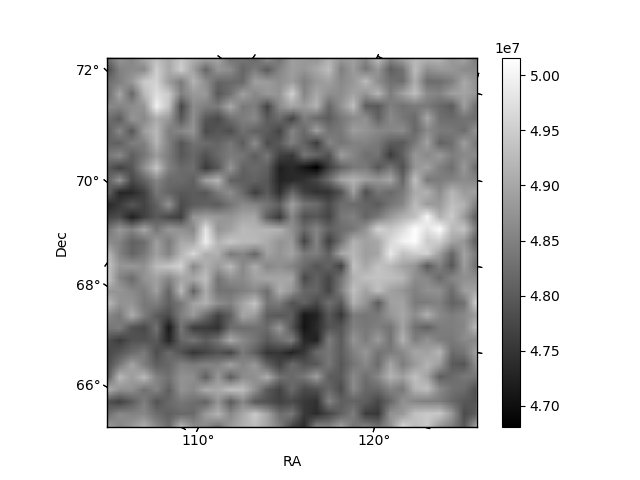
Histogram calculated using DETX and DETY for each event in the final _common_clean file
| Quadrant A | 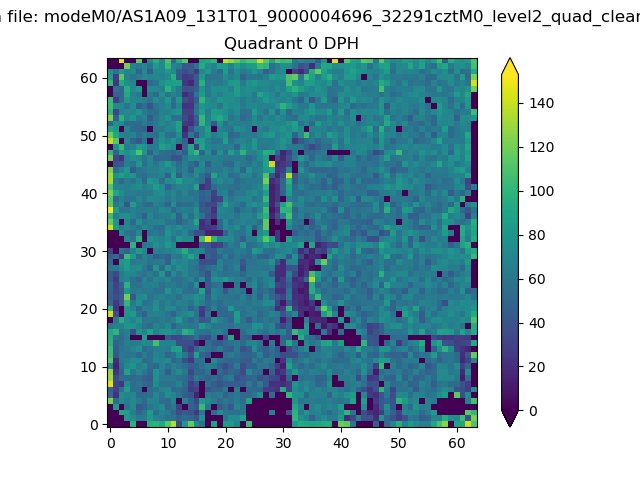 |
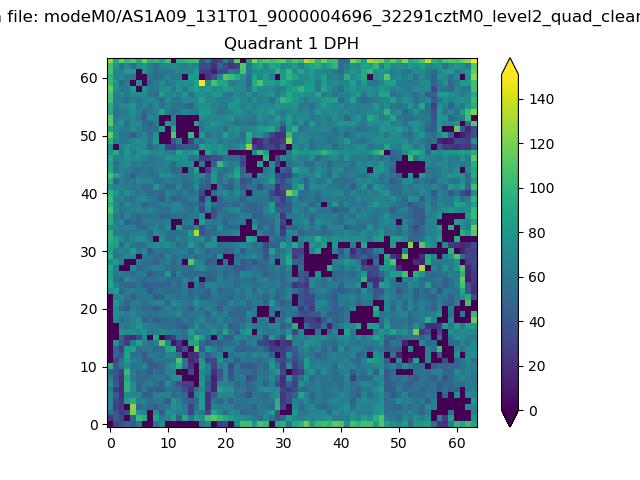 |
Quadrant B |
|---|---|---|---|
| Quadrant D | 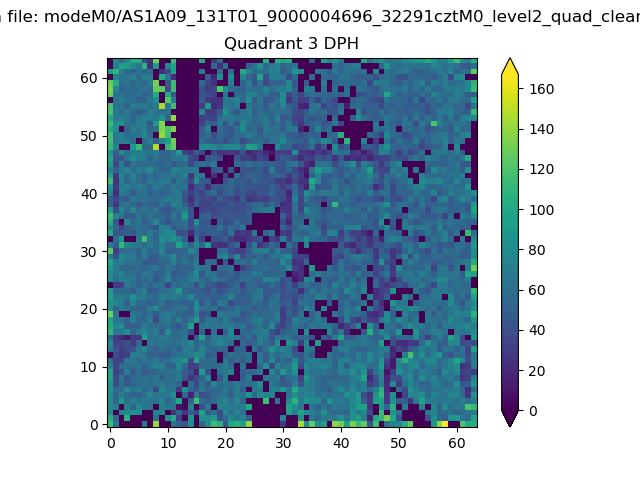 |
 |
Quadrant C |
| Plot type | Count rate plots | Images |
|---|---|---|
| Comparison with Poisson distribution Blue bars denote a histogram of data divided into 1 sec bins. Red curve is a Poisson curve with rate = median count rate of data. |
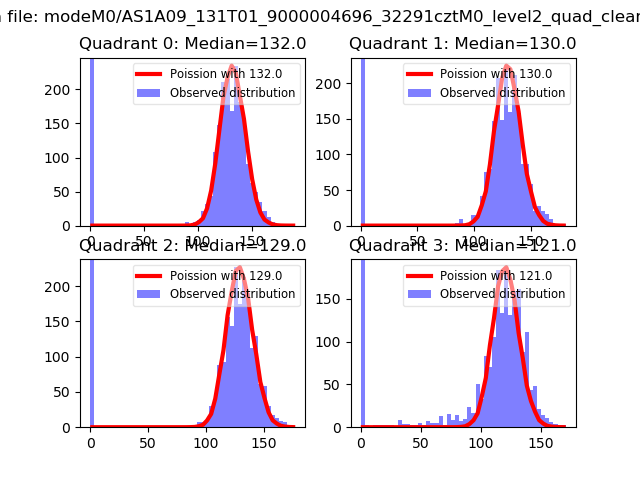 |
 |
| Quadrant-wise count rates Data is divided into 100 sec bins |
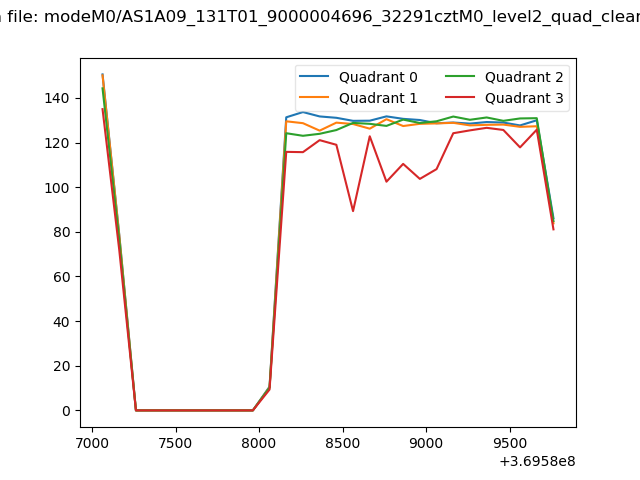 |
|
| Module-wise count rates for Quadrant A Data is divided into 100 sec bins |
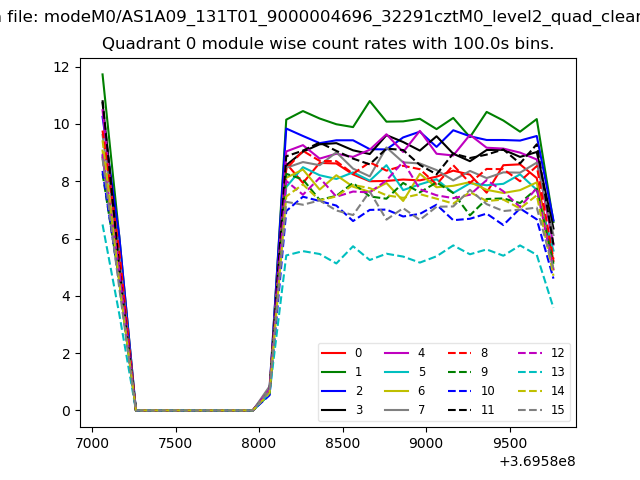 |
 |
| Module-wise count rates for Quadrant B Data is divided into 100 sec bins |
 |
 |
| Module-wise count rates for Quadrant C Data is divided into 100 sec bins |
 |
 |
| Module-wise count rates for Quadrant D Data is divided into 100 sec bins |
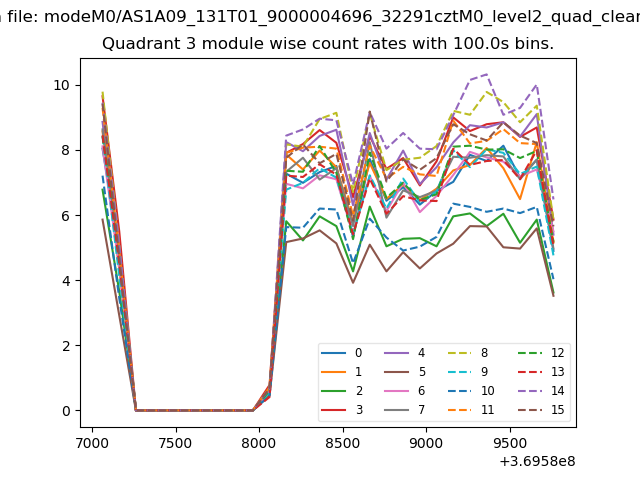 |
 |
| Parameter | Plot |
|---|---|
| CZT HV Monitor | 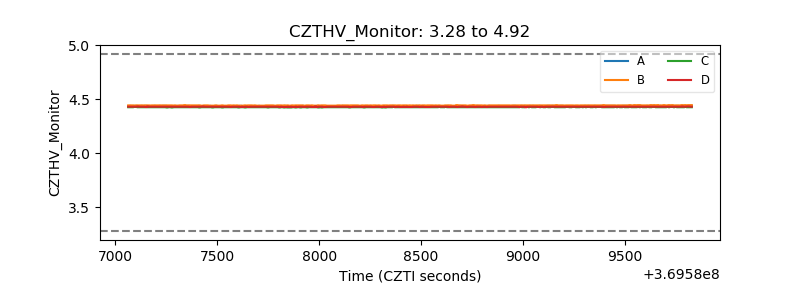 |
| D_VDD | 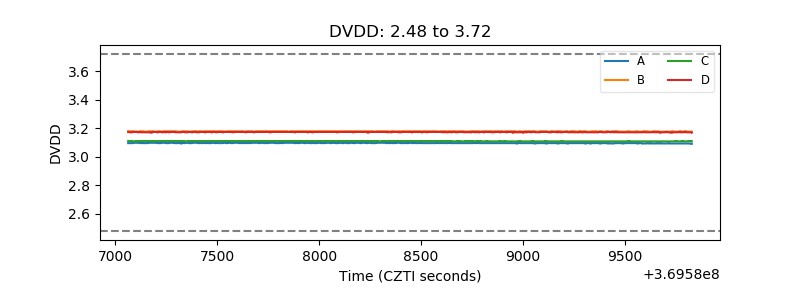 |
| Temperature 1 | 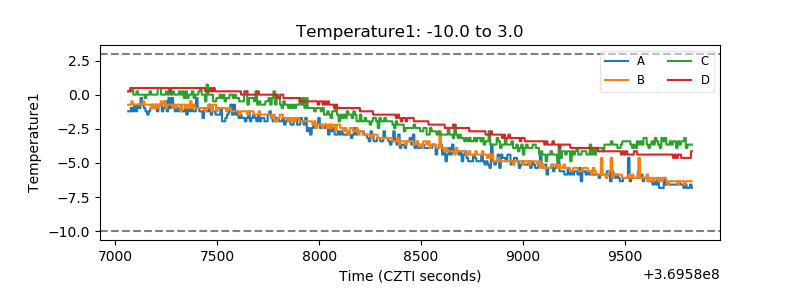 |
| Veto HV Monitor | 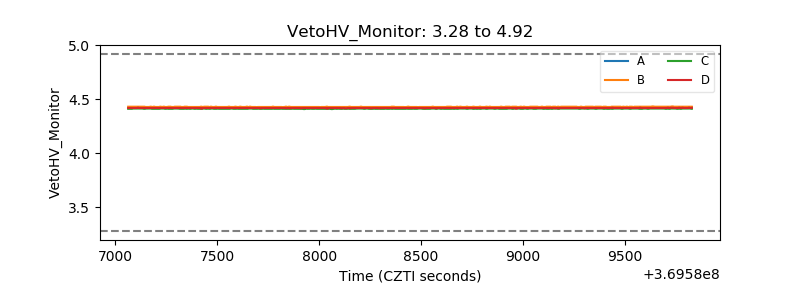 |
| Veto LLD | 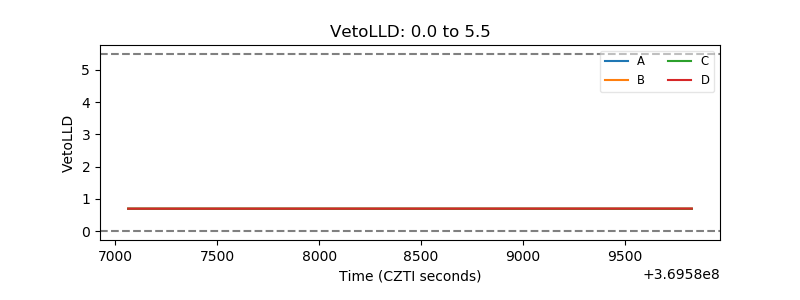 |
| Alpha Counter | 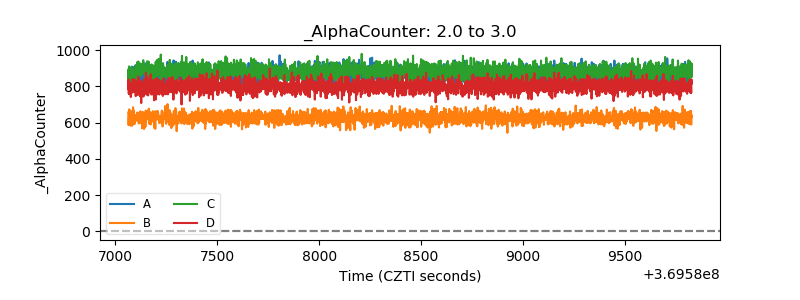 |
| _CPM_Rate | 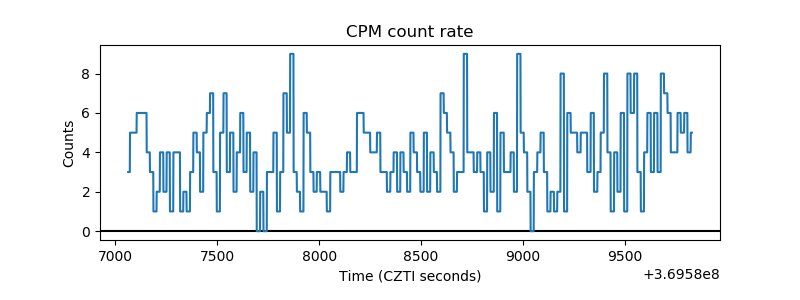 |
| CZT Counter | 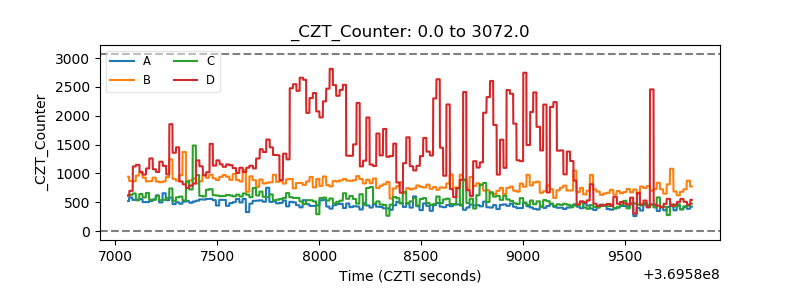 |
| +2.5 Volts monitor |  |
| +5 Volts monitor |  |
| _ROLL_ROT |  |
| _Roll_DEC | 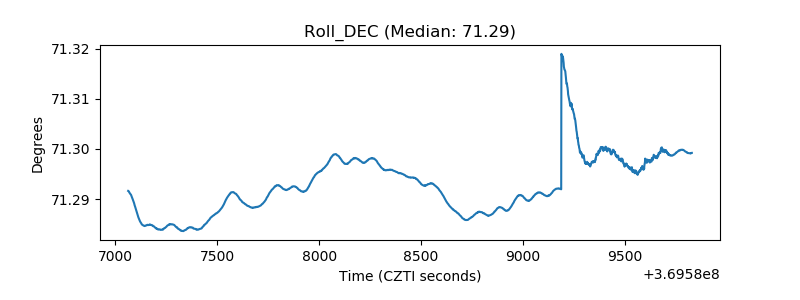 |
| _Roll_RA | 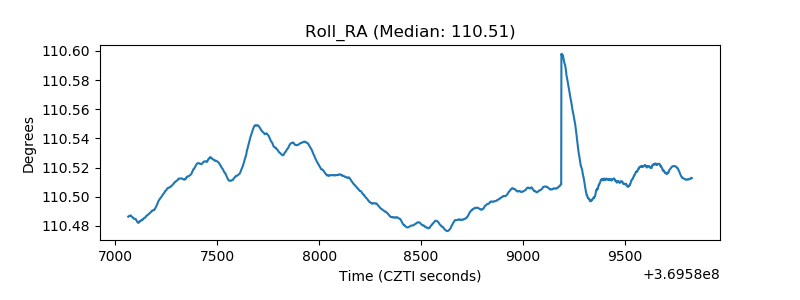 |
| Veto Counter | 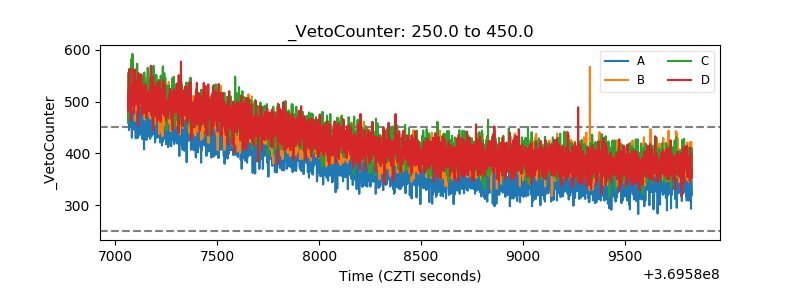 |