| Param | Original file | Final file |
|---|---|---|
| Filename | modeM0/AS1A10_005T01_9000004700cztM0_level2.fits | modeM0/AS1A10_005T01_9000004700cztM0_level2_quad_clean.evt |
| Size (bytes) | 2,796,042,240 | 2,386,028,160 |
| Size | 2.6 GB | 2.2 GB |
| Events in quadrant A | 17,638,354 | 14,400,634 |
| Events in quadrant B | 16,150,066 | 13,326,882 |
| Events in quadrant C | 16,490,632 | 12,782,420 |
| Events in quadrant D | 14,404,342 | 11,773,346 |
| Mode M0 | |||
|---|---|---|---|
| Quadrant | BADHDUFLAG | Total packets | Discarded packets |
| A | 0 | 615450 | 0 |
| B | 0 | 975715 | 0 |
| C | 0 | 761487 | 0 |
| D | 0 | 967652 | 0 |
| Mode M9 | |||
|---|---|---|---|
| Quadrant | BADHDUFLAG | Total packets | Discarded packets |
| A | 0 | 462 | 0 |
| B | 0 | 462 | 0 |
| C | 0 | 462 | 0 |
| D | 0 | 462 | 0 |
| Mode SS | |||
|---|---|---|---|
| Quadrant | BADHDUFLAG | Total packets | Discarded packets |
| A | 0 | 5938 | 0 |
| B | 0 | 5938 | 0 |
| C | 0 | 5938 | 0 |
| D | 0 | 5938 | 0 |
| Quadrant | Total seconds | Saturated seconds | Saturation percentage |
|---|---|---|---|
| A | 291653 | 4094 | 1.403723% |
| B | 291646 | 17650 | 6.051857% |
| C | 291649 | 22216 | 7.617376% |
| D | 291652 | 17323 | 5.939613% |
Noise dominated data is calculated using 1-second bins in cleaned event files. If a bin has >2000 counts, and if more than 50% of those come from <1% of pixels, then it is considered to be noise-dominated and hence unusable.
| Quadrant | # 1 sec bins | Bins with >0 counts | Bins with >2000 counts | High rate bins dominated by noise | Noise dominated (total time) | Noise dominated (detector-on time) | Marked lightcurve |
|---|---|---|---|---|---|---|---|
| A | 337679 | 291647 | 0 | 0 | 0.00% | 0.00% |  |
| B | 337679 | 291485 | 0 | 0 | 0.00% | 0.00% |  |
| C | 337679 | 291419 | 0 | 0 | 0.00% | 0.00% |  |
| D | 337679 | 291371 | 0 | 0 | 0.00% | 0.00% |  |
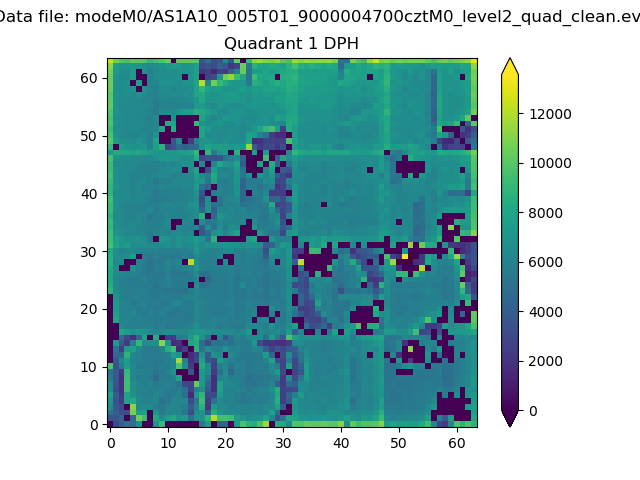
Top three noisy pixels from each quadrant. If the there are fewer than three noisy pixels in the level2.evt file, extra rows are filled as -1
| Pixel properties | Quadrant properties | ||||||
|---|---|---|---|---|---|---|---|
| Quadrant | DetID | PixID | Counts | Sigma | Mean | Median | Sigma |
| A | 0 | 29 | 17541 | 11.87 | 4598 | 4326 | 1113.7 |
| A | 7 | 110 | 14276 | 8.93 | 4598 | 4326 | 1113.7 |
| A | 0 | 30 | 13806 | 8.51 | 4598 | 4326 | 1113.7 |
| B | 2 | 9 | 13118 | 10.81 | 4287 | 4098 | 834.2 |
| B | 2 | 8 | 10997 | 8.27 | 4287 | 4098 | 834.2 |
| B | 3 | 17 | 10801 | 8.03 | 4287 | 4098 | 834.2 |
| C | 12 | 241 | 11803 | 7.1 | 4371 | 4102 | 1084.7 |
| C | 3 | 187 | 11515 | 6.83 | 4371 | 4102 | 1084.7 |
| C | 9 | 209 | 11076 | 6.43 | 4371 | 4102 | 1084.7 |
| D | 10 | 189 | 10645 | 6.33 | 4131 | 3751 | 1089.4 |
| D | 6 | 67 | 10186 | 5.91 | 4131 | 3751 | 1089.4 |
| D | 7 | 3 | 10078 | 5.81 | 4131 | 3751 | 1089.4 |
Histogram calculated using DETX and DETY for each event in the final _common_clean file
| Quadrant A |  |
 |
Quadrant B |
|---|---|---|---|
| Quadrant D |  |
 |
Quadrant C |
| Plot type | Count rate plots | Images |
|---|---|---|
| Comparison with Poisson distribution Blue bars denote a histogram of data divided into 1 sec bins. Red curve is a Poisson curve with rate = median count rate of data. |
 |
 |
| Quadrant-wise count rates Data is divided into 100 sec bins |
 |
|
| Module-wise count rates for Quadrant A Data is divided into 100 sec bins |
 |
 |
| Module-wise count rates for Quadrant B Data is divided into 100 sec bins |
 |
 |
| Module-wise count rates for Quadrant C Data is divided into 100 sec bins |
 |
 |
| Module-wise count rates for Quadrant D Data is divided into 100 sec bins |
 |
 |
| Parameter | Plot |
|---|---|
| CZT HV Monitor |  |
| D_VDD |  |
| Temperature 1 | 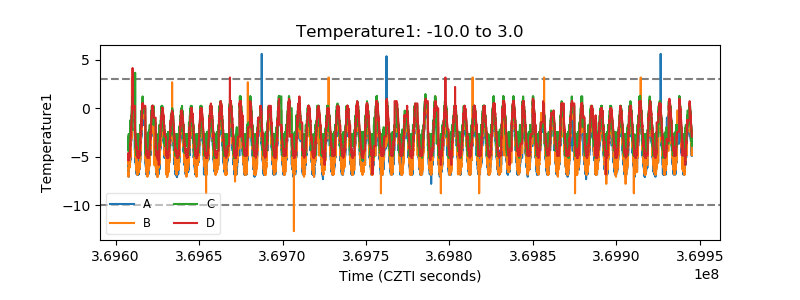 |
| Veto HV Monitor |  |
| Veto LLD |  |
| Alpha Counter |  |
| _CPM_Rate |  |
| CZT Counter |  |
| +2.5 Volts monitor |  |
| +5 Volts monitor |  |
| _ROLL_ROT |  |
| _Roll_DEC |  |
| _Roll_RA |  |
| Veto Counter |  |