| Param | Original file | Final file |
|---|---|---|
| Filename | modeM0/AS1A10_005T01_9000004700_32294cztM0_level2.evt | modeM0/AS1A10_005T01_9000004700_32294cztM0_level2_quad_clean.evt |
| Size (bytes) | 381,165,120 | 59,155,200 |
| Size | 363.5 MB | 56.4 MB |
| Events in quadrant A | 2,153,185 | 392,495 |
| Events in quadrant B | 3,536,432 | 390,992 |
| Events in quadrant C | 2,735,201 | 358,563 |
| Events in quadrant D | 2,840,463 | 360,154 |
| Mode M0 | |||
|---|---|---|---|
| Quadrant | BADHDUFLAG | Total packets | Discarded packets |
| A | 0 | 8824 | 2 |
| B | 0 | 13261 | 1 |
| C | 0 | 10735 | 1 |
| D | 0 | 10983 | 1 |
| Mode M9 | |||
|---|---|---|---|
| Quadrant | BADHDUFLAG | Total packets | Discarded packets |
| A | 0 | 13 | 0 |
| B | 0 | 13 | 0 |
| C | 0 | 13 | 0 |
| D | 0 | 13 | 0 |
| Mode SS | |||
|---|---|---|---|
| Quadrant | BADHDUFLAG | Total packets | Discarded packets |
| A | 0 | 84 | 0 |
| B | 0 | 84 | 0 |
| C | 0 | 84 | 0 |
| D | 0 | 84 | 0 |
| Quadrant | Total seconds | Saturated seconds | Saturation percentage |
|---|---|---|---|
| A | 4096 | 61 | 1.489258% |
| B | 4096 | 156 | 3.808594% |
| C | 4096 | 361 | 8.813477% |
| D | 4096 | 108 | 2.636719% |
Noise dominated data is calculated using 1-second bins in cleaned event files. If a bin has >2000 counts, and if more than 50% of those come from <1% of pixels, then it is considered to be noise-dominated and hence unusable.
| Quadrant | # 1 sec bins | Bins with >0 counts | Bins with >2000 counts | High rate bins dominated by noise | Noise dominated (total time) | Noise dominated (detector-on time) | Marked lightcurve |
|---|---|---|---|---|---|---|---|
| A | 5376 | 4097 | 0 | 0 | 0.00% | 0.00% | 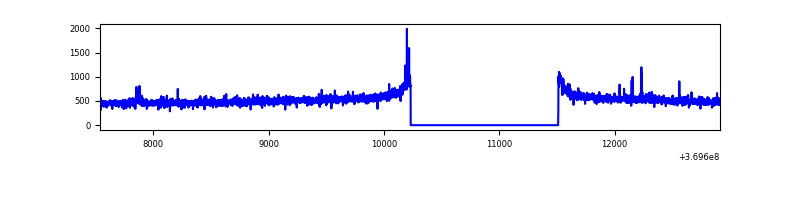 |
| B | 5376 | 4097 | 1 | 1 | 0.02% | 0.02% | 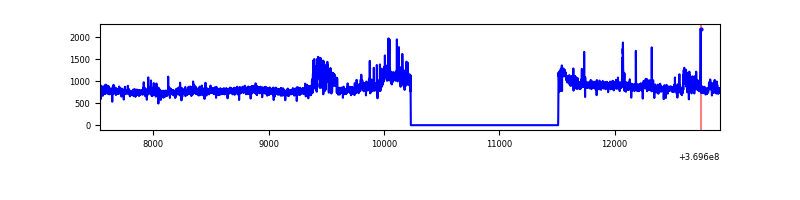 |
| C | 5376 | 4097 | 96 | 96 | 1.79% | 2.34% | 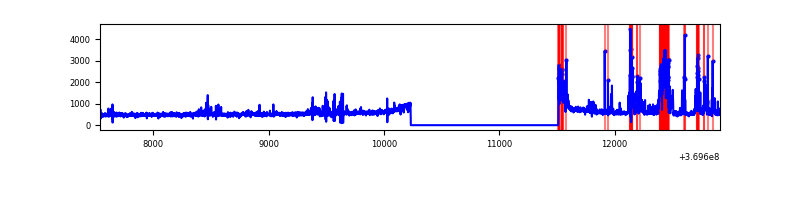 |
| D | 5376 | 4097 | 40 | 40 | 0.74% | 0.98% | 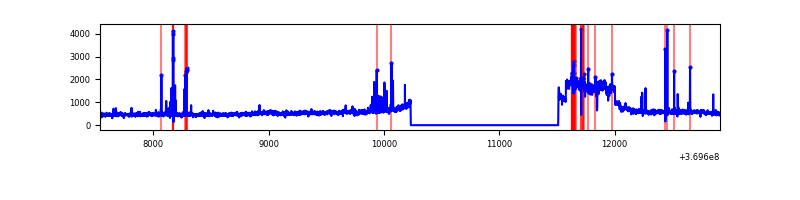 |
Top three noisy pixels from each quadrant. If the there are fewer than three noisy pixels in the level2.evt file, extra rows are filled as -1
| Pixel properties | Quadrant properties | ||||||
|---|---|---|---|---|---|---|---|
| Quadrant | DetID | PixID | Counts | Sigma | Mean | Median | Sigma |
| A | 12 | 96 | 27481 | 244.14 | 550 | 539 | 110.4 |
| A | 13 | 254 | 7812 | 65.91 | 550 | 539 | 110.4 |
| A | 3 | 137 | 5443 | 44.44 | 550 | 539 | 110.4 |
| B | 6 | 159 | 1142406 | 10934.11 | 545 | 532 | 104.4 |
| B | 0 | 190 | 145781 | 1390.84 | 545 | 532 | 104.4 |
| B | 0 | 168 | 45385 | 429.49 | 545 | 532 | 104.4 |
| C | 15 | 208 | 384811 | 3229.23 | 512 | 516 | 119.0 |
| C | 14 | 238 | 123212 | 1031.01 | 512 | 516 | 119.0 |
| C | 0 | 10 | 79407 | 662.92 | 512 | 516 | 119.0 |
| D | 8 | 195 | 696439 | 5577.63 | 525 | 512 | 124.8 |
| D | 2 | 250 | 50014 | 396.74 | 525 | 512 | 124.8 |
| D | 12 | 233 | 40067 | 317.02 | 525 | 512 | 124.8 |
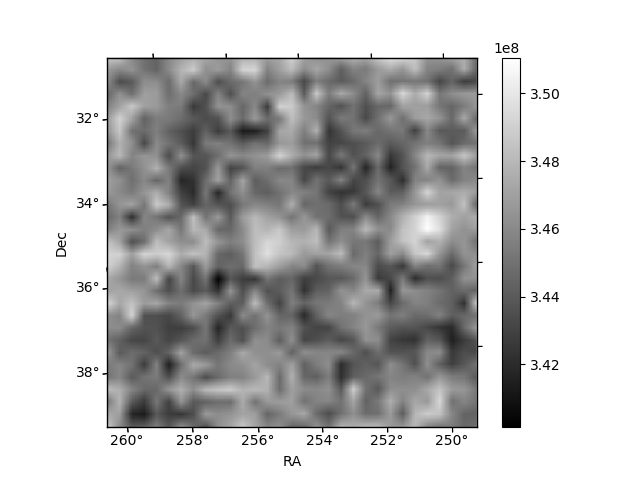
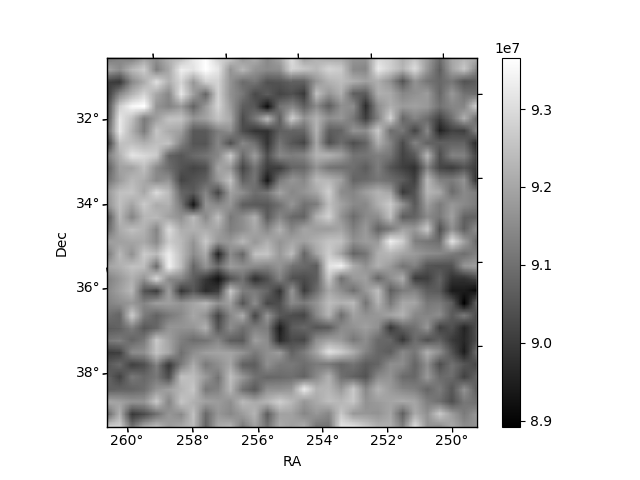
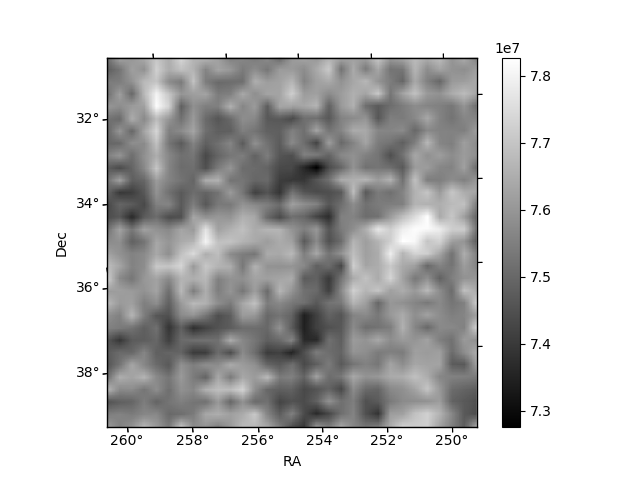
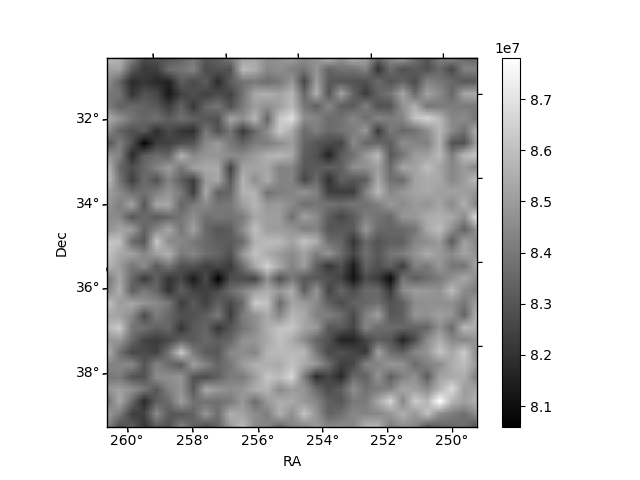
Histogram calculated using DETX and DETY for each event in the final _common_clean file
| Quadrant A | 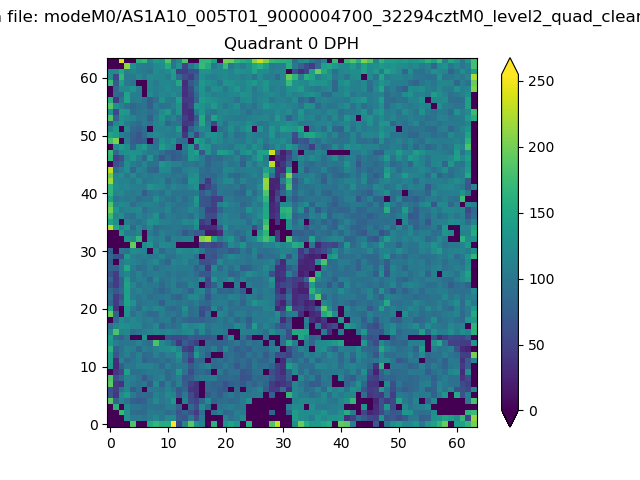 |
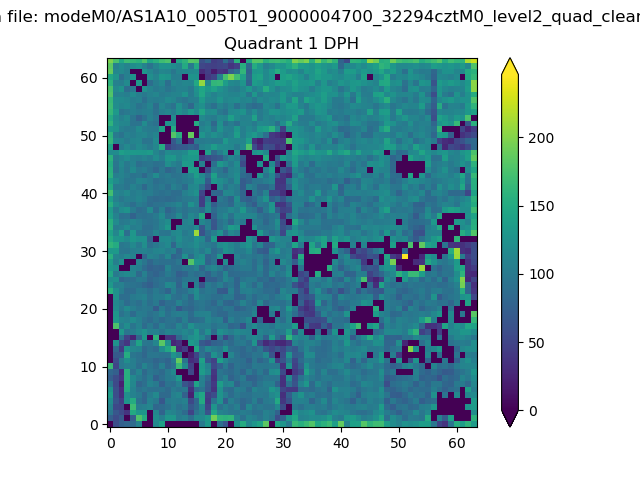 |
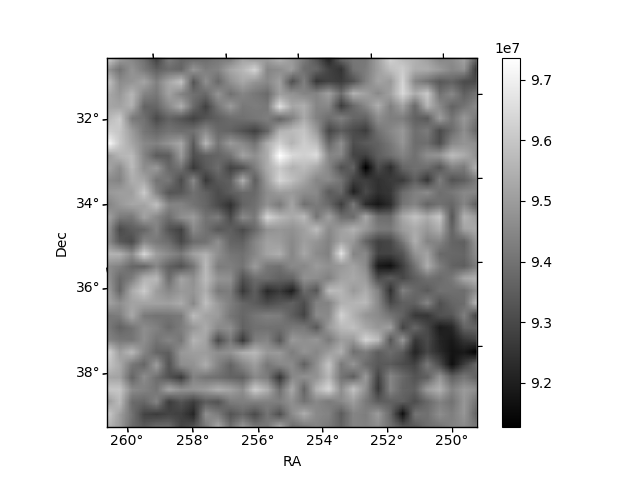
Quadrant B |
|---|---|---|---|
| Quadrant D | 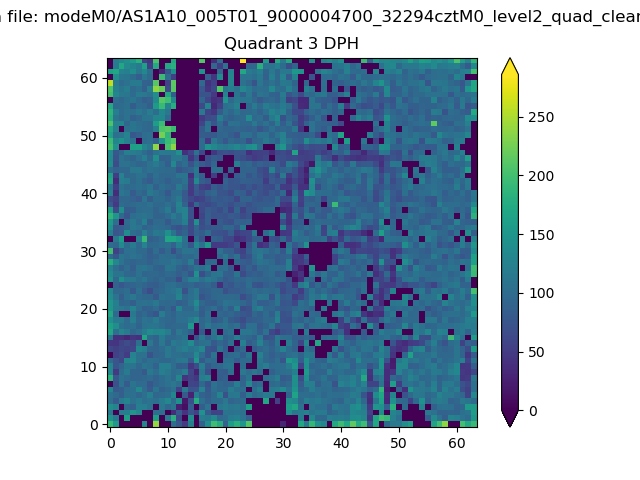 |
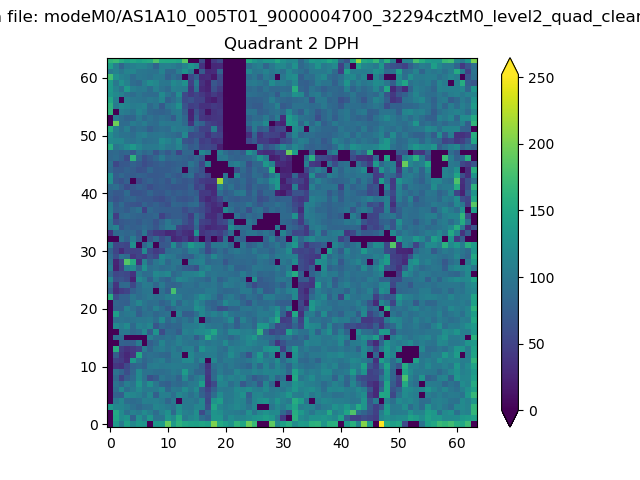 |
Quadrant C |
| Plot type | Count rate plots | Images |
|---|---|---|
| Comparison with Poisson distribution Blue bars denote a histogram of data divided into 1 sec bins. Red curve is a Poisson curve with rate = median count rate of data. |
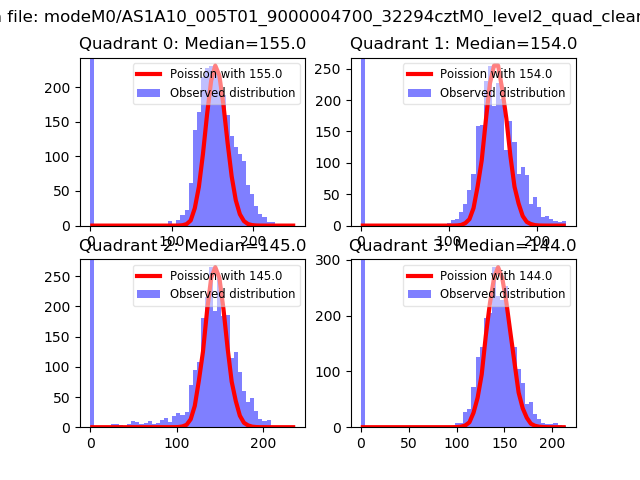 |
 |
| Quadrant-wise count rates Data is divided into 100 sec bins |
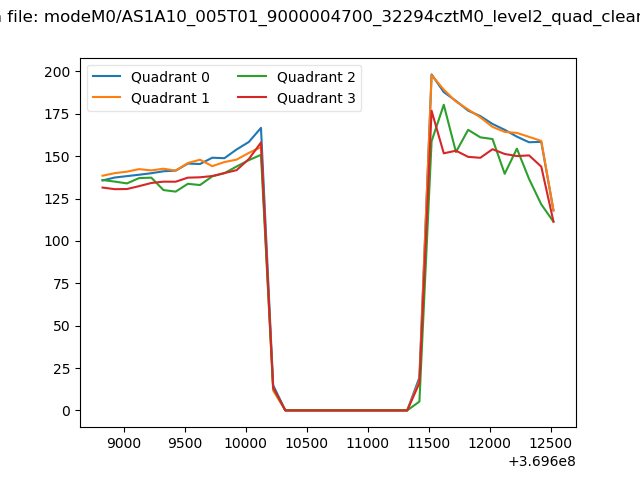 |
|
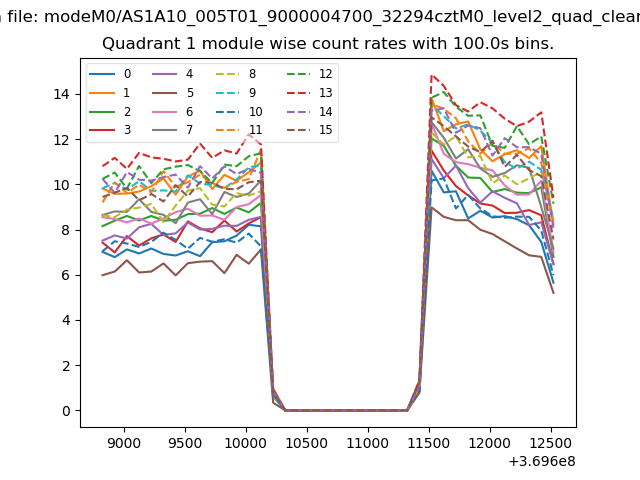
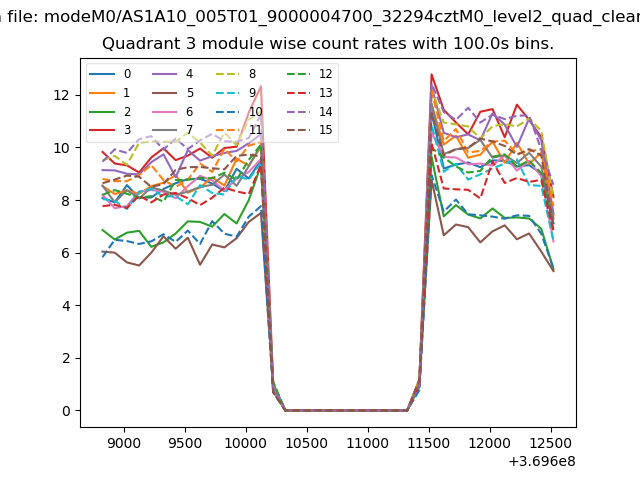
| Module-wise count rates for Quadrant A Data is divided into 100 sec bins |
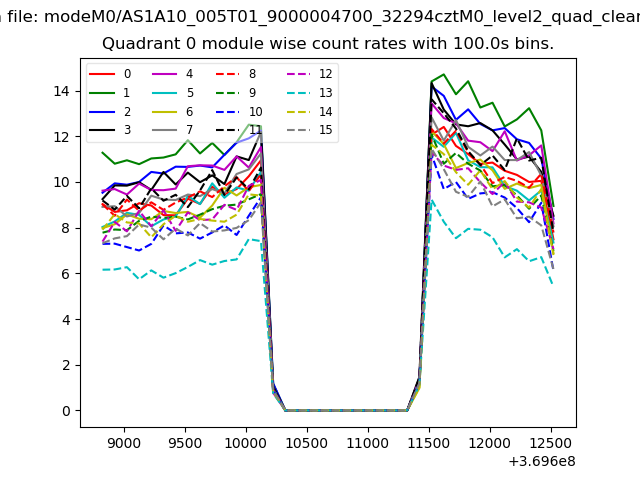 |
 |
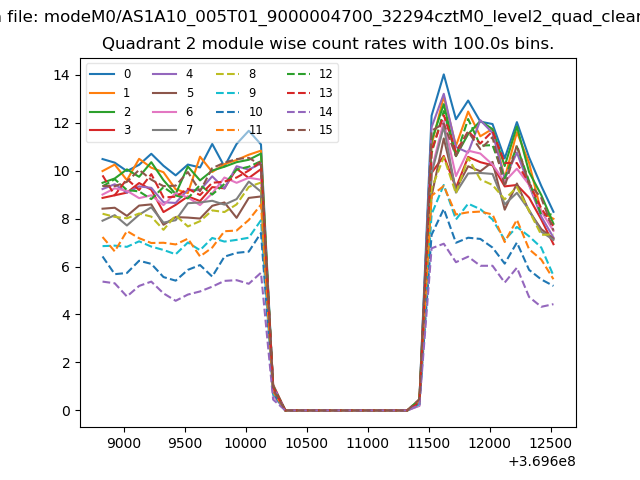
| Module-wise count rates for Quadrant B Data is divided into 100 sec bins |
 |
 |
| Module-wise count rates for Quadrant C Data is divided into 100 sec bins |
 |
 |
| Module-wise count rates for Quadrant D Data is divided into 100 sec bins |
 |
 |
| Parameter | Plot |
|---|---|
| CZT HV Monitor | 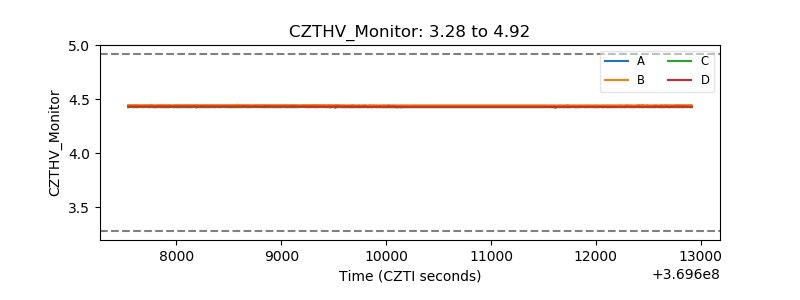 |
| D_VDD | 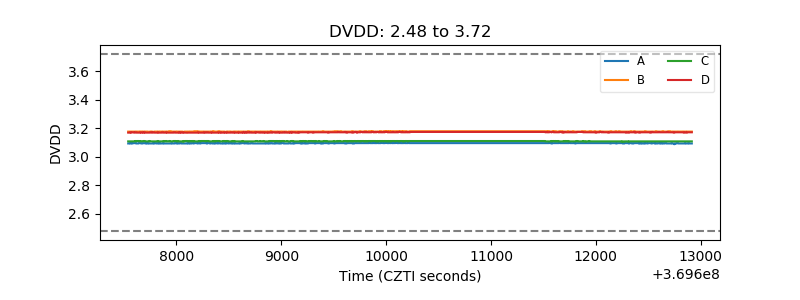 |
| Temperature 1 | 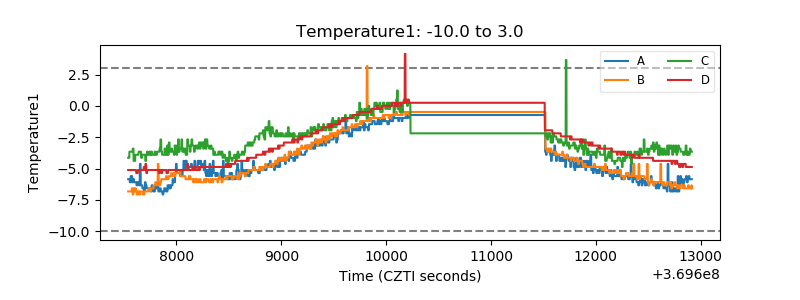 |
| Veto HV Monitor |  |
| Veto LLD | 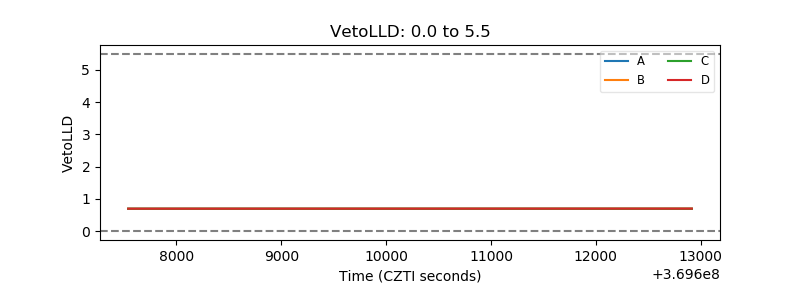 |
| Alpha Counter | 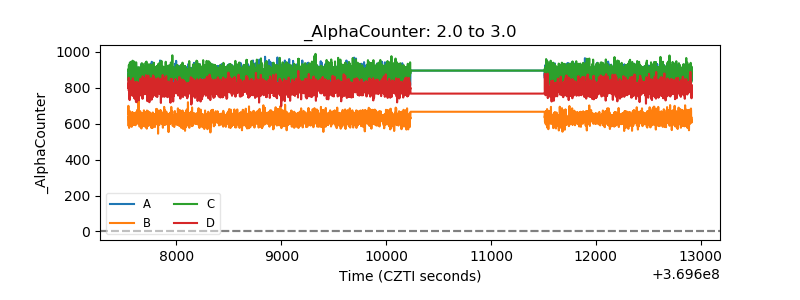 |
| _CPM_Rate | 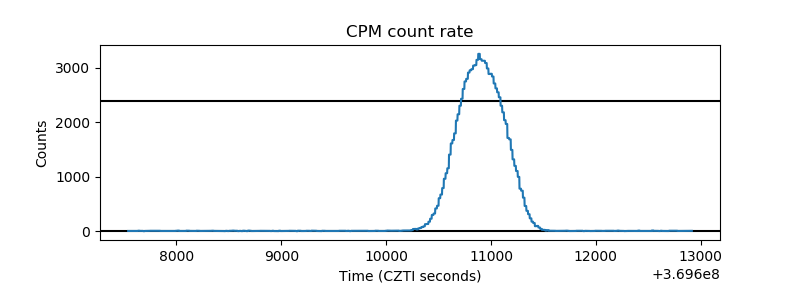 |
| CZT Counter | 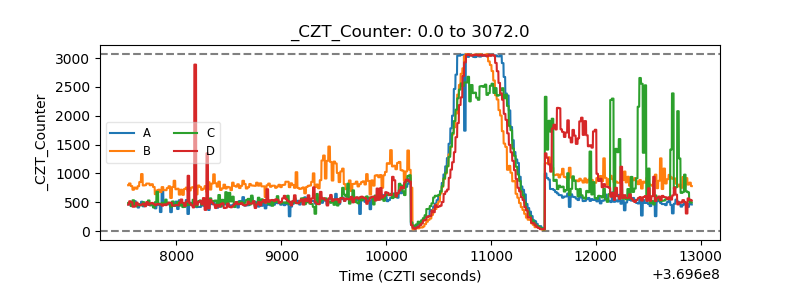 |
| +2.5 Volts monitor |  |
| +5 Volts monitor |  |
| _ROLL_ROT | 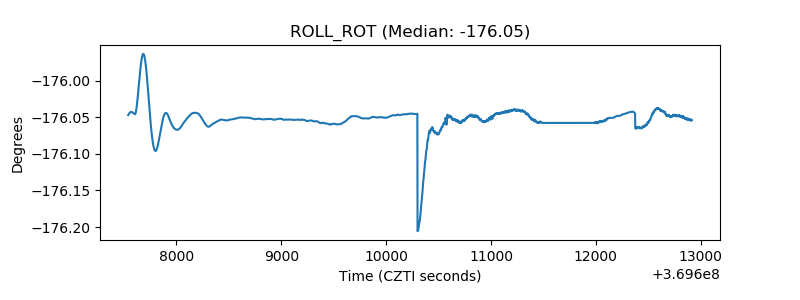 |
| _Roll_DEC | 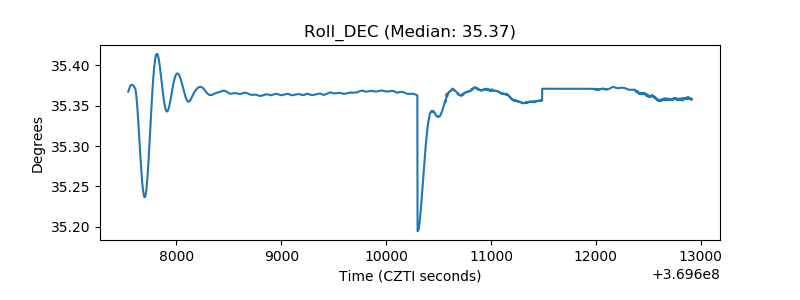 |
| _Roll_RA | 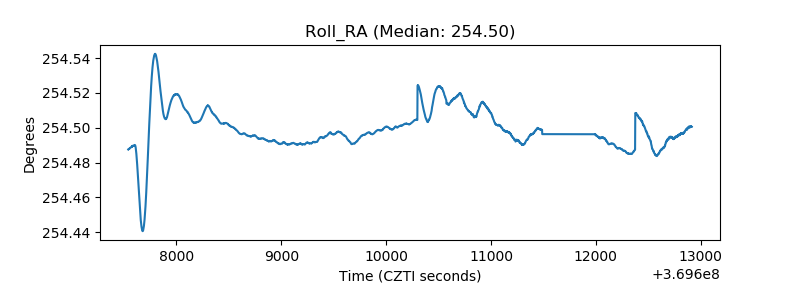 |
| Veto Counter | 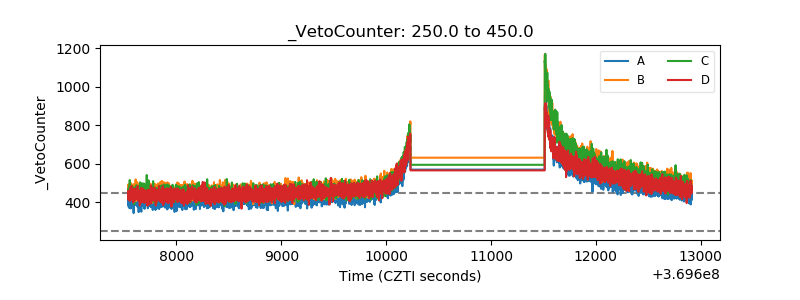 |