| Param | Original file | Final file |
|---|---|---|
| Filename | modeM0/AS1A10_005T01_9000004700_32297cztM0_level2.evt | modeM0/AS1A10_005T01_9000004700_32297cztM0_level2_quad_clean.evt |
| Size (bytes) | 643,671,360 | 76,573,440 |
| Size | 613.9 MB | 73.0 MB |
| Events in quadrant A | 3,439,520 | 483,345 |
| Events in quadrant B | 5,568,153 | 466,897 |
| Events in quadrant C | 3,943,284 | 446,751 |
| Events in quadrant D | 6,071,734 | 435,897 |
| Mode M0 | |||
|---|---|---|---|
| Quadrant | BADHDUFLAG | Total packets | Discarded packets |
| A | 0 | 14576 | 3 |
| B | 0 | 21522 | 2 |
| C | 0 | 16018 | 2 |
| D | 0 | 22968 | 2 |
| Mode M9 | |||
|---|---|---|---|
| Quadrant | BADHDUFLAG | Total packets | Discarded packets |
| A | 0 | 13 | 0 |
| B | 0 | 13 | 0 |
| C | 0 | 13 | 0 |
| D | 0 | 14 | 0 |
| Mode SS | |||
|---|---|---|---|
| Quadrant | BADHDUFLAG | Total packets | Discarded packets |
| A | 0 | 142 | 0 |
| B | 0 | 142 | 0 |
| C | 0 | 142 | 0 |
| D | 0 | 142 | 0 |
| Quadrant | Total seconds | Saturated seconds | Saturation percentage |
|---|---|---|---|
| A | 6971 | 84 | 1.204992% |
| B | 6971 | 198 | 2.840339% |
| C | 6971 | 154 | 2.209152% |
| D | 6971 | 153 | 2.194807% |
Noise dominated data is calculated using 1-second bins in cleaned event files. If a bin has >2000 counts, and if more than 50% of those come from <1% of pixels, then it is considered to be noise-dominated and hence unusable.
| Quadrant | # 1 sec bins | Bins with >0 counts | Bins with >2000 counts | High rate bins dominated by noise | Noise dominated (total time) | Noise dominated (detector-on time) | Marked lightcurve |
|---|---|---|---|---|---|---|---|
| A | 7691 | 6972 | 15 | 15 | 0.20% | 0.22% | 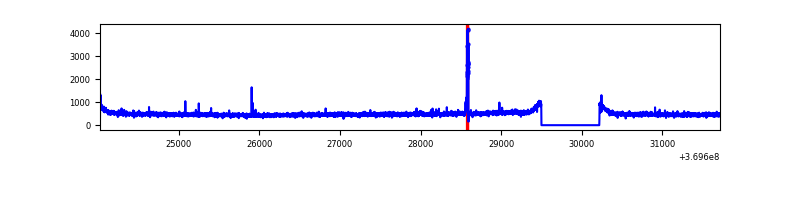 |
| B | 7691 | 6972 | 24 | 24 | 0.31% | 0.34% | 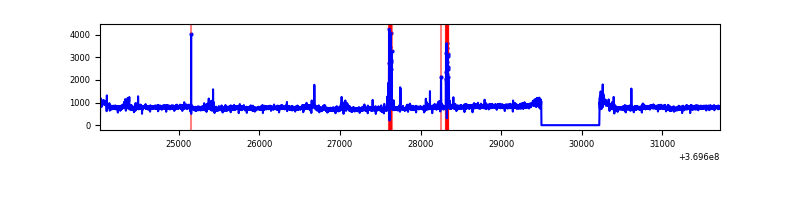 |
| C | 7691 | 6972 | 14 | 14 | 0.18% | 0.20% | 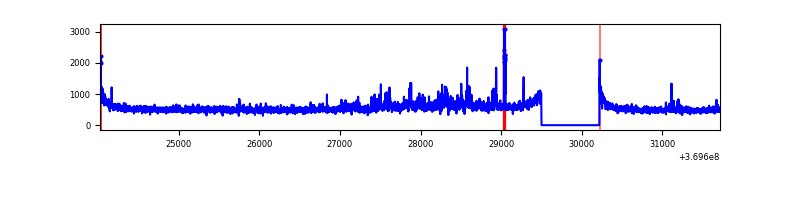 |
| D | 7691 | 6972 | 70 | 70 | 0.91% | 1.00% |  |
Top three noisy pixels from each quadrant. If the there are fewer than three noisy pixels in the level2.evt file, extra rows are filled as -1
| Pixel properties | Quadrant properties | ||||||
|---|---|---|---|---|---|---|---|
| Quadrant | DetID | PixID | Counts | Sigma | Mean | Median | Sigma |
| A | 0 | 6 | 51670 | 292.86 | 867 | 849 | 173.5 |
| A | 13 | 6 | 18351 | 100.86 | 867 | 849 | 173.5 |
| A | 13 | 254 | 17216 | 94.32 | 867 | 849 | 173.5 |
| B | 6 | 159 | 1978189 | 12030.31 | 856 | 835 | 164.4 |
| B | 5 | 172 | 104384 | 630.0 | 856 | 835 | 164.4 |
| B | 0 | 190 | 64358 | 386.48 | 856 | 835 | 164.4 |
| C | 3 | 233 | 468186 | 2387.01 | 830 | 835 | 195.8 |
| C | 14 | 238 | 136845 | 694.67 | 830 | 835 | 195.8 |
| C | 0 | 10 | 44519 | 223.12 | 830 | 835 | 195.8 |
| D | 8 | 195 | 2549487 | 12634.85 | 834 | 810 | 201.7 |
| D | 12 | 233 | 129981 | 640.35 | 834 | 810 | 201.7 |
| D | 13 | 249 | 105969 | 521.32 | 834 | 810 | 201.7 |
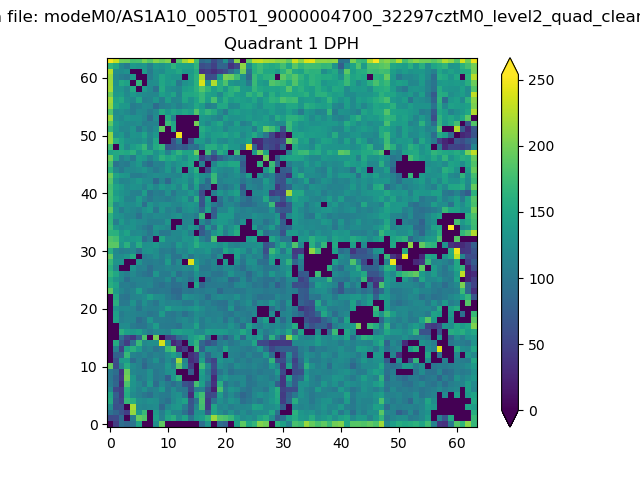
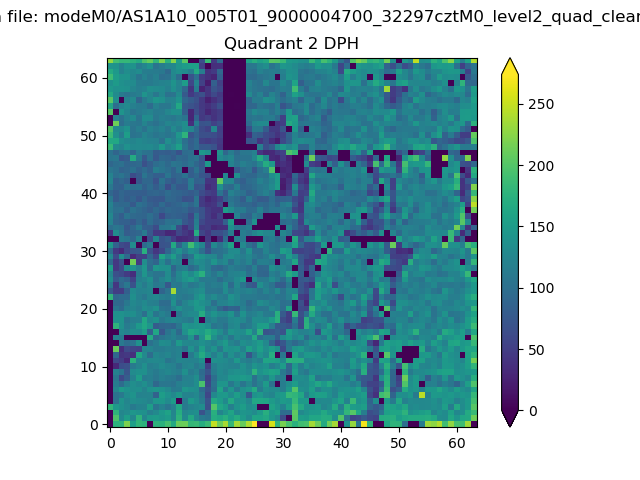
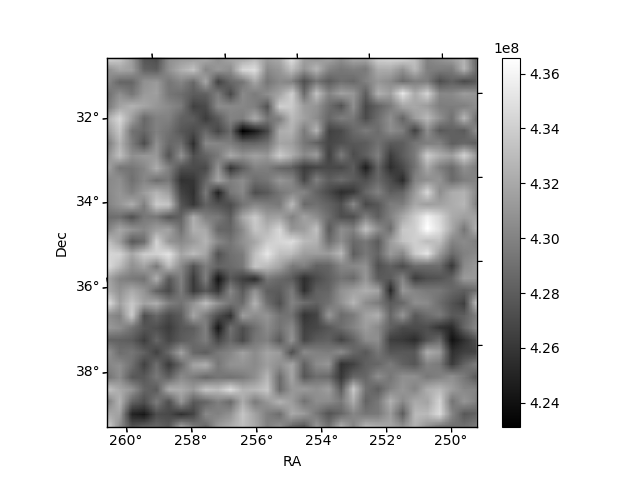
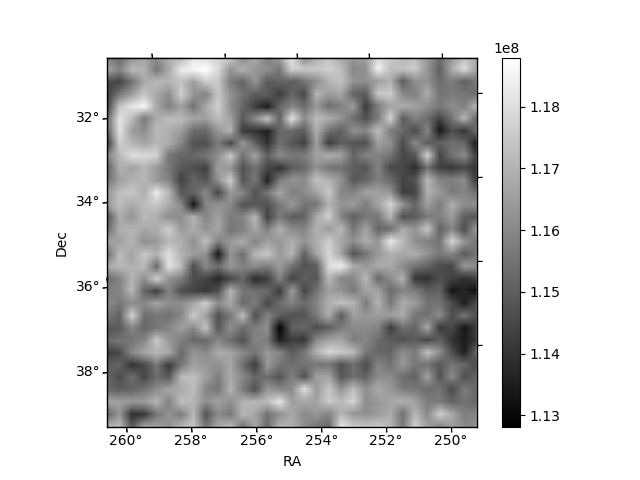
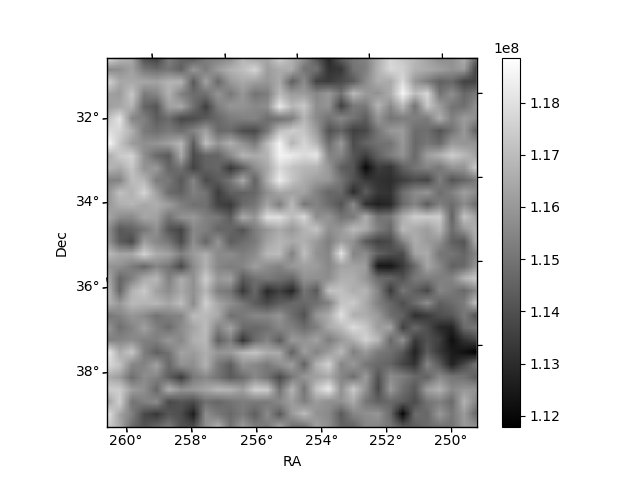
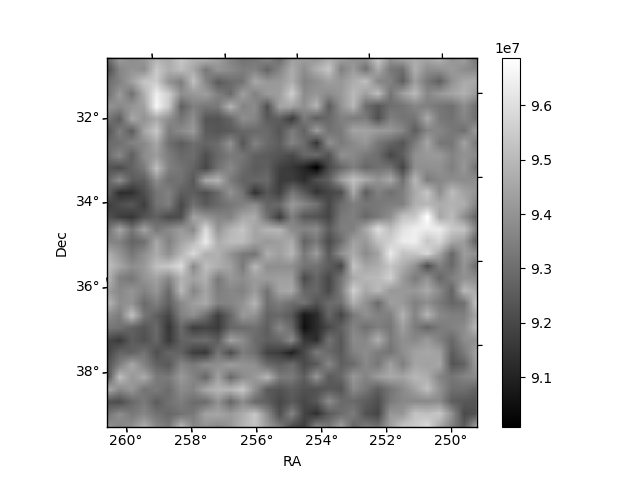
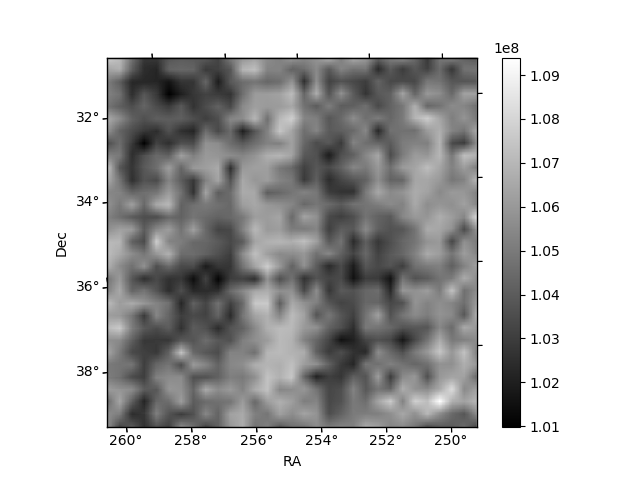
Histogram calculated using DETX and DETY for each event in the final _common_clean file
| Quadrant A | 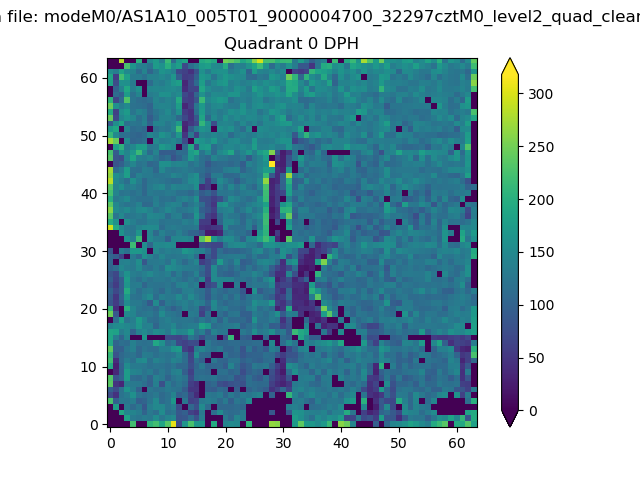 |
 |
Quadrant B |
|---|---|---|---|
| Quadrant D | 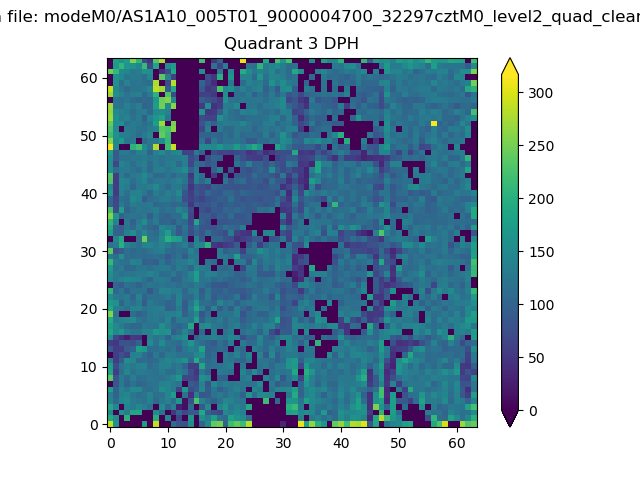 |
 |
Quadrant C |
| Plot type | Count rate plots | Images |
|---|---|---|
| Comparison with Poisson distribution Blue bars denote a histogram of data divided into 1 sec bins. Red curve is a Poisson curve with rate = median count rate of data. |
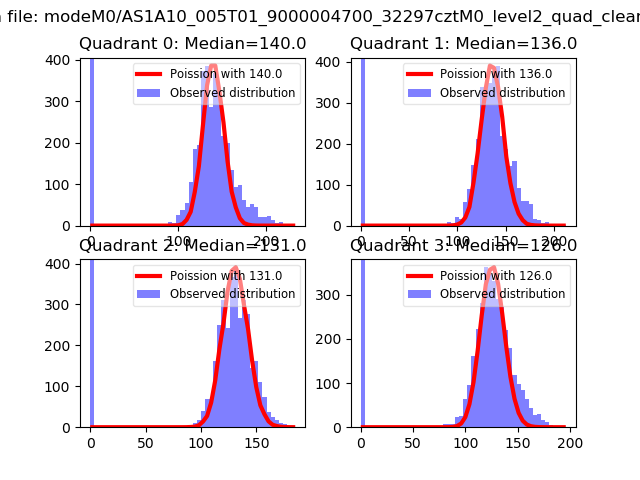 |
 |
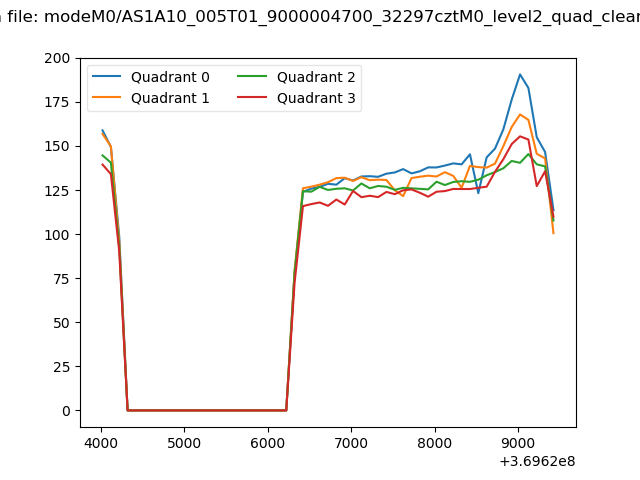
| Quadrant-wise count rates Data is divided into 100 sec bins |
 |
|
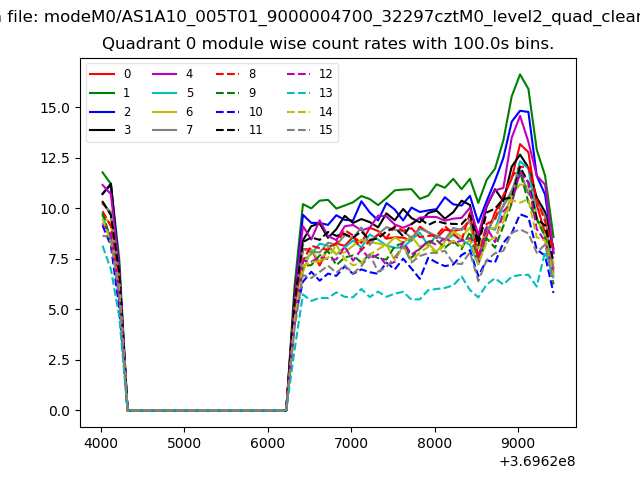
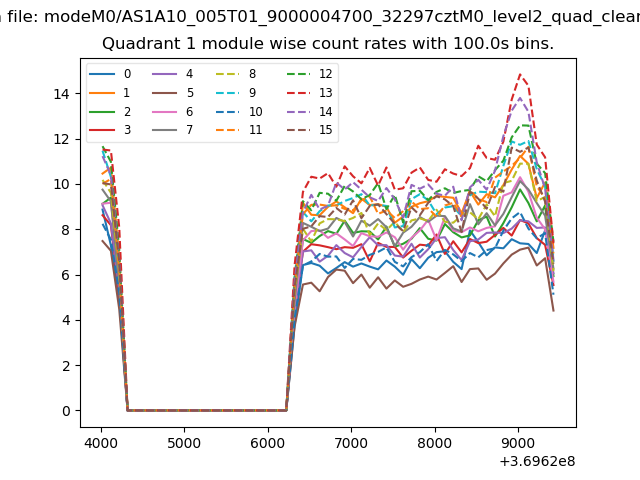
| Module-wise count rates for Quadrant A Data is divided into 100 sec bins |
 |
 |
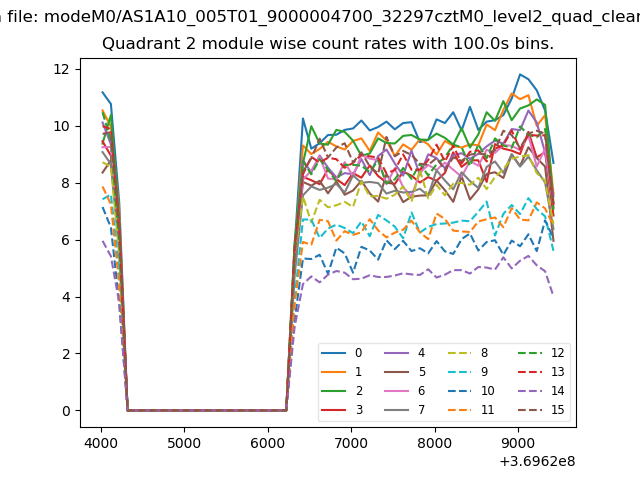
| Module-wise count rates for Quadrant B Data is divided into 100 sec bins |
 |
 |
| Module-wise count rates for Quadrant C Data is divided into 100 sec bins |
 |
 |
| Module-wise count rates for Quadrant D Data is divided into 100 sec bins |
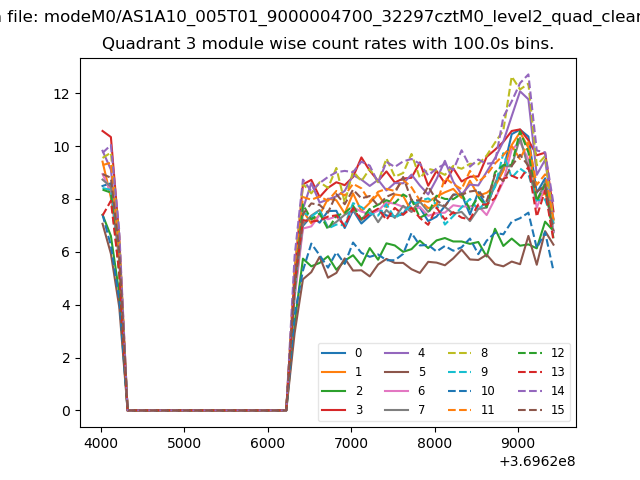 |
 |
| Parameter | Plot |
|---|---|
| CZT HV Monitor | 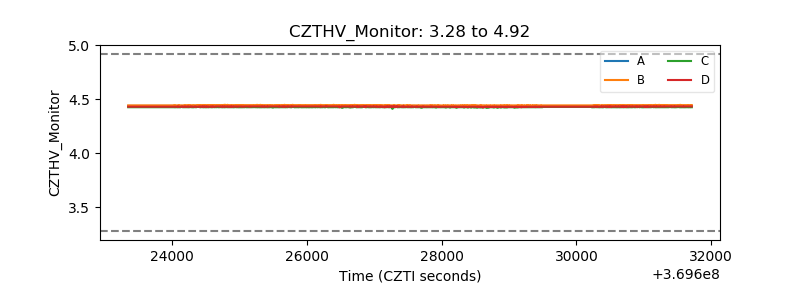 |
| D_VDD | 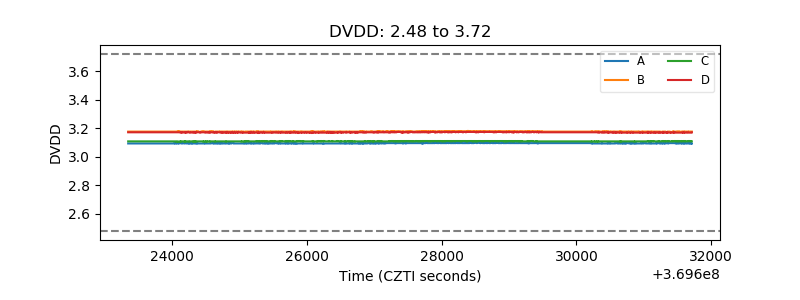 |
| Temperature 1 | 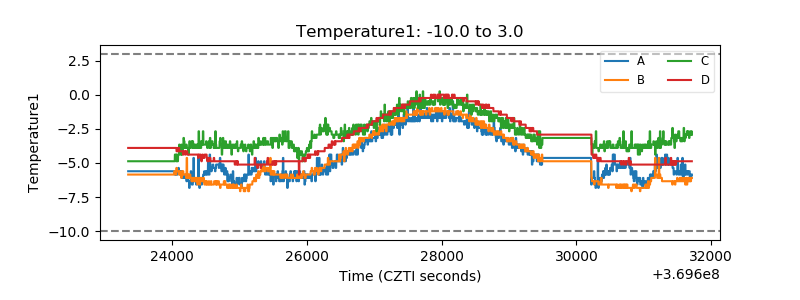 |
| Veto HV Monitor | 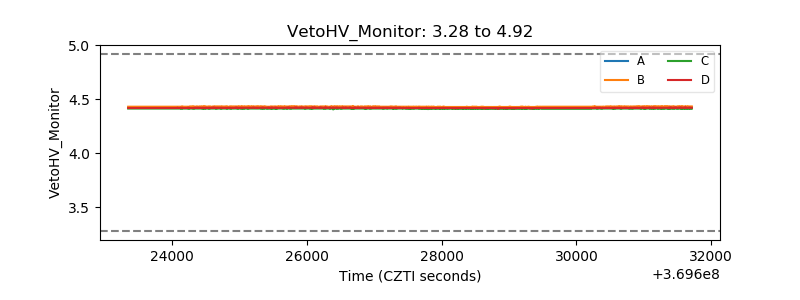 |
| Veto LLD | 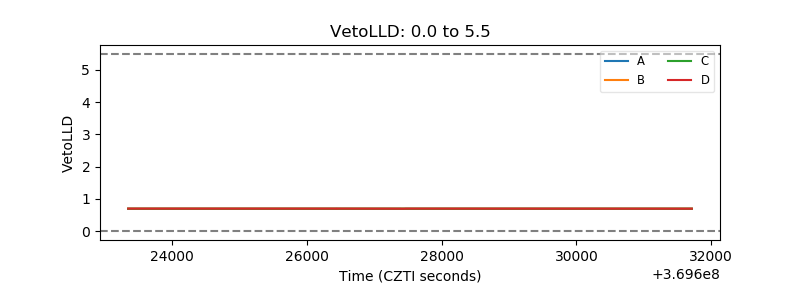 |
| Alpha Counter | 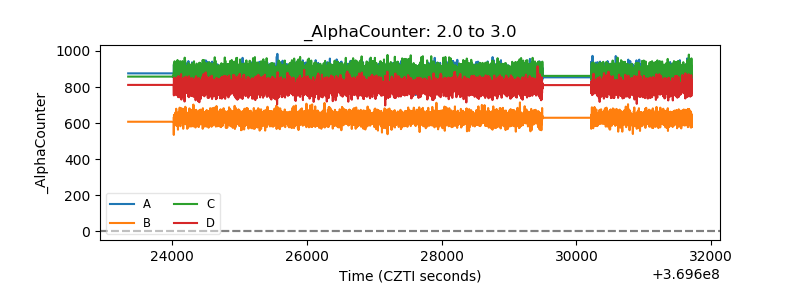 |
| _CPM_Rate | 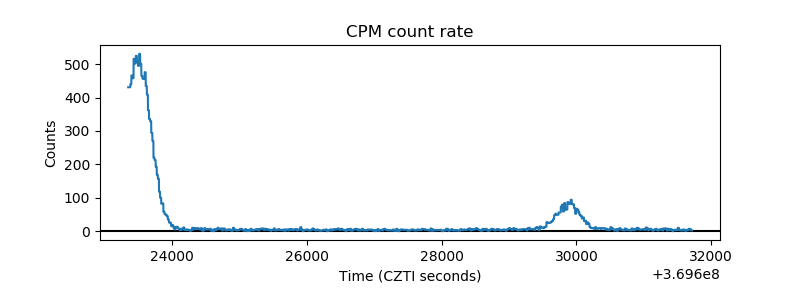 |
| CZT Counter | 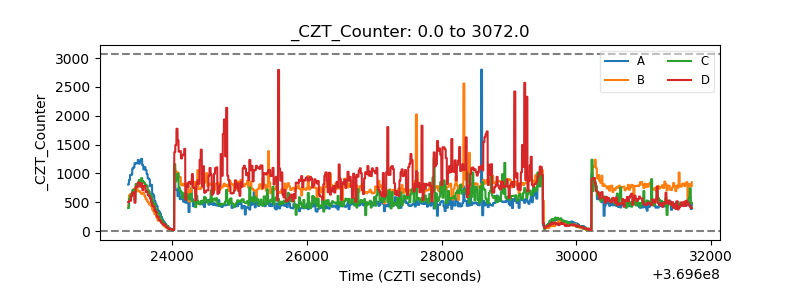 |
| +2.5 Volts monitor |  |
| +5 Volts monitor |  |
| _ROLL_ROT | 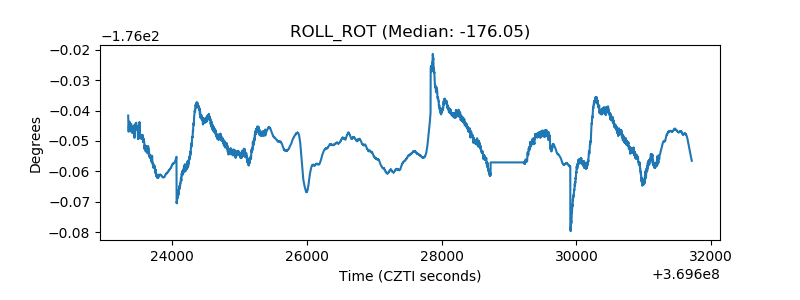 |
| _Roll_DEC | 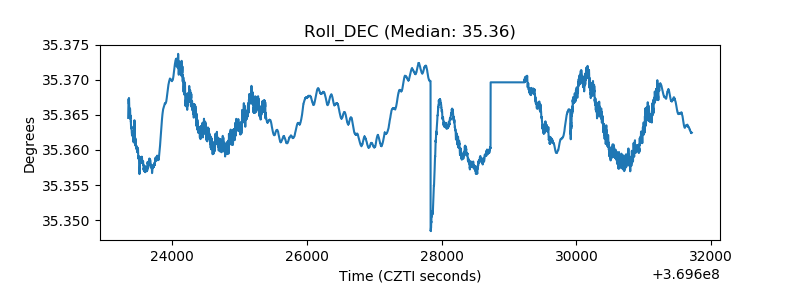 |
| _Roll_RA | 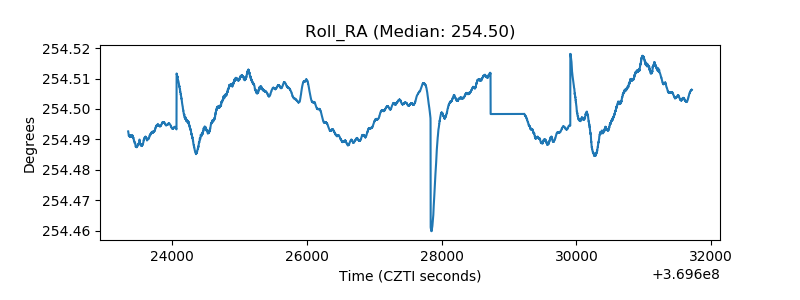 |
| Veto Counter | 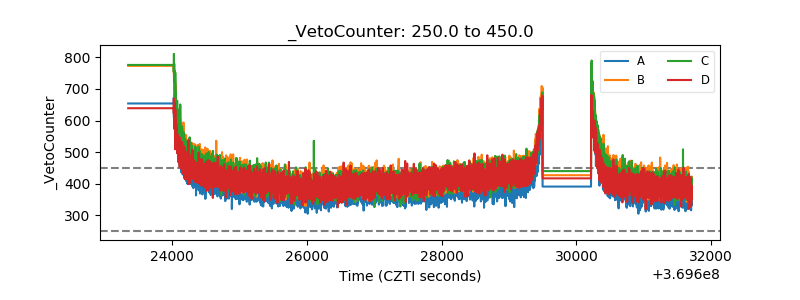 |