| Param | Original file | Final file |
|---|---|---|
| Filename | modeM0/AS1A10_005T01_9000004700_32298cztM0_level2.evt | modeM0/AS1A10_005T01_9000004700_32298cztM0_level2_quad_clean.evt |
| Size (bytes) | 682,116,480 | 86,397,120 |
| Size | 650.5 MB | 82.4 MB |
| Events in quadrant A | 3,821,281 | 543,679 |
| Events in quadrant B | 6,148,508 | 529,575 |
| Events in quadrant C | 4,249,135 | 511,656 |
| Events in quadrant D | 5,911,180 | 488,405 |
| Mode M0 | |||
|---|---|---|---|
| Quadrant | BADHDUFLAG | Total packets | Discarded packets |
| A | 0 | 16320 | 3 |
| B | 0 | 23964 | 2 |
| C | 0 | 17299 | 2 |
| D | 0 | 23000 | 2 |
| Mode M9 | |||
|---|---|---|---|
| Quadrant | BADHDUFLAG | Total packets | Discarded packets |
| A | 0 | 10 | 0 |
| B | 0 | 10 | 0 |
| C | 0 | 10 | 0 |
| D | 0 | 10 | 0 |
| Mode SS | |||
|---|---|---|---|
| Quadrant | BADHDUFLAG | Total packets | Discarded packets |
| A | 0 | 162 | 0 |
| B | 0 | 162 | 0 |
| C | 0 | 162 | 0 |
| D | 0 | 162 | 0 |
| Quadrant | Total seconds | Saturated seconds | Saturation percentage |
|---|---|---|---|
| A | 7798 | 183 | 2.346756% |
| B | 7798 | 346 | 4.437035% |
| C | 7798 | 268 | 3.436779% |
| D | 7798 | 449 | 5.757887% |
Noise dominated data is calculated using 1-second bins in cleaned event files. If a bin has >2000 counts, and if more than 50% of those come from <1% of pixels, then it is considered to be noise-dominated and hence unusable.
| Quadrant | # 1 sec bins | Bins with >0 counts | Bins with >2000 counts | High rate bins dominated by noise | Noise dominated (total time) | Noise dominated (detector-on time) | Marked lightcurve |
|---|---|---|---|---|---|---|---|
| A | 8828 | 7800 | 1 | 1 | 0.01% | 0.01% | 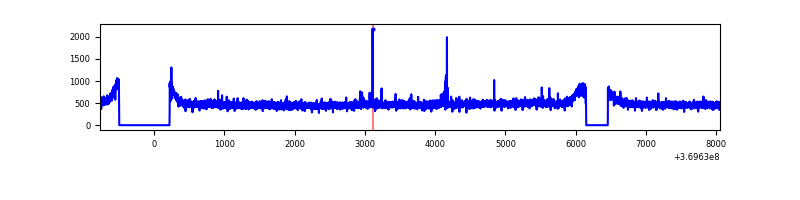 |
| B | 8828 | 7800 | 11 | 11 | 0.12% | 0.14% | 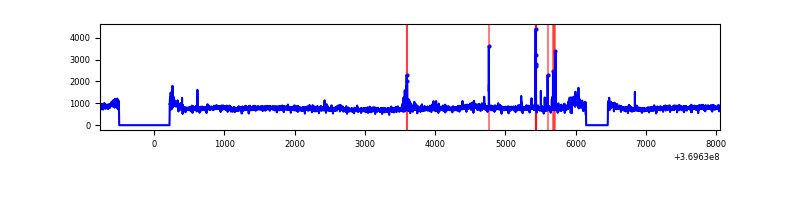 |
| C | 8828 | 7800 | 6 | 6 | 0.07% | 0.08% | 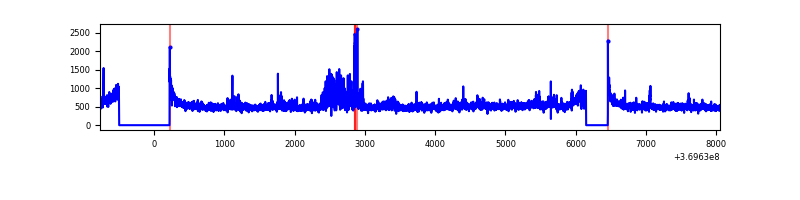 |
| D | 8828 | 7800 | 257 | 257 | 2.91% | 3.29% | 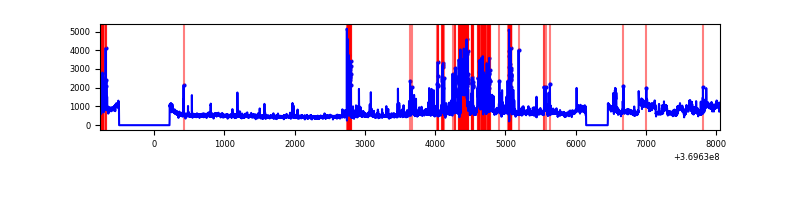 |
Top three noisy pixels from each quadrant. If the there are fewer than three noisy pixels in the level2.evt file, extra rows are filled as -1
| Pixel properties | Quadrant properties | ||||||
|---|---|---|---|---|---|---|---|
| Quadrant | DetID | PixID | Counts | Sigma | Mean | Median | Sigma |
| A | 0 | 6 | 21072 | 102.41 | 975 | 950 | 196.5 |
| A | 13 | 254 | 18732 | 90.5 | 975 | 950 | 196.5 |
| A | 12 | 96 | 16010 | 76.64 | 975 | 950 | 196.5 |
| B | 6 | 159 | 2158854 | 11614.93 | 958 | 931 | 185.8 |
| B | 0 | 190 | 80444 | 427.98 | 958 | 931 | 185.8 |
| B | 5 | 172 | 36710 | 192.58 | 958 | 931 | 185.8 |
| C | 3 | 233 | 209057 | 940.16 | 935 | 937 | 221.4 |
| C | 14 | 238 | 160055 | 718.8 | 935 | 937 | 221.4 |
| C | 15 | 159 | 142189 | 638.09 | 935 | 937 | 221.4 |
| D | 8 | 195 | 1241704 | 5524.94 | 931 | 902 | 224.6 |
| D | 10 | 199 | 488997 | 2173.35 | 931 | 902 | 224.6 |
| D | 13 | 174 | 370925 | 1647.61 | 931 | 902 | 224.6 |
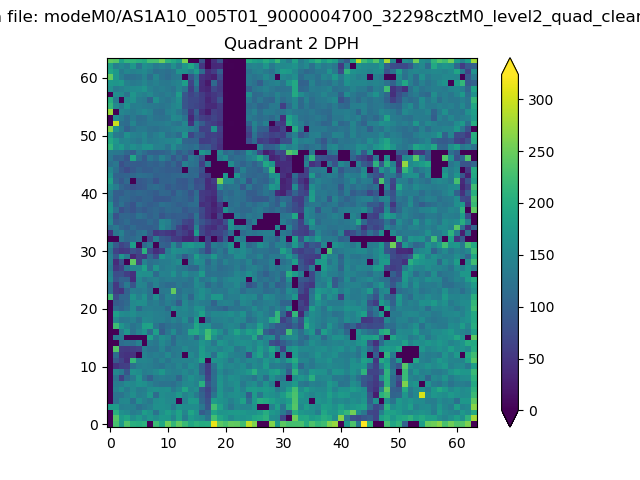
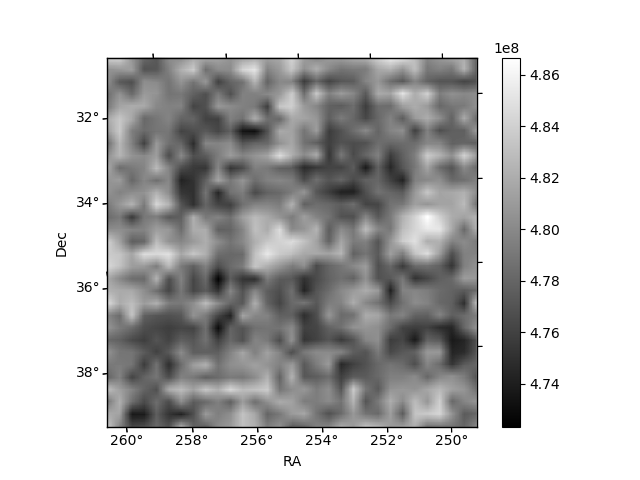
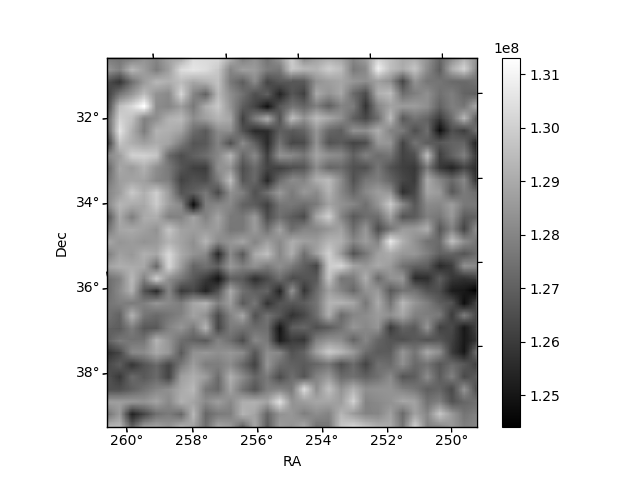
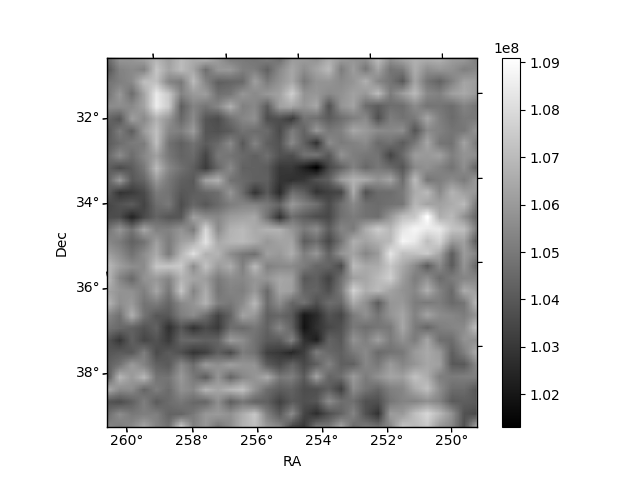
Histogram calculated using DETX and DETY for each event in the final _common_clean file
| Quadrant A | 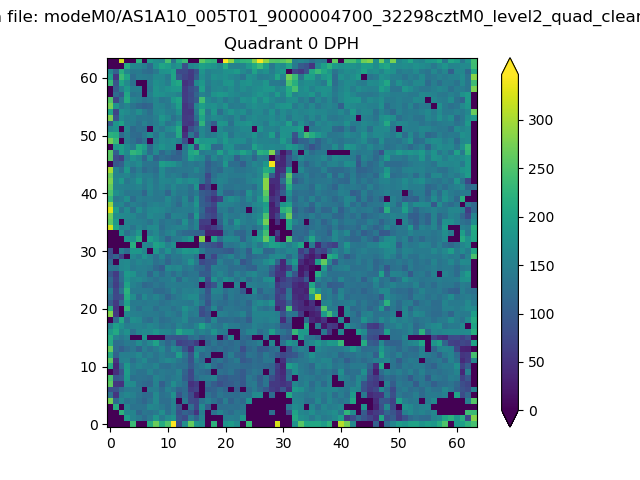 |
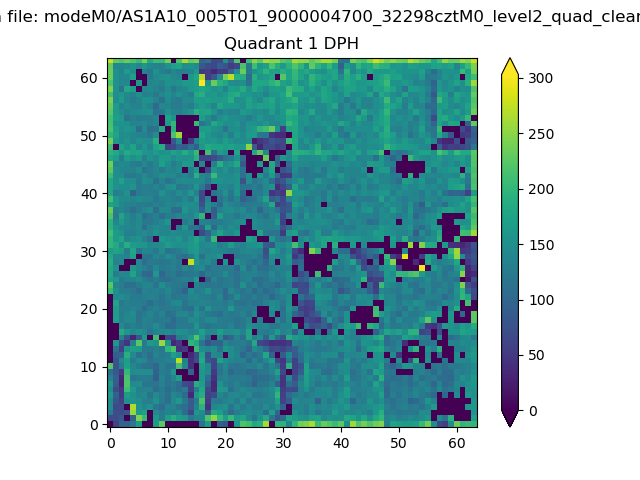 |
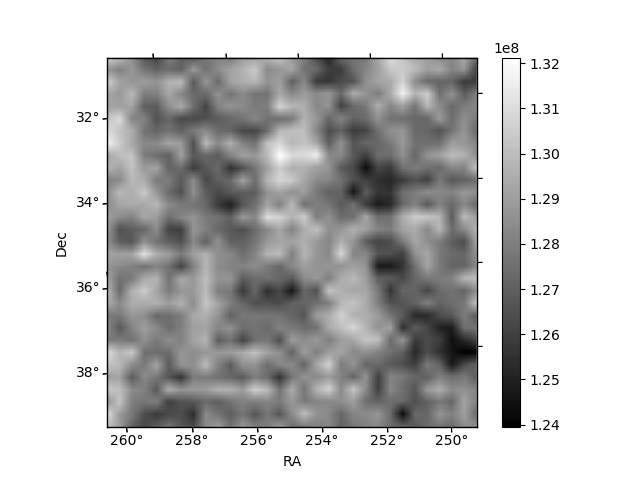
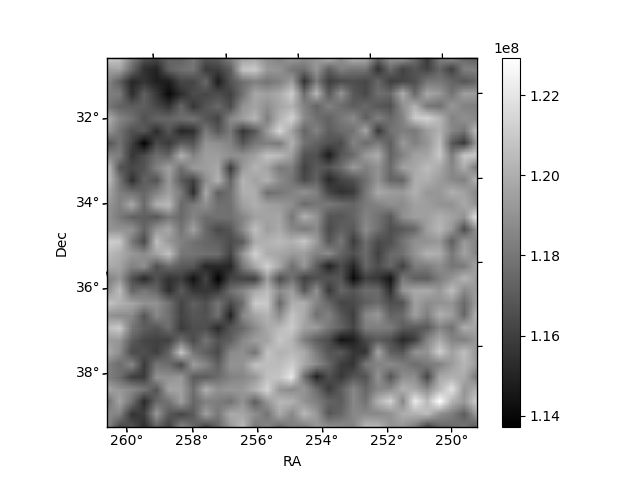
Quadrant B |
|---|---|---|---|
| Quadrant D | 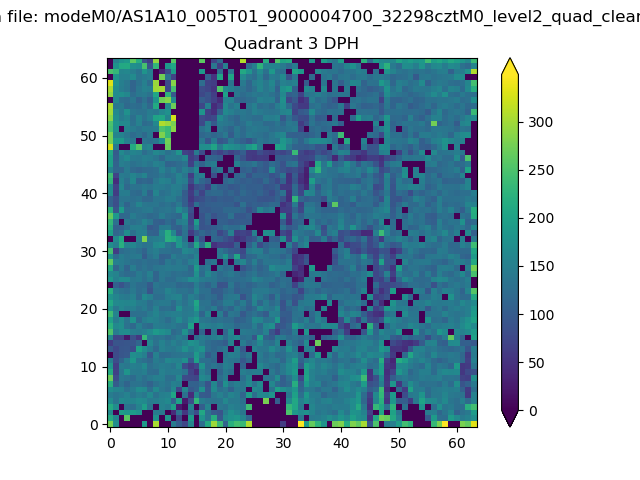 |
 |
Quadrant C |
| Plot type | Count rate plots | Images |
|---|---|---|
| Comparison with Poisson distribution Blue bars denote a histogram of data divided into 1 sec bins. Red curve is a Poisson curve with rate = median count rate of data. |
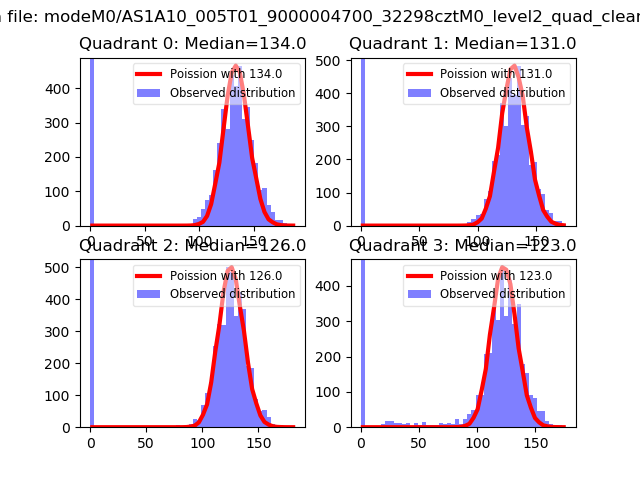 |
 |
| Quadrant-wise count rates Data is divided into 100 sec bins |
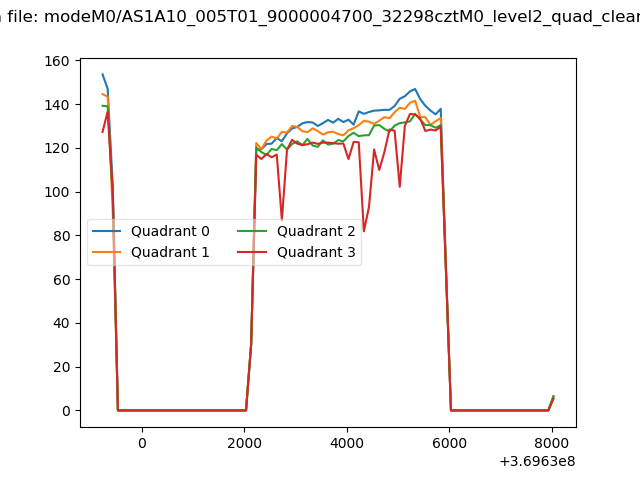 |
|
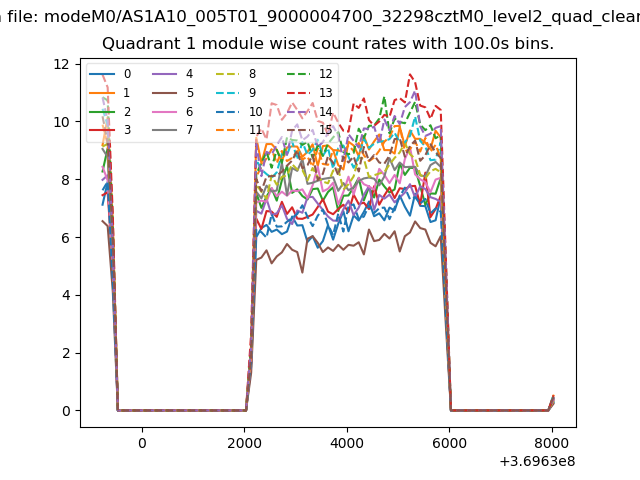
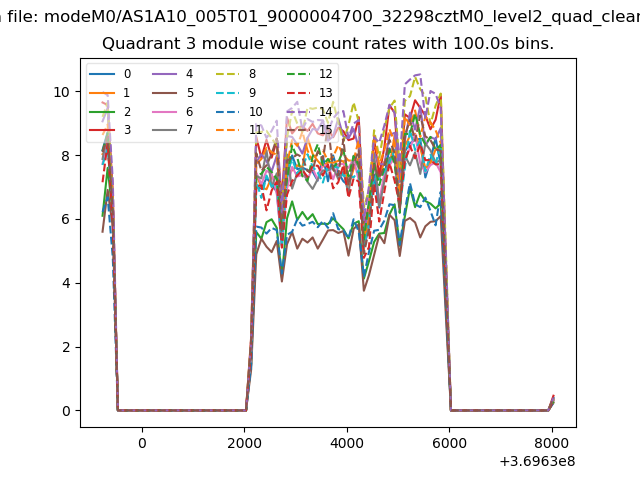
| Module-wise count rates for Quadrant A Data is divided into 100 sec bins |
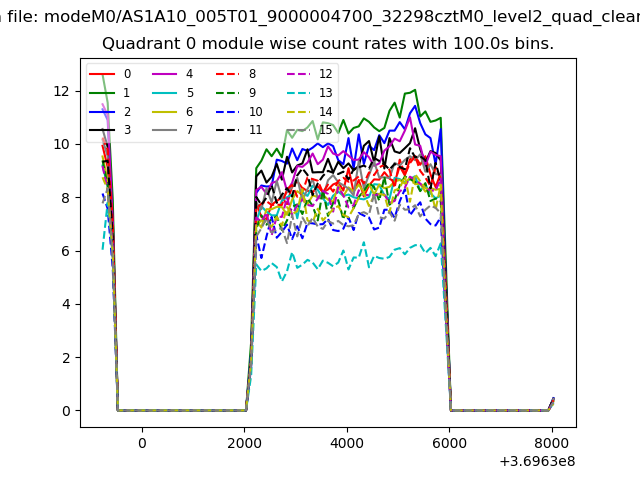 |
 |
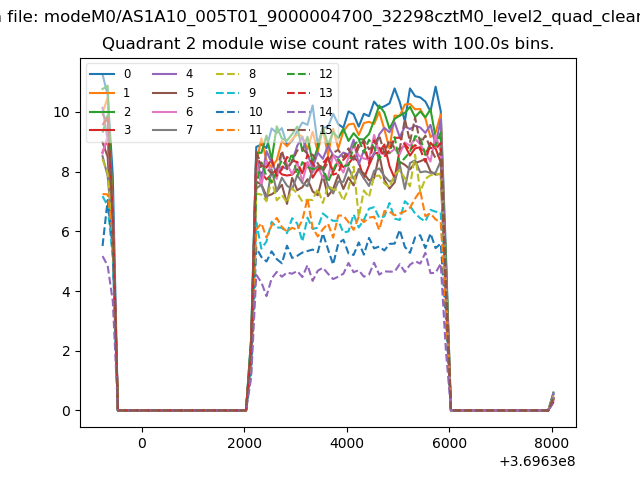
| Module-wise count rates for Quadrant B Data is divided into 100 sec bins |
 |
 |
| Module-wise count rates for Quadrant C Data is divided into 100 sec bins |
 |
 |
| Module-wise count rates for Quadrant D Data is divided into 100 sec bins |
 |
 |
| Parameter | Plot |
|---|---|
| CZT HV Monitor | 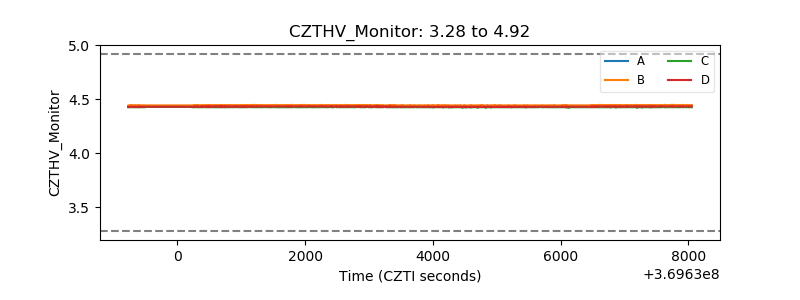 |
| D_VDD | 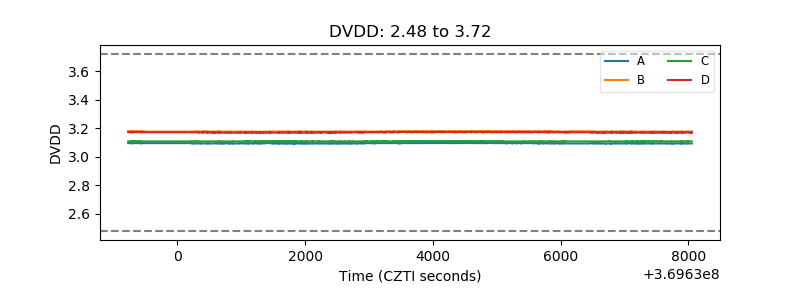 |
| Temperature 1 | 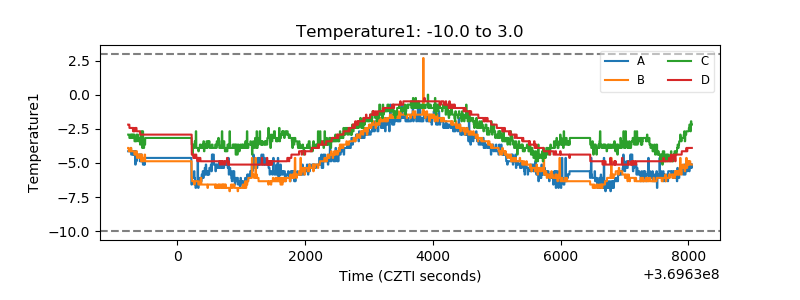 |
| Veto HV Monitor | 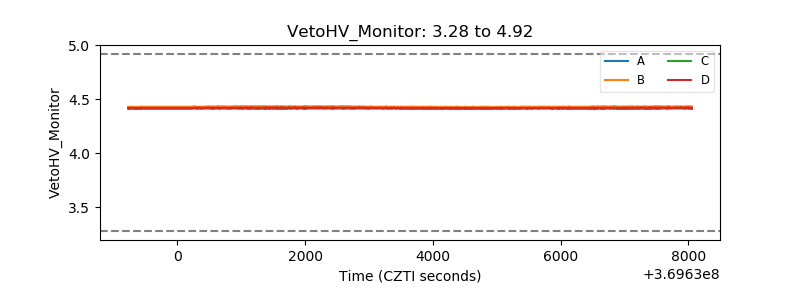 |
| Veto LLD |  |
| Alpha Counter | 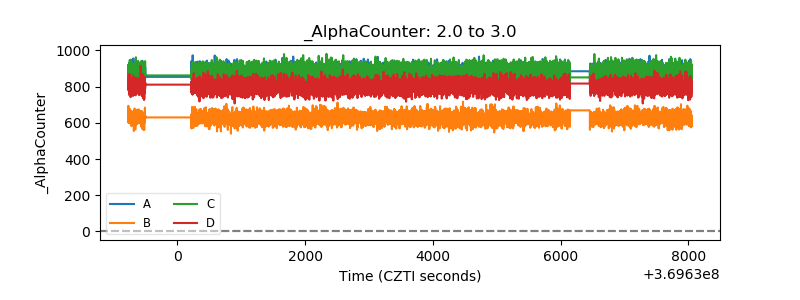 |
| _CPM_Rate | 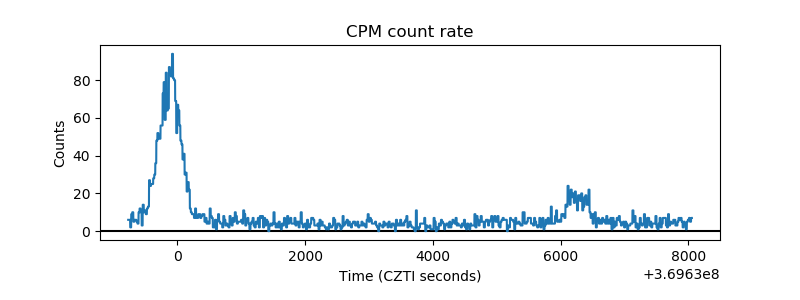 |
| CZT Counter | 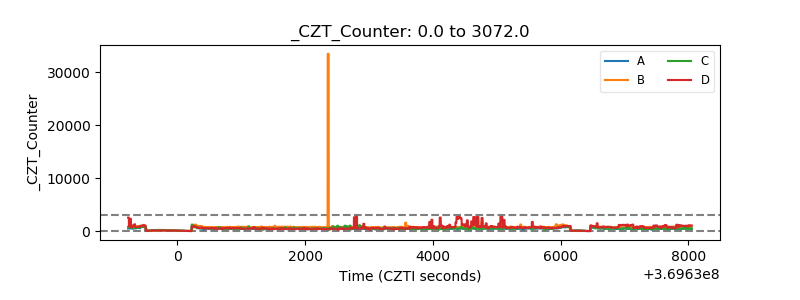 |
| +2.5 Volts monitor |  |
| +5 Volts monitor |  |
| _ROLL_ROT | 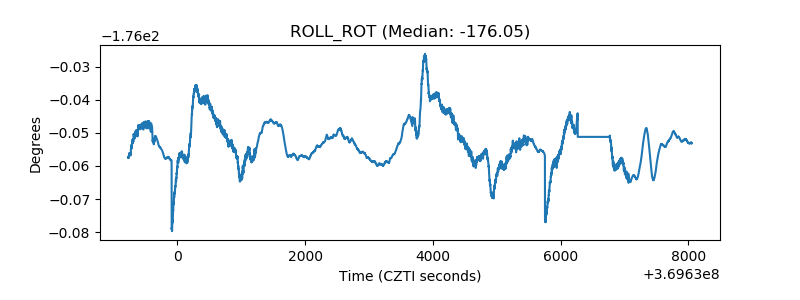 |
| _Roll_DEC | 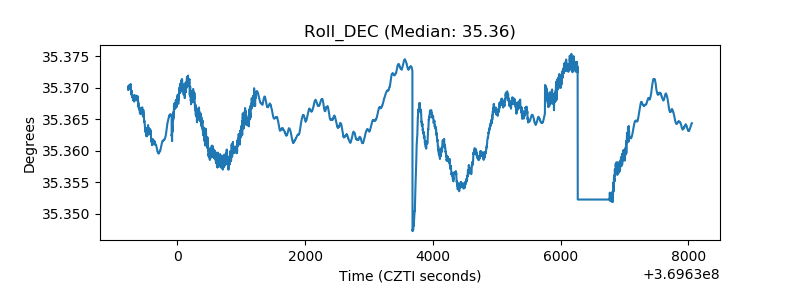 |
| _Roll_RA | 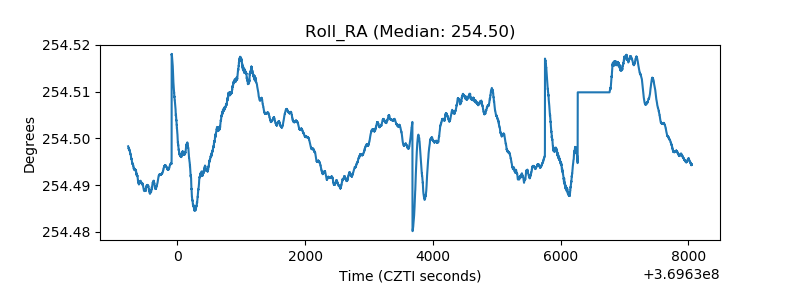 |
| Veto Counter | 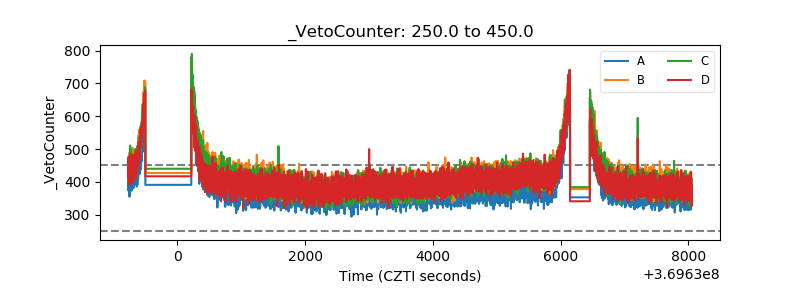 |