| Param | Original file | Final file |
|---|---|---|
| Filename | modeM0/AS1A10_005T01_9000004700_32299cztM0_level2.evt | modeM0/AS1A10_005T01_9000004700_32299cztM0_level2_quad_clean.evt |
| Size (bytes) | 643,999,680 | 86,679,360 |
| Size | 614.2 MB | 82.7 MB |
| Events in quadrant A | 3,505,914 | 546,714 |
| Events in quadrant B | 5,815,334 | 533,868 |
| Events in quadrant C | 3,955,591 | 519,528 |
| Events in quadrant D | 5,723,883 | 507,577 |
| Mode M0 | |||
|---|---|---|---|
| Quadrant | BADHDUFLAG | Total packets | Discarded packets |
| A | 0 | 15210 | 3 |
| B | 0 | 22820 | 2 |
| C | 0 | 16265 | 2 |
| D | 0 | 22208 | 2 |
| Mode M9 | |||
|---|---|---|---|
| Quadrant | BADHDUFLAG | Total packets | Discarded packets |
| A | 0 | 1 | 0 |
| B | 0 | 1 | 0 |
| C | 0 | 1 | 0 |
| D | 0 | 1 | 0 |
| Mode SS | |||
|---|---|---|---|
| Quadrant | BADHDUFLAG | Total packets | Discarded packets |
| A | 0 | 152 | 0 |
| B | 0 | 152 | 0 |
| C | 0 | 152 | 0 |
| D | 0 | 152 | 0 |
| Quadrant | Total seconds | Saturated seconds | Saturation percentage |
|---|---|---|---|
| A | 7426 | 147 | 1.979531% |
| B | 7426 | 297 | 3.999461% |
| C | 7426 | 304 | 4.093725% |
| D | 7426 | 154 | 2.073795% |
Noise dominated data is calculated using 1-second bins in cleaned event files. If a bin has >2000 counts, and if more than 50% of those come from <1% of pixels, then it is considered to be noise-dominated and hence unusable.
| Quadrant | # 1 sec bins | Bins with >0 counts | Bins with >2000 counts | High rate bins dominated by noise | Noise dominated (total time) | Noise dominated (detector-on time) | Marked lightcurve |
|---|---|---|---|---|---|---|---|
| A | 7596 | 7428 | 1 | 1 | 0.01% | 0.01% | 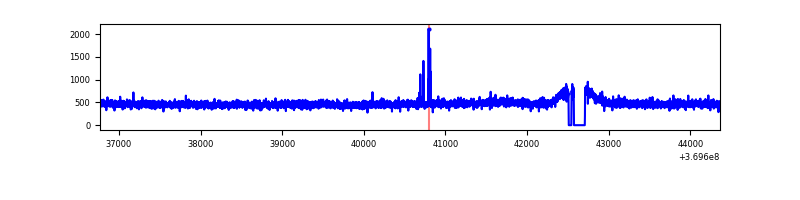 |
| B | 7596 | 7428 | 45 | 45 | 0.59% | 0.61% | 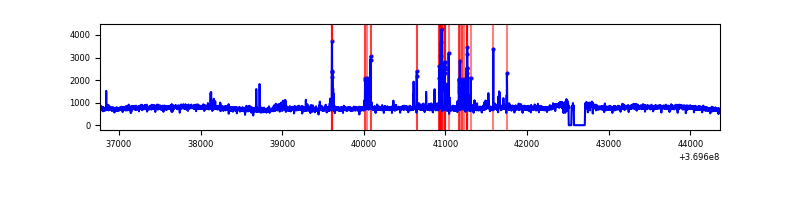 |
| C | 7596 | 7428 | 38 | 38 | 0.50% | 0.51% |  |
| D | 7596 | 7428 | 38 | 38 | 0.50% | 0.51% | 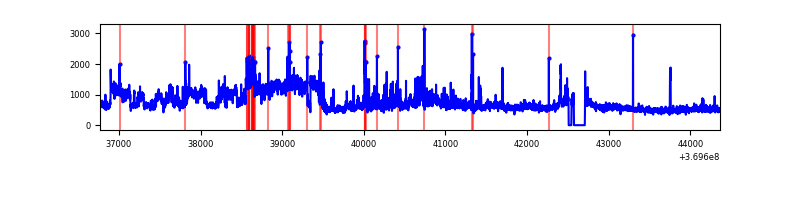 |
Top three noisy pixels from each quadrant. If the there are fewer than three noisy pixels in the level2.evt file, extra rows are filled as -1
| Pixel properties | Quadrant properties | ||||||
|---|---|---|---|---|---|---|---|
| Quadrant | DetID | PixID | Counts | Sigma | Mean | Median | Sigma |
| A | 13 | 6 | 16294 | 84.63 | 900 | 880 | 182.1 |
| A | 13 | 254 | 14504 | 74.8 | 900 | 880 | 182.1 |
| A | 12 | 96 | 13637 | 70.04 | 900 | 880 | 182.1 |
| B | 6 | 159 | 2009148 | 11671.24 | 887 | 862 | 172.1 |
| B | 12 | 18 | 93772 | 539.95 | 887 | 862 | 172.1 |
| B | 5 | 172 | 67896 | 389.57 | 887 | 862 | 172.1 |
| C | 3 | 233 | 194718 | 960.64 | 861 | 865 | 201.8 |
| C | 14 | 238 | 157942 | 778.4 | 861 | 865 | 201.8 |
| C | 2 | 16 | 145575 | 717.11 | 861 | 865 | 201.8 |
| D | 8 | 195 | 2023693 | 9587.3 | 871 | 847 | 211.0 |
| D | 12 | 233 | 143418 | 675.72 | 871 | 847 | 211.0 |
| D | 12 | 218 | 80381 | 376.95 | 871 | 847 | 211.0 |
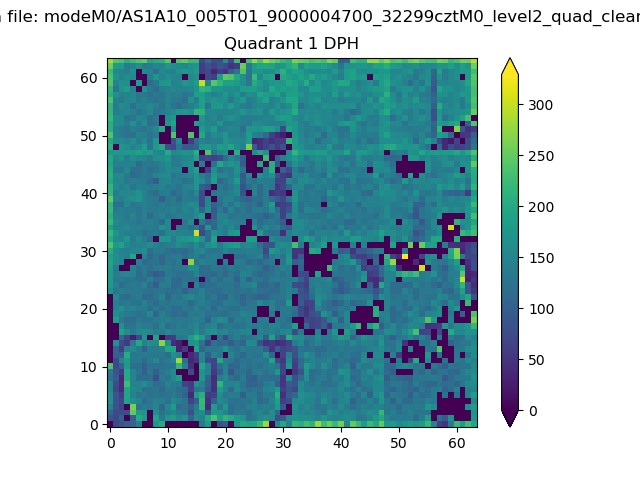
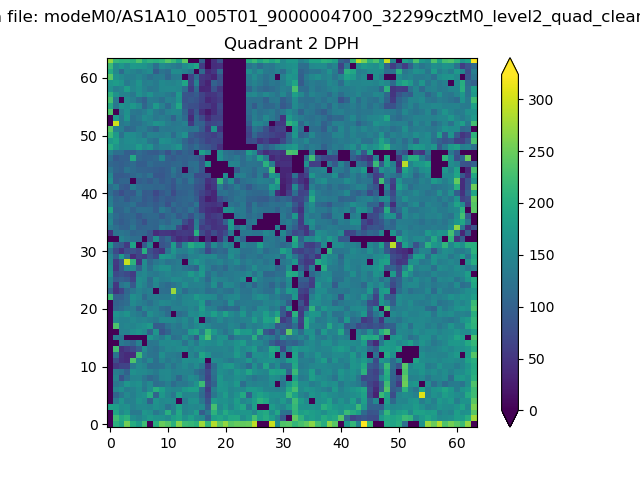
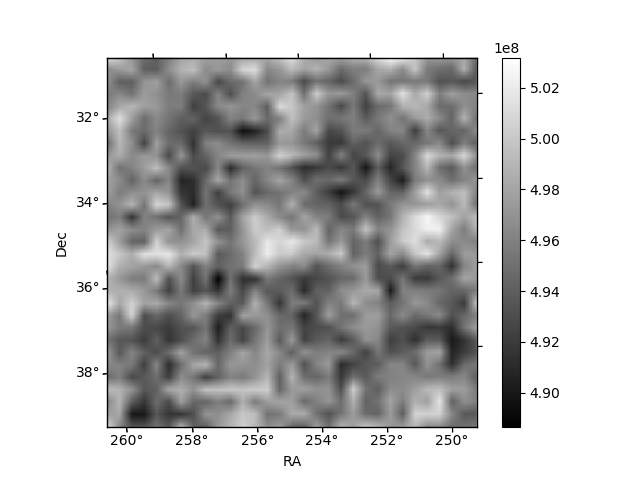
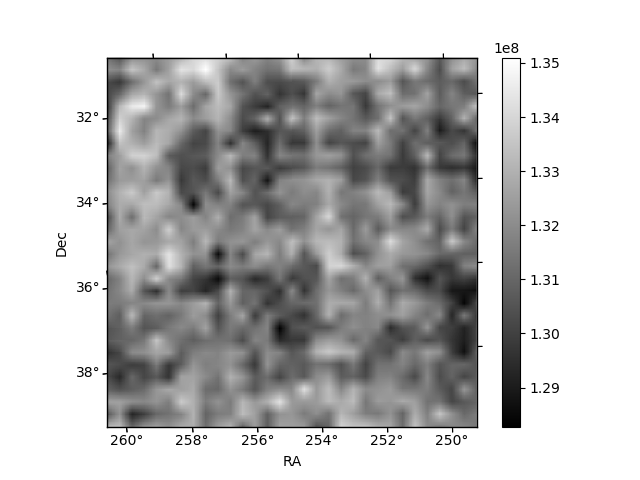
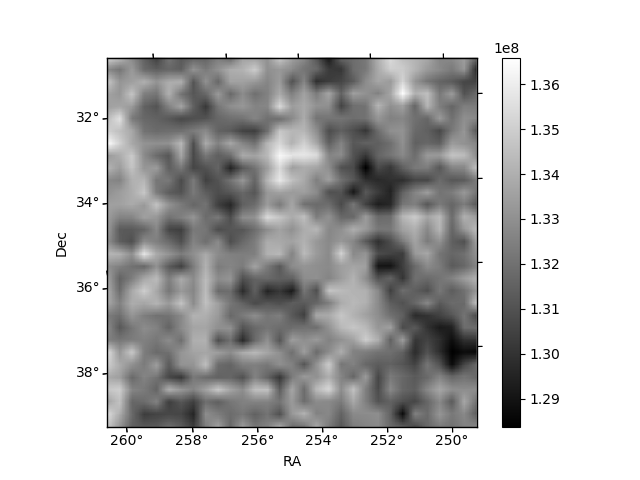
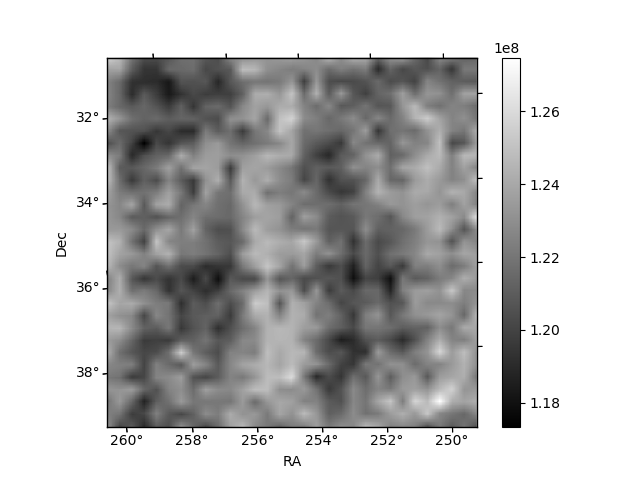
Histogram calculated using DETX and DETY for each event in the final _common_clean file
| Quadrant A | 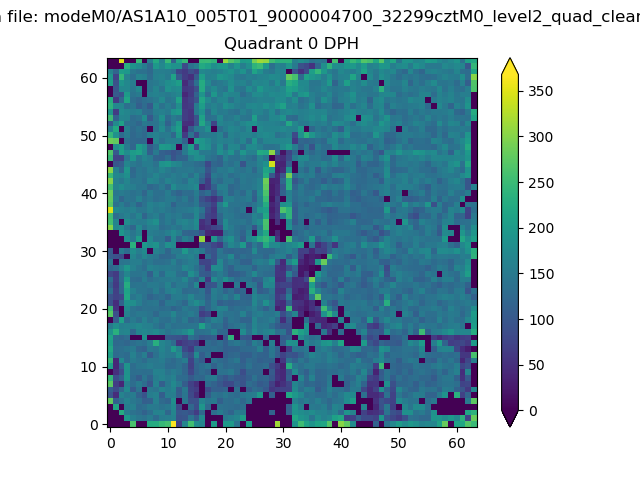 |
 |
Quadrant B |
|---|---|---|---|
| Quadrant D | 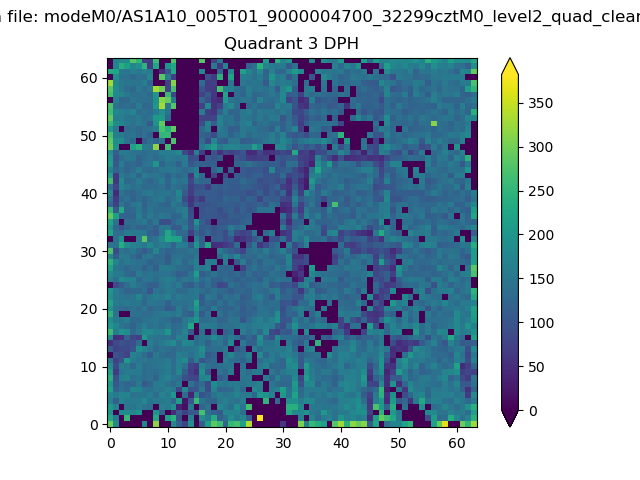 |
 |
Quadrant C |
| Plot type | Count rate plots | Images |
|---|---|---|
| Comparison with Poisson distribution Blue bars denote a histogram of data divided into 1 sec bins. Red curve is a Poisson curve with rate = median count rate of data. |
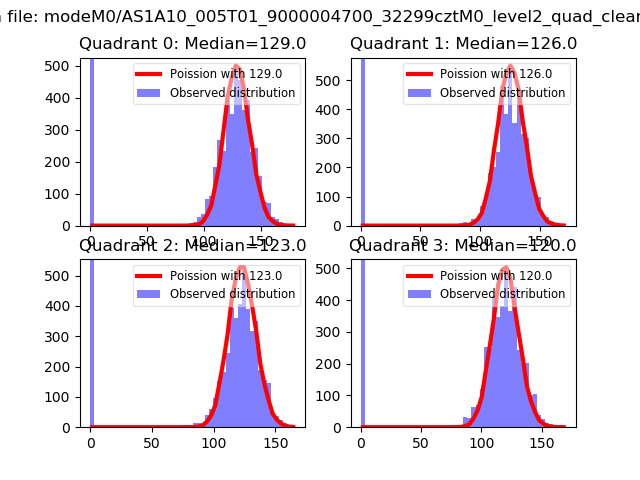 |
 |
| Quadrant-wise count rates Data is divided into 100 sec bins |
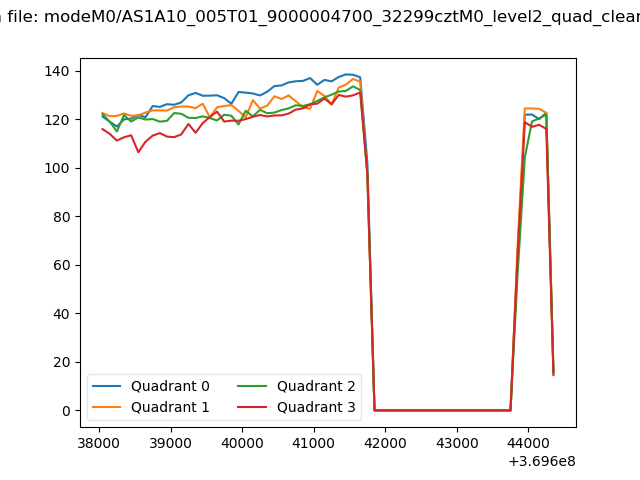 |
|
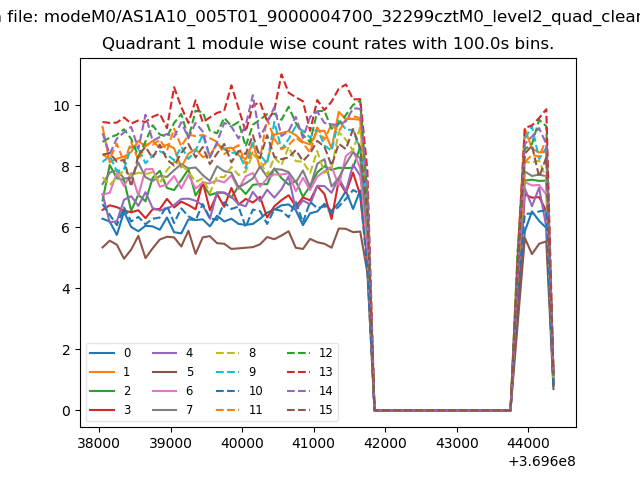
| Module-wise count rates for Quadrant A Data is divided into 100 sec bins |
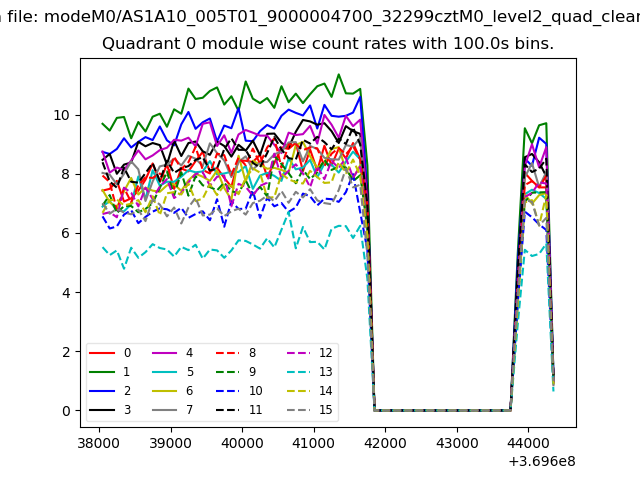 |
 |
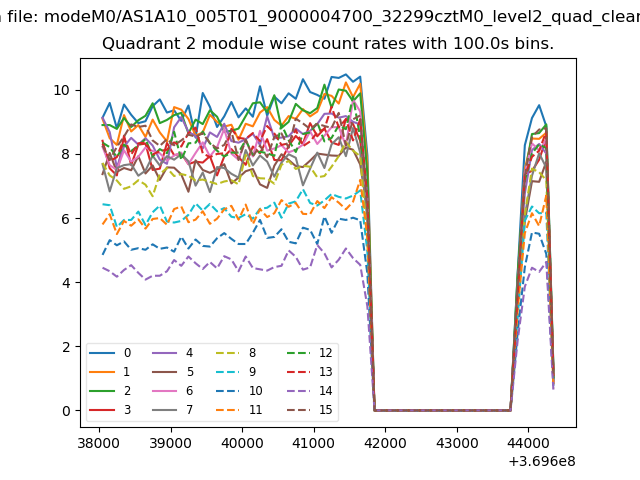
| Module-wise count rates for Quadrant B Data is divided into 100 sec bins |
 |
 |
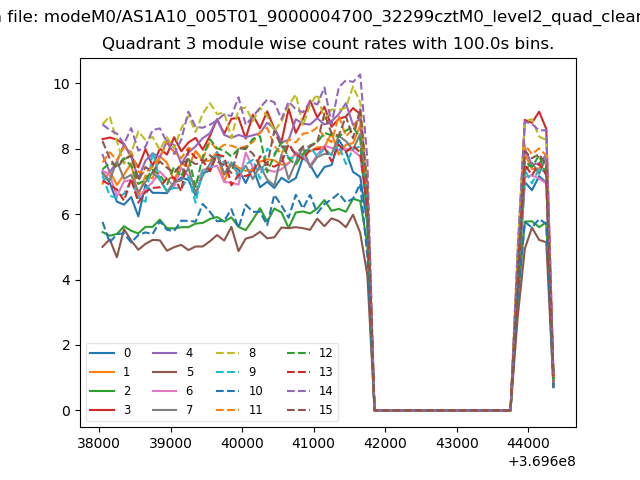
| Module-wise count rates for Quadrant C Data is divided into 100 sec bins |
 |
 |
| Module-wise count rates for Quadrant D Data is divided into 100 sec bins |
 |
 |
| Parameter | Plot |
|---|---|
| CZT HV Monitor |  |
| D_VDD | 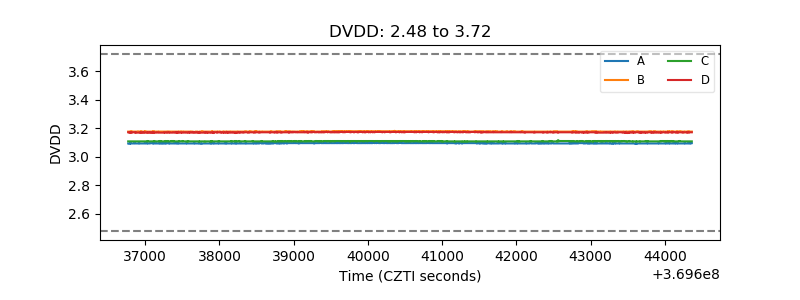 |
| Temperature 1 | 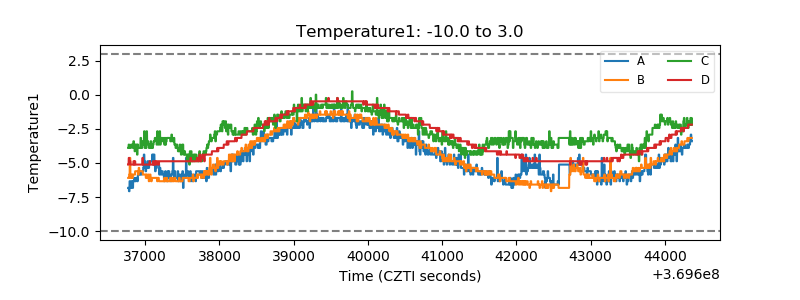 |
| Veto HV Monitor | 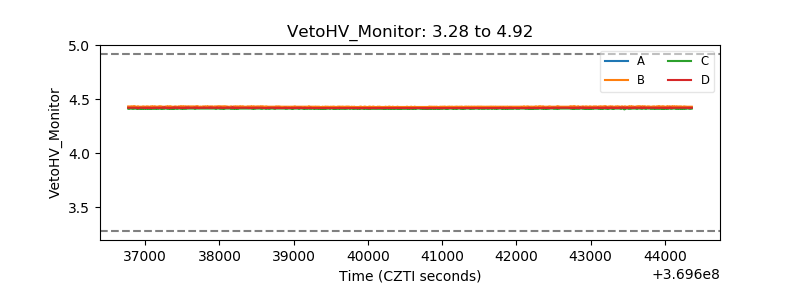 |
| Veto LLD | 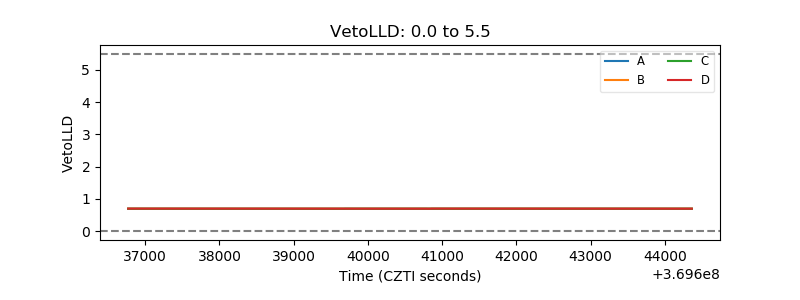 |
| Alpha Counter | 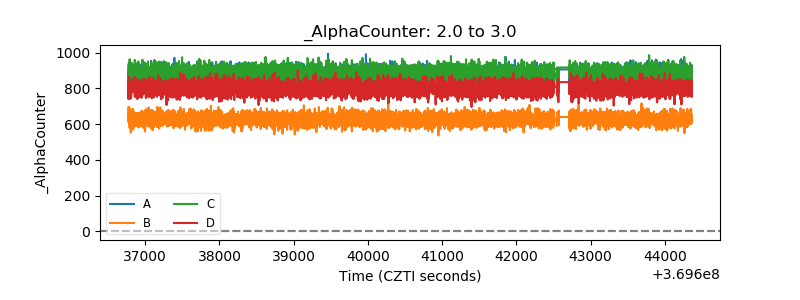 |
| _CPM_Rate | 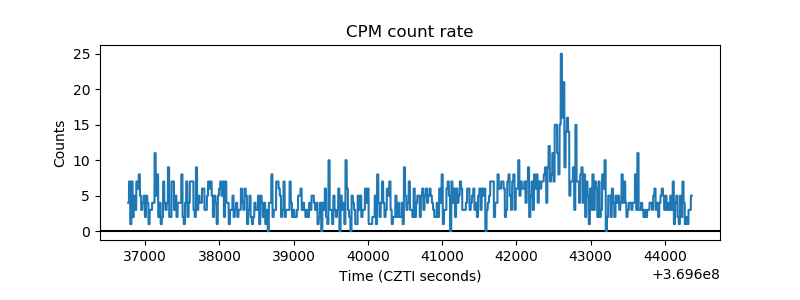 |
| CZT Counter | 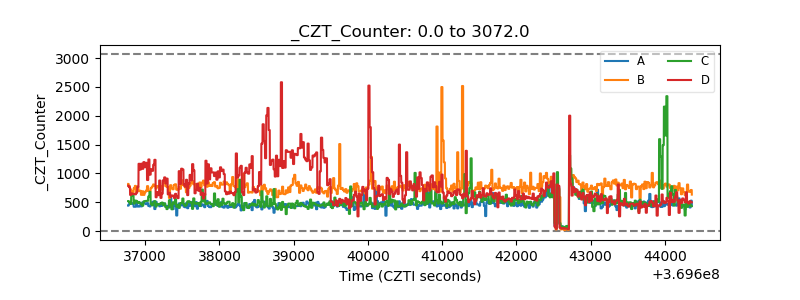 |
| +2.5 Volts monitor |  |
| +5 Volts monitor |  |
| _ROLL_ROT | 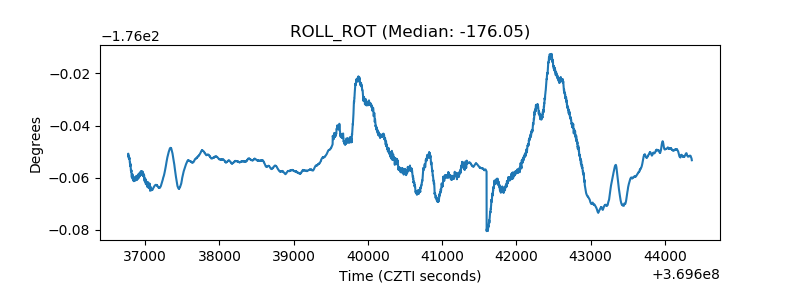 |
| _Roll_DEC | 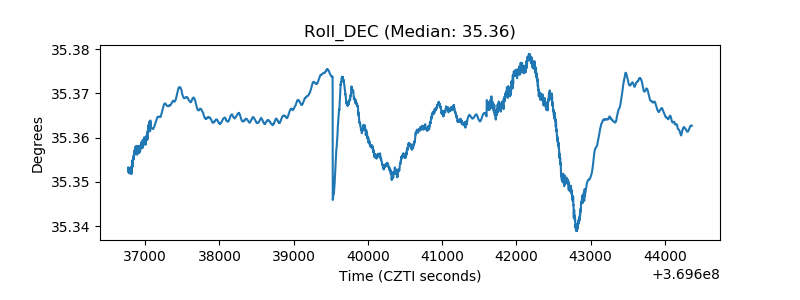 |
| _Roll_RA | 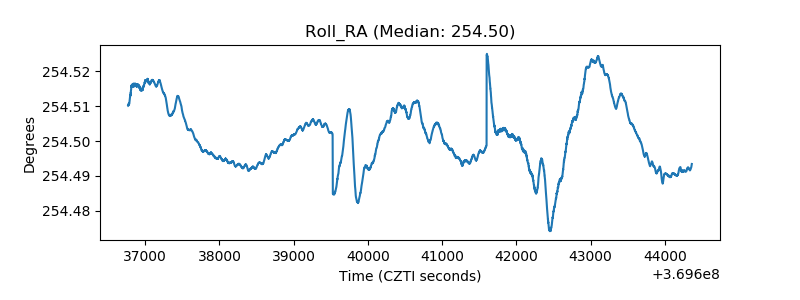 |
| Veto Counter | 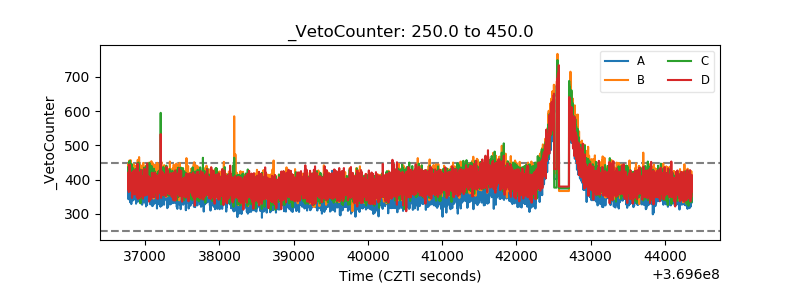 |