| Param | Original file | Final file |
|---|---|---|
| Filename | modeM0/AS1A10_005T01_9000004700_32302cztM0_level2.evt | modeM0/AS1A10_005T01_9000004700_32302cztM0_level2_quad_clean.evt |
| Size (bytes) | 520,666,560 | 74,655,360 |
| Size | 496.5 MB | 71.2 MB |
| Events in quadrant A | 2,813,420 | 483,453 |
| Events in quadrant B | 4,627,231 | 470,783 |
| Events in quadrant C | 3,358,060 | 452,354 |
| Events in quadrant D | 4,562,274 | 434,143 |
| Mode M0 | |||
|---|---|---|---|
| Quadrant | BADHDUFLAG | Total packets | Discarded packets |
| A | 0 | 12301 | 1 |
| B | 0 | 18313 | 1 |
| C | 0 | 13673 | 1 |
| D | 0 | 17709 | 1 |
| Mode M9 | |||
|---|---|---|---|
| Quadrant | BADHDUFLAG | Total packets | Discarded packets |
| A | 0 | 2 | 0 |
| B | 0 | 1 | 0 |
| C | 0 | 1 | 0 |
| D | 0 | 1 | 0 |
| Mode SS | |||
|---|---|---|---|
| Quadrant | BADHDUFLAG | Total packets | Discarded packets |
| A | 0 | 122 | 0 |
| B | 0 | 122 | 0 |
| C | 0 | 122 | 0 |
| D | 0 | 122 | 0 |
| Quadrant | Total seconds | Saturated seconds | Saturation percentage |
|---|---|---|---|
| A | 6009 | 115 | 1.913796% |
| B | 6009 | 208 | 3.461474% |
| C | 6009 | 264 | 4.393410% |
| D | 6010 | 436 | 7.254576% |
Noise dominated data is calculated using 1-second bins in cleaned event files. If a bin has >2000 counts, and if more than 50% of those come from <1% of pixels, then it is considered to be noise-dominated and hence unusable.
| Quadrant | # 1 sec bins | Bins with >0 counts | Bins with >2000 counts | High rate bins dominated by noise | Noise dominated (total time) | Noise dominated (detector-on time) | Marked lightcurve |
|---|---|---|---|---|---|---|---|
| A | 6009 | 6009 | 0 | 0 | 0.00% | 0.00% | 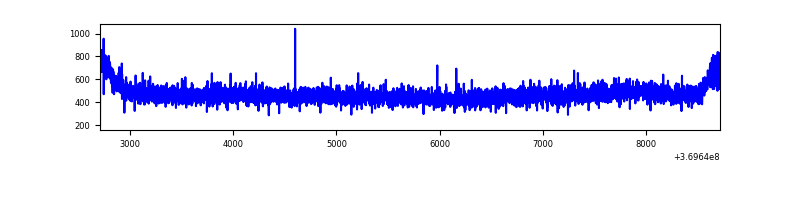 |
| B | 6009 | 6009 | 19 | 19 | 0.32% | 0.32% | 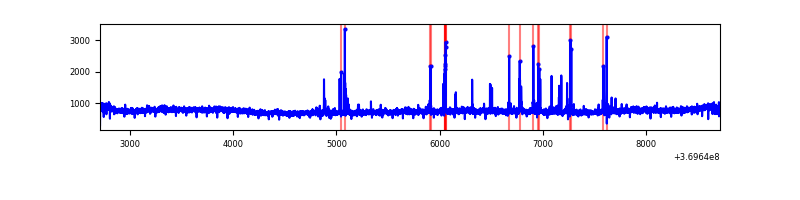 |
| C | 6009 | 6009 | 40 | 40 | 0.67% | 0.67% | 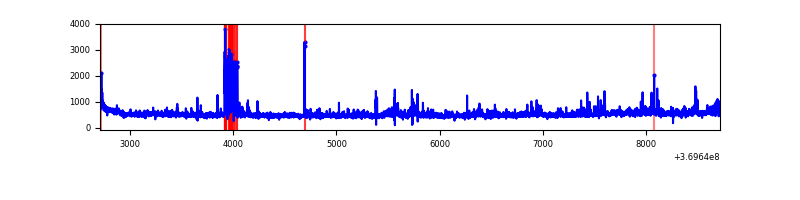 |
| D | 6010 | 6010 | 286 | 286 | 4.76% | 4.76% | 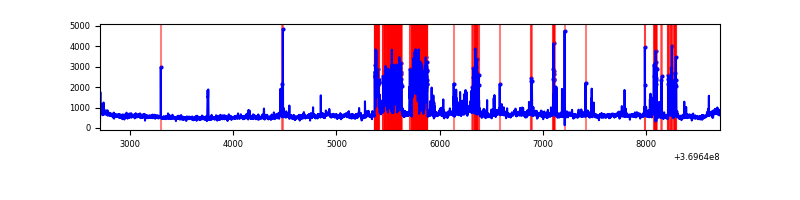 |
Top three noisy pixels from each quadrant. If the there are fewer than three noisy pixels in the level2.evt file, extra rows are filled as -1
| Pixel properties | Quadrant properties | ||||||
|---|---|---|---|---|---|---|---|
| Quadrant | DetID | PixID | Counts | Sigma | Mean | Median | Sigma |
| A | 13 | 254 | 11318 | 71.07 | 726 | 706 | 149.3 |
| A | 13 | 6 | 8975 | 55.38 | 726 | 706 | 149.3 |
| A | 3 | 137 | 7584 | 46.07 | 726 | 706 | 149.3 |
| B | 6 | 159 | 1632317 | 11748.53 | 714 | 694 | 138.9 |
| B | 12 | 18 | 61983 | 441.31 | 714 | 694 | 138.9 |
| B | 5 | 172 | 41990 | 297.35 | 714 | 694 | 138.9 |
| C | 3 | 233 | 279136 | 1698.27 | 692 | 693 | 164.0 |
| C | 2 | 16 | 158344 | 961.54 | 692 | 693 | 164.0 |
| C | 14 | 238 | 130835 | 793.76 | 692 | 693 | 164.0 |
| D | 8 | 195 | 819418 | 4954.91 | 688 | 668 | 165.2 |
| D | 12 | 233 | 661031 | 3996.38 | 688 | 668 | 165.2 |
| D | 13 | 249 | 216231 | 1304.54 | 688 | 668 | 165.2 |
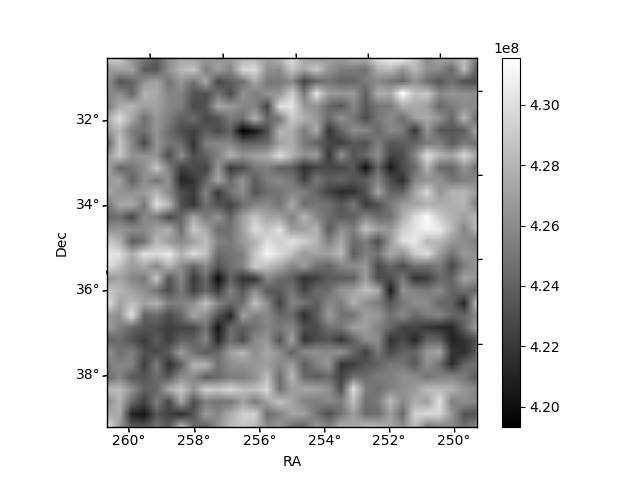
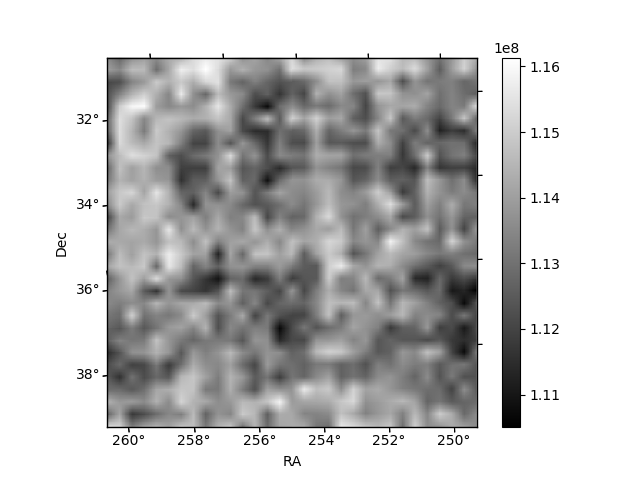
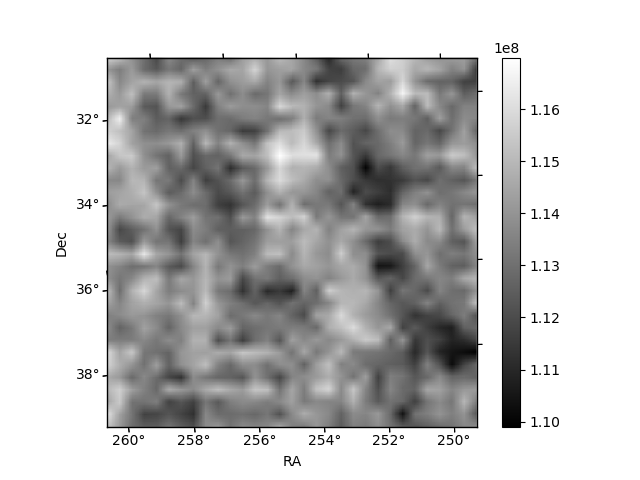
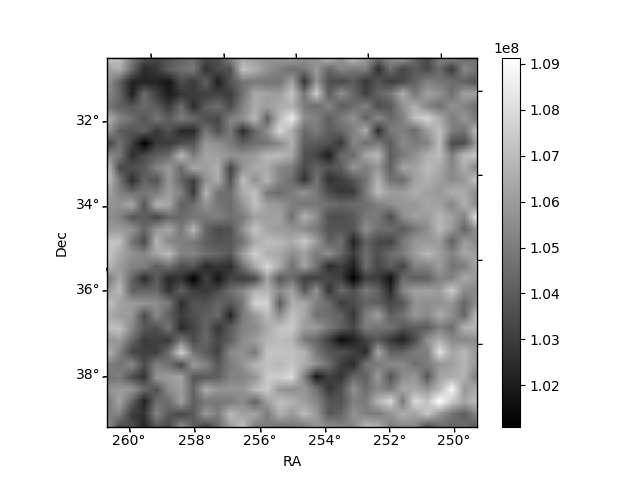
Histogram calculated using DETX and DETY for each event in the final _common_clean file
| Quadrant A | 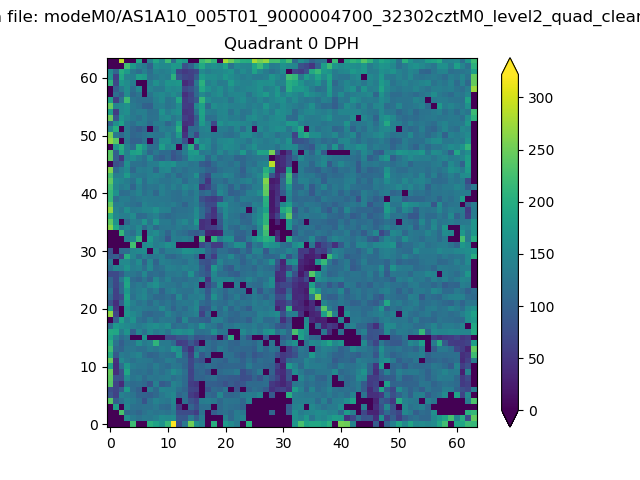 |
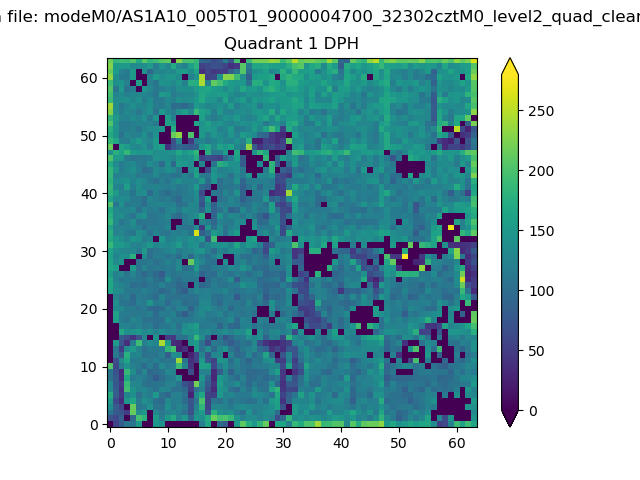 |
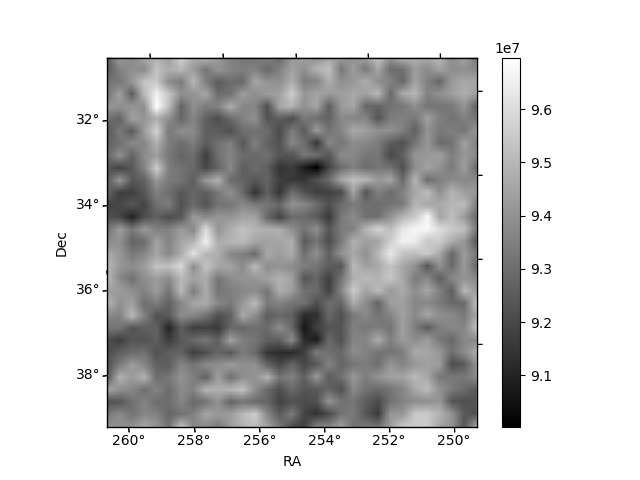
Quadrant B |
|---|---|---|---|
| Quadrant D | 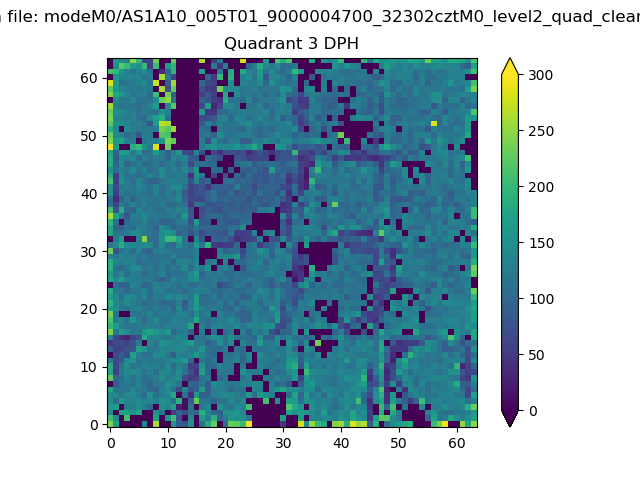 |
 |
Quadrant C |
| Plot type | Count rate plots | Images |
|---|---|---|
| Comparison with Poisson distribution Blue bars denote a histogram of data divided into 1 sec bins. Red curve is a Poisson curve with rate = median count rate of data. |
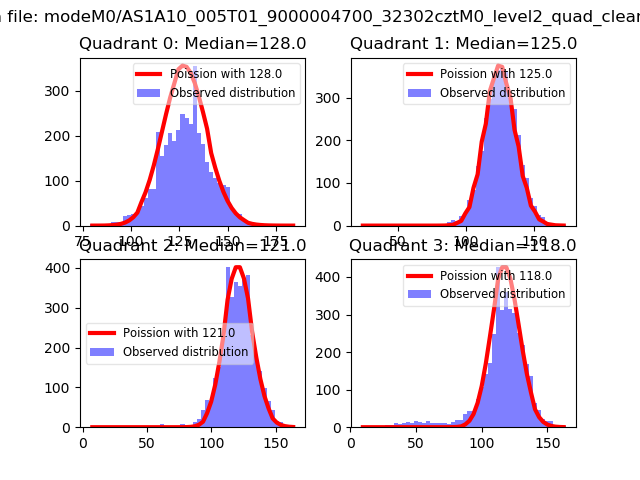 |
 |
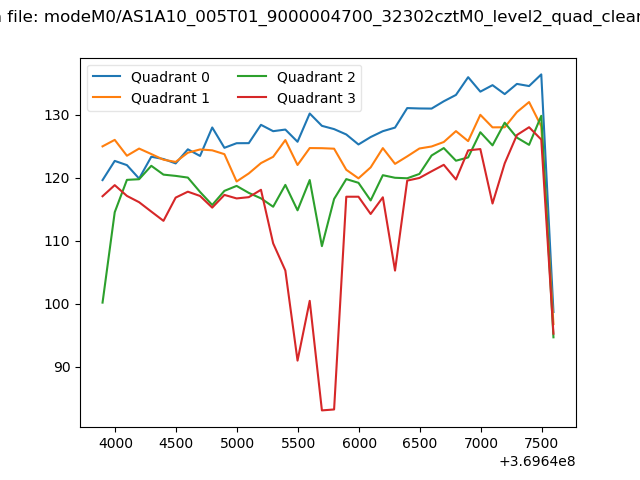
| Quadrant-wise count rates Data is divided into 100 sec bins |
 |
|
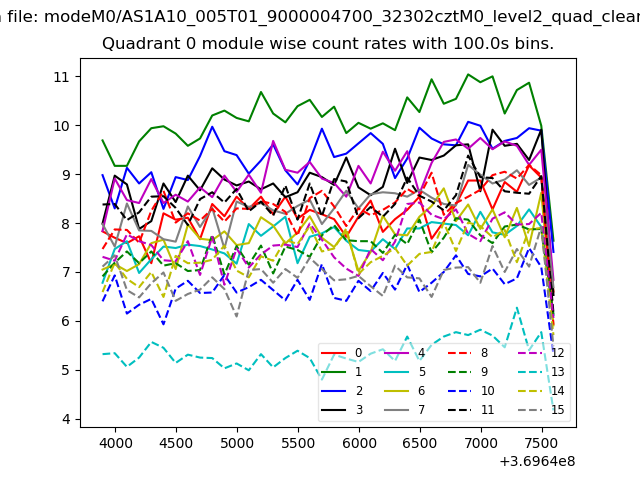
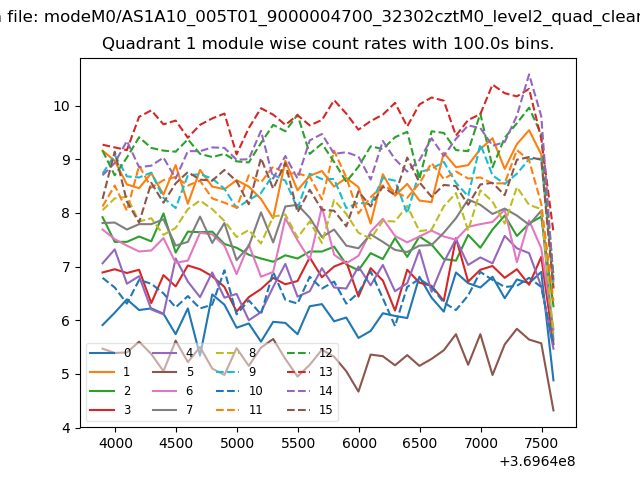
| Module-wise count rates for Quadrant A Data is divided into 100 sec bins |
 |
 |
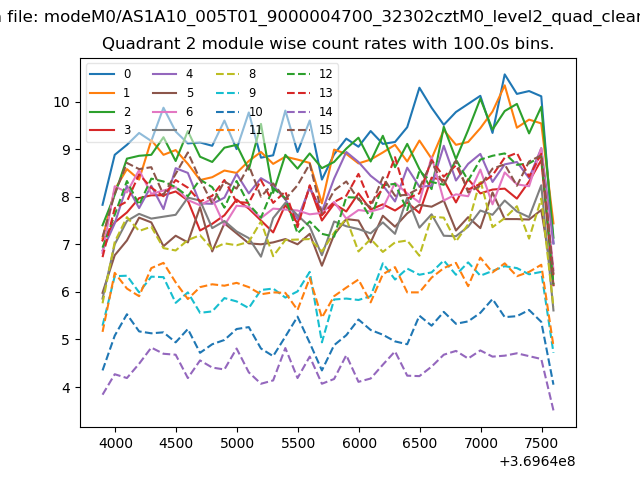
| Module-wise count rates for Quadrant B Data is divided into 100 sec bins |
 |
 |
| Module-wise count rates for Quadrant C Data is divided into 100 sec bins |
 |
 |
| Module-wise count rates for Quadrant D Data is divided into 100 sec bins |
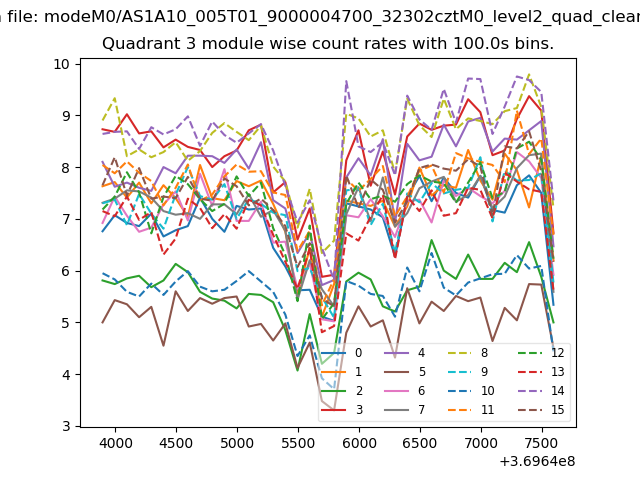 |
 |
| Parameter | Plot |
|---|---|
| CZT HV Monitor | 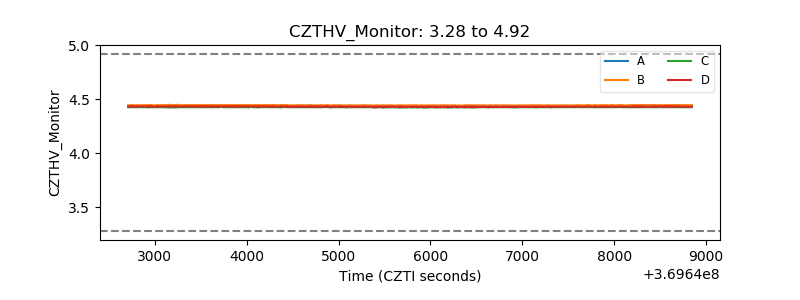 |
| D_VDD | 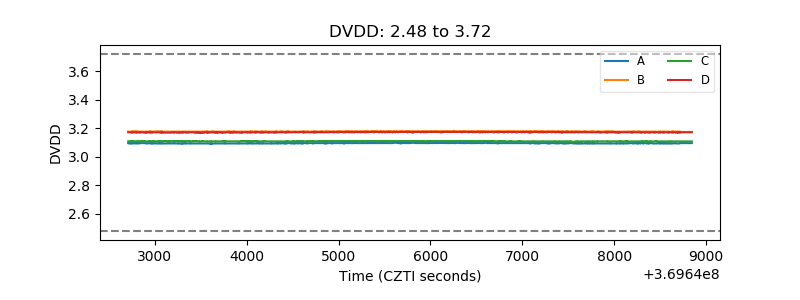 |
| Temperature 1 | 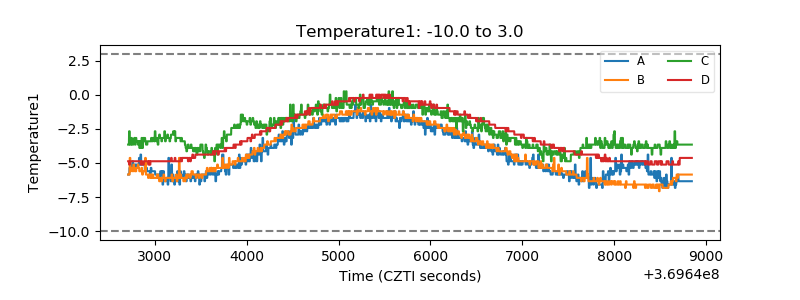 |
| Veto HV Monitor | 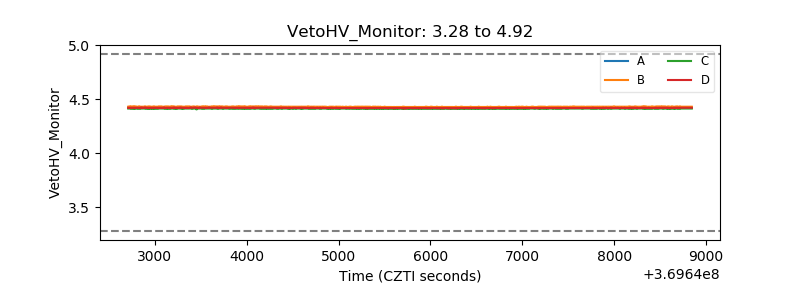 |
| Veto LLD | 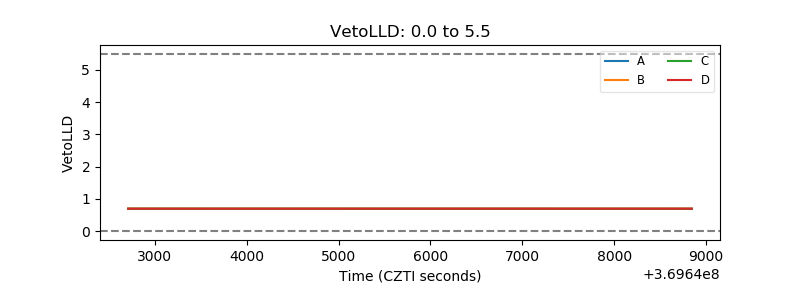 |
| Alpha Counter | 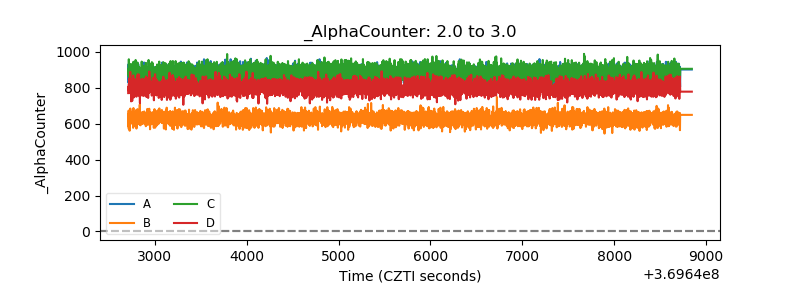 |
| _CPM_Rate | 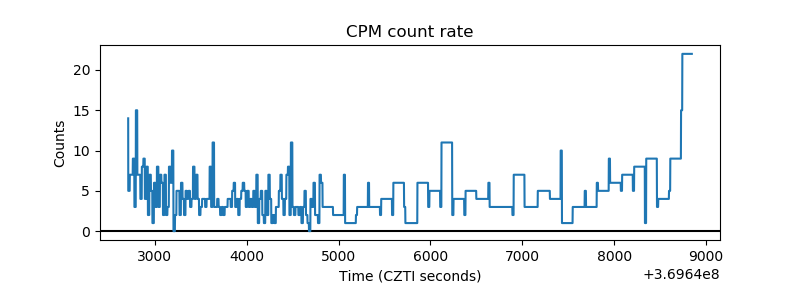 |
| CZT Counter |  |
| +2.5 Volts monitor |  |
| +5 Volts monitor |  |
| _ROLL_ROT | 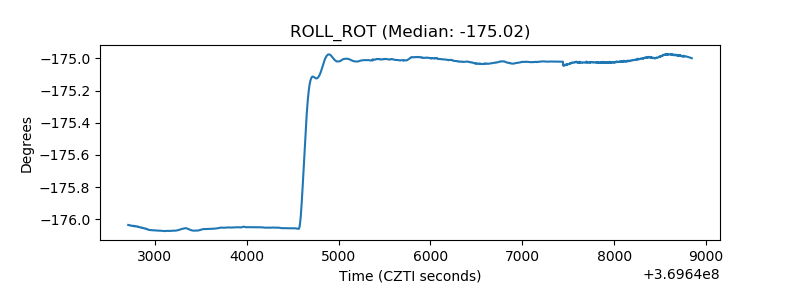 |
| _Roll_DEC | 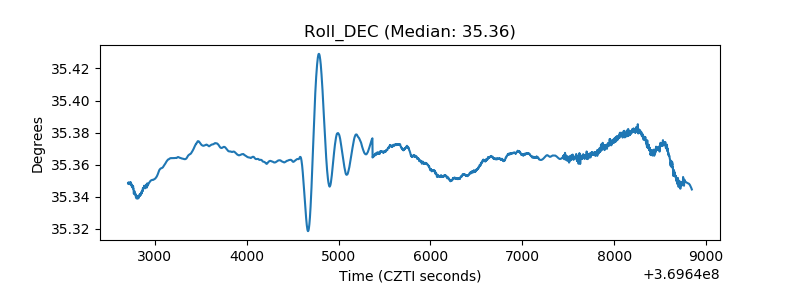 |
| _Roll_RA |  |
| Veto Counter | 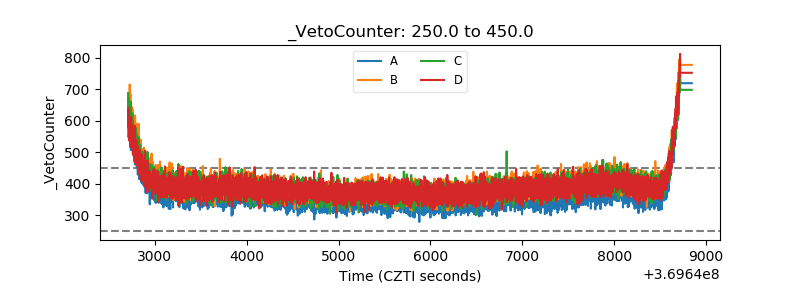 |