| Param | Original file | Final file |
|---|---|---|
| Filename | modeM0/AS1A10_005T01_9000004700_32304cztM0_level2.evt | modeM0/AS1A10_005T01_9000004700_32304cztM0_level2_quad_clean.evt |
| Size (bytes) | 664,329,600 | 85,080,960 |
| Size | 633.6 MB | 81.1 MB |
| Events in quadrant A | 3,241,932 | 574,916 |
| Events in quadrant B | 5,342,103 | 554,052 |
| Events in quadrant C | 3,439,894 | 541,095 |
| Events in quadrant D | 7,677,127 | 473,360 |
| Mode M0 | |||
|---|---|---|---|
| Quadrant | BADHDUFLAG | Total packets | Discarded packets |
| A | 0 | 13712 | 2 |
| B | 0 | 20118 | 1 |
| C | 0 | 14138 | 1 |
| D | 0 | 27026 | 1 |
| Mode M9 | |||
|---|---|---|---|
| Quadrant | BADHDUFLAG | Total packets | Discarded packets |
| A | 0 | 11 | 0 |
| B | 0 | 11 | 0 |
| C | 0 | 11 | 0 |
| D | 0 | 11 | 0 |
| Mode SS | |||
|---|---|---|---|
| Quadrant | BADHDUFLAG | Total packets | Discarded packets |
| A | 0 | 124 | 0 |
| B | 0 | 124 | 0 |
| C | 0 | 124 | 0 |
| D | 0 | 124 | 0 |
| Quadrant | Total seconds | Saturated seconds | Saturation percentage |
|---|---|---|---|
| A | 6206 | 90 | 1.450209% |
| B | 6206 | 130 | 2.094747% |
| C | 6206 | 118 | 1.901386% |
| D | 6206 | 947 | 15.259426% |
Noise dominated data is calculated using 1-second bins in cleaned event files. If a bin has >2000 counts, and if more than 50% of those come from <1% of pixels, then it is considered to be noise-dominated and hence unusable.
| Quadrant | # 1 sec bins | Bins with >0 counts | Bins with >2000 counts | High rate bins dominated by noise | Noise dominated (total time) | Noise dominated (detector-on time) | Marked lightcurve |
|---|---|---|---|---|---|---|---|
| A | 7241 | 6207 | 32 | 32 | 0.44% | 0.52% | 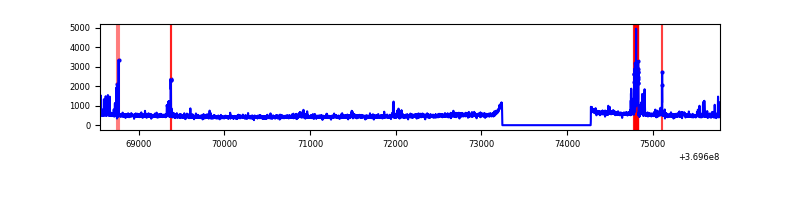 |
| B | 7241 | 6207 | 33 | 33 | 0.46% | 0.53% | 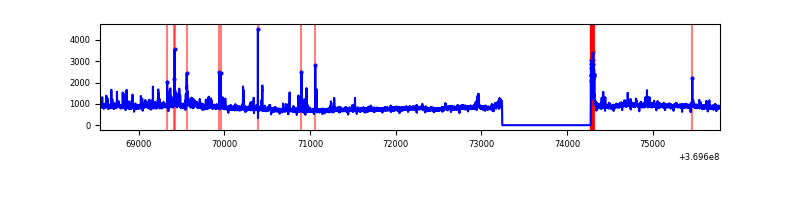 |
| C | 7241 | 6207 | 8 | 8 | 0.11% | 0.13% | 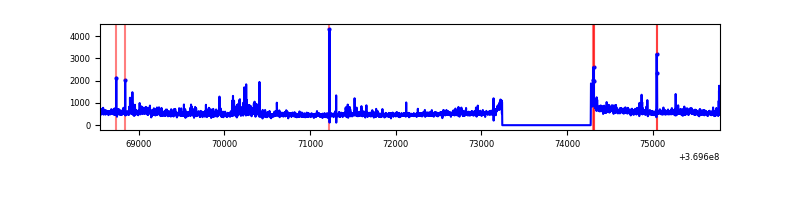 |
| D | 7241 | 6207 | 795 | 795 | 10.98% | 12.81% | 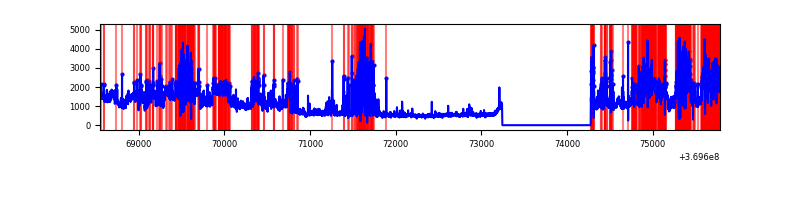 |
Top three noisy pixels from each quadrant. If the there are fewer than three noisy pixels in the level2.evt file, extra rows are filled as -1
| Pixel properties | Quadrant properties | ||||||
|---|---|---|---|---|---|---|---|
| Quadrant | DetID | PixID | Counts | Sigma | Mean | Median | Sigma |
| A | 0 | 6 | 226345 | 1473.25 | 757 | 740 | 153.1 |
| A | 12 | 189 | 67474 | 435.79 | 757 | 740 | 153.1 |
| A | 0 | 226 | 20019 | 125.9 | 757 | 740 | 153.1 |
| B | 6 | 159 | 2026016 | 14414.6 | 744 | 725 | 140.5 |
| B | 0 | 190 | 154105 | 1091.65 | 744 | 725 | 140.5 |
| B | 5 | 172 | 128219 | 907.41 | 744 | 725 | 140.5 |
| C | 3 | 233 | 344337 | 2021.57 | 725 | 730 | 170.0 |
| C | 14 | 238 | 120049 | 702.0 | 725 | 730 | 170.0 |
| C | 4 | 175 | 61421 | 357.07 | 725 | 730 | 170.0 |
| D | 8 | 195 | 3222072 | 19522.79 | 695 | 678 | 165.0 |
| D | 12 | 6 | 412655 | 2496.73 | 695 | 678 | 165.0 |
| D | 13 | 249 | 372084 | 2250.85 | 695 | 678 | 165.0 |
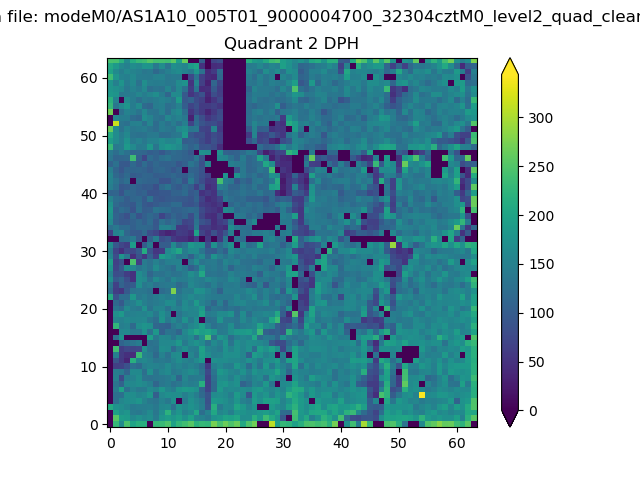
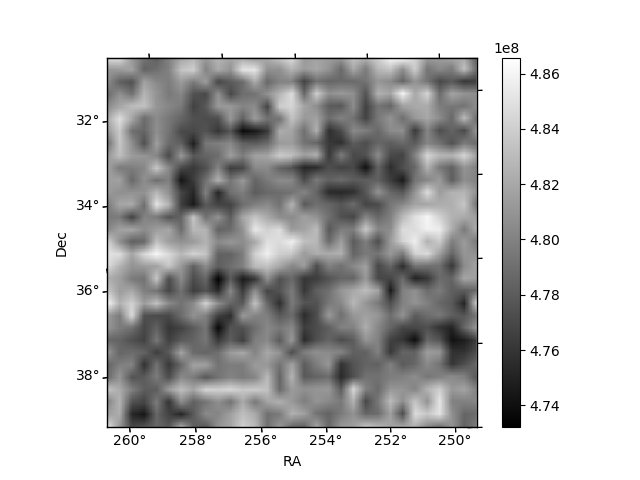
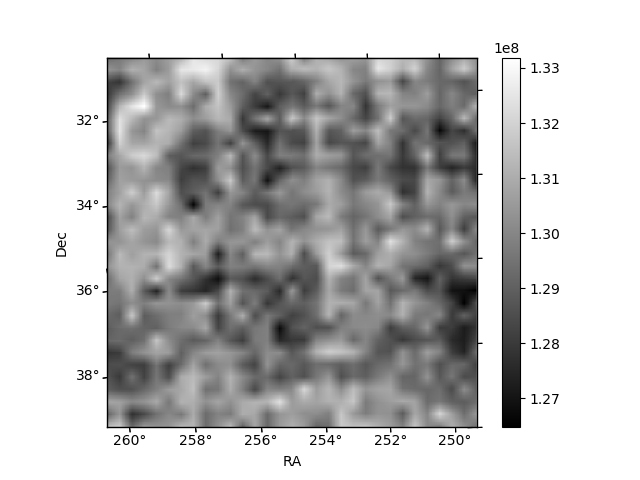
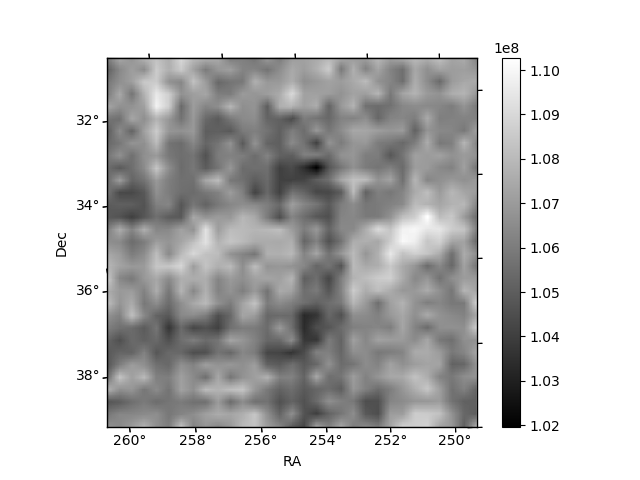
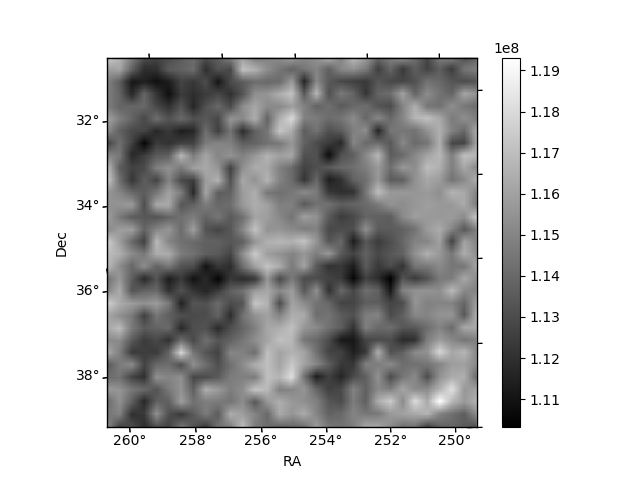
Histogram calculated using DETX and DETY for each event in the final _common_clean file
| Quadrant A | 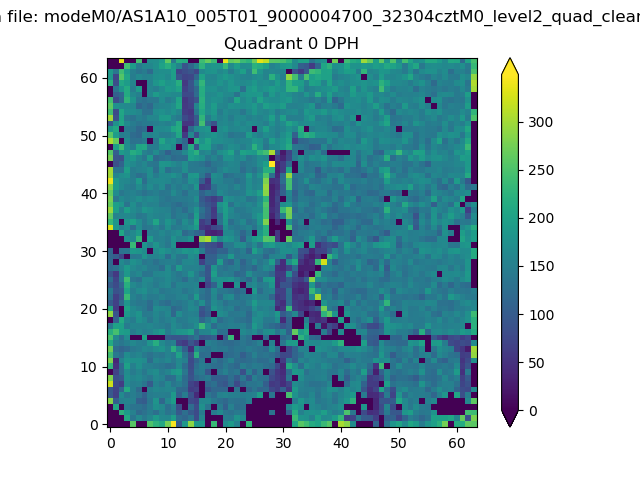 |
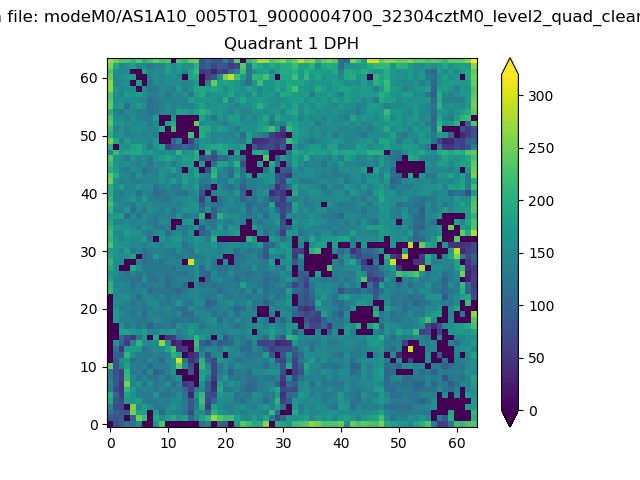 |
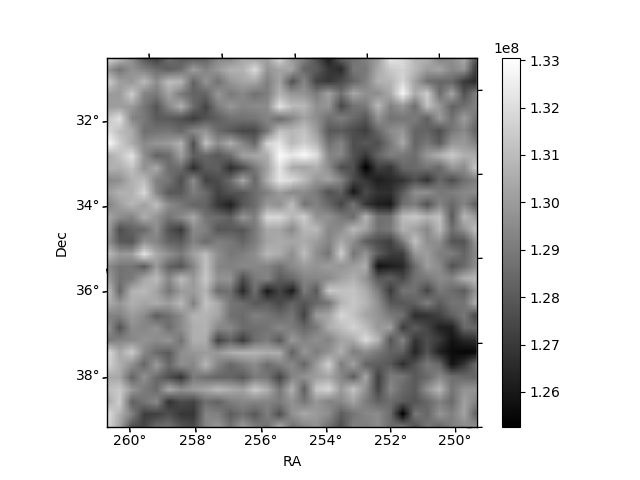
Quadrant B |
|---|---|---|---|
| Quadrant D | 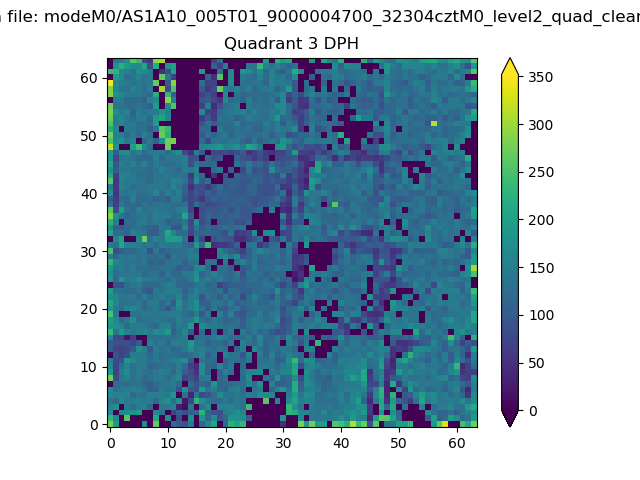 |
 |
Quadrant C |
| Plot type | Count rate plots | Images |
|---|---|---|
| Comparison with Poisson distribution Blue bars denote a histogram of data divided into 1 sec bins. Red curve is a Poisson curve with rate = median count rate of data. |
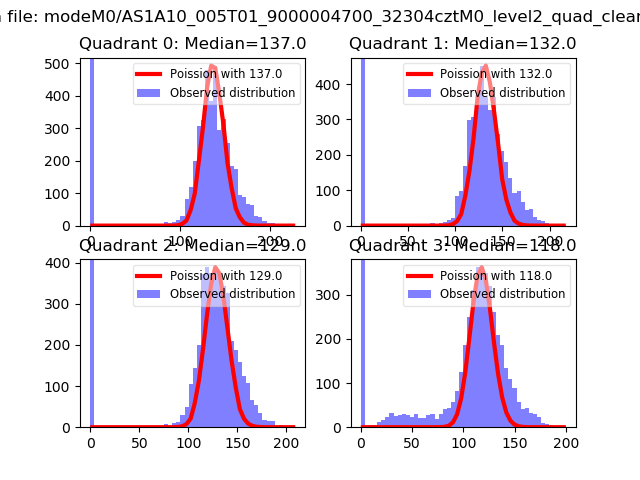 |
 |
| Quadrant-wise count rates Data is divided into 100 sec bins |
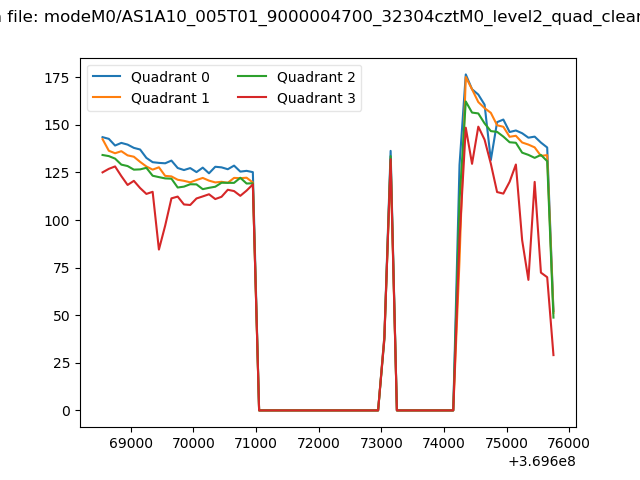 |
|
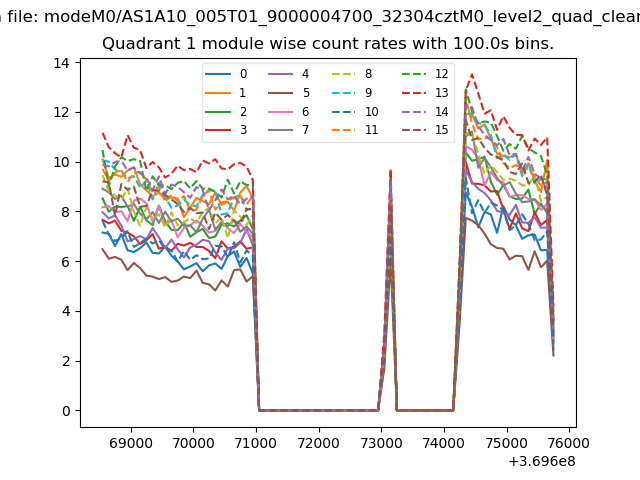
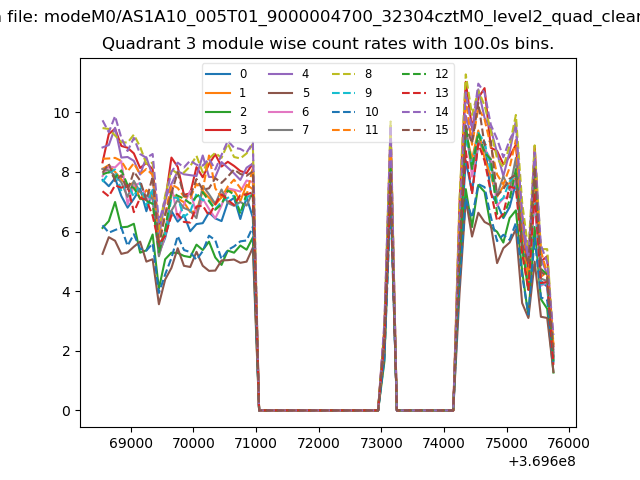
| Module-wise count rates for Quadrant A Data is divided into 100 sec bins |
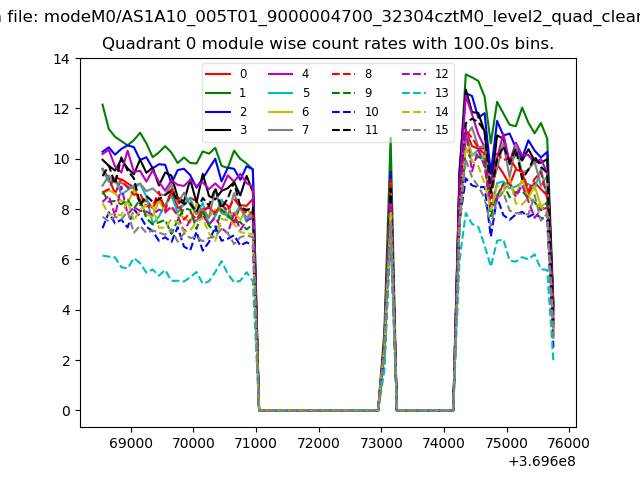 |
 |
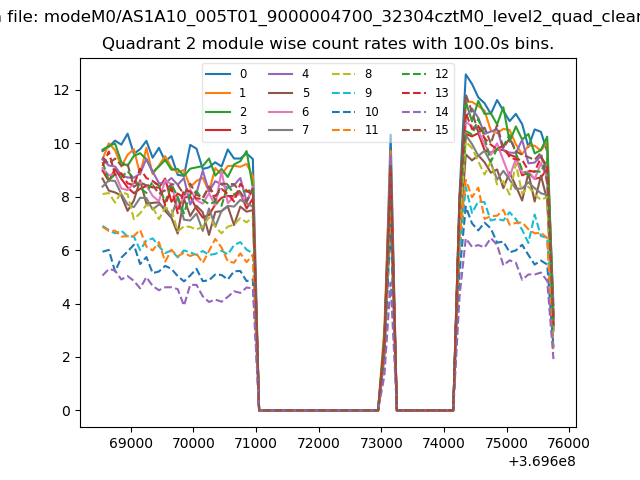
| Module-wise count rates for Quadrant B Data is divided into 100 sec bins |
 |
 |
| Module-wise count rates for Quadrant C Data is divided into 100 sec bins |
 |
 |
| Module-wise count rates for Quadrant D Data is divided into 100 sec bins |
 |
 |
| Parameter | Plot |
|---|---|
| CZT HV Monitor | 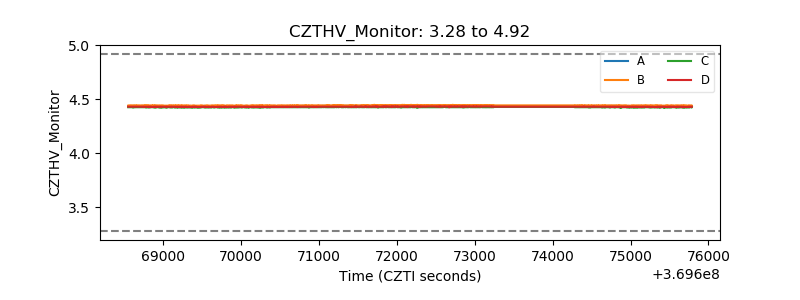 |
| D_VDD | 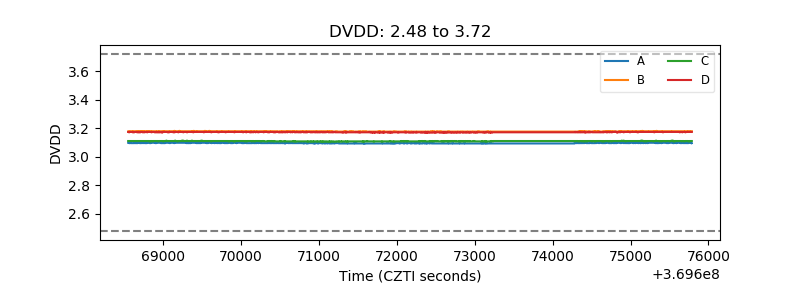 |
| Temperature 1 | 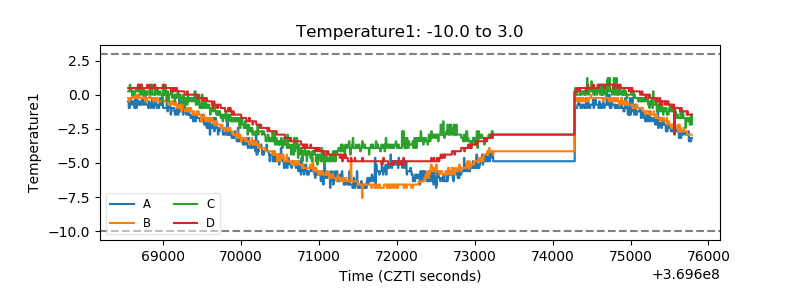 |
| Veto HV Monitor | 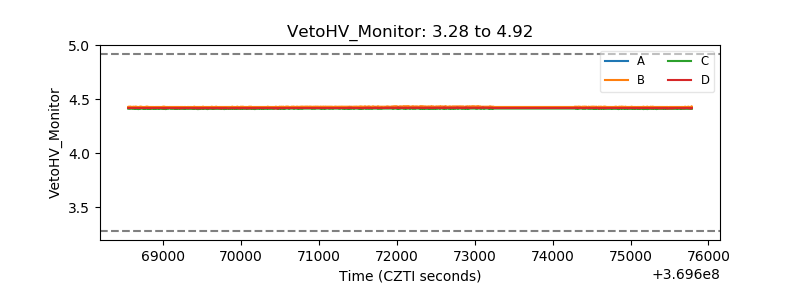 |
| Veto LLD | 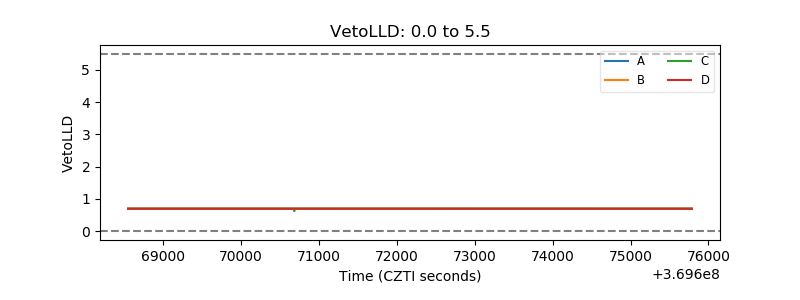 |
| Alpha Counter | 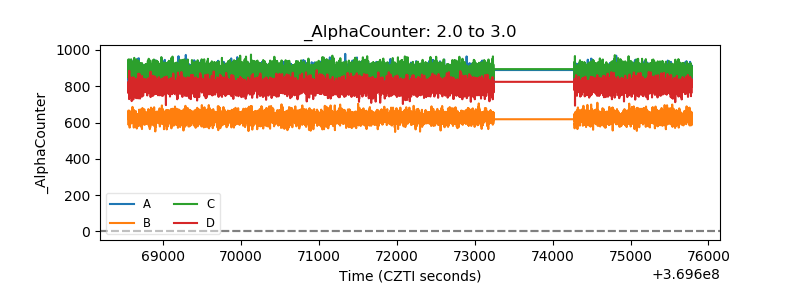 |
| _CPM_Rate | 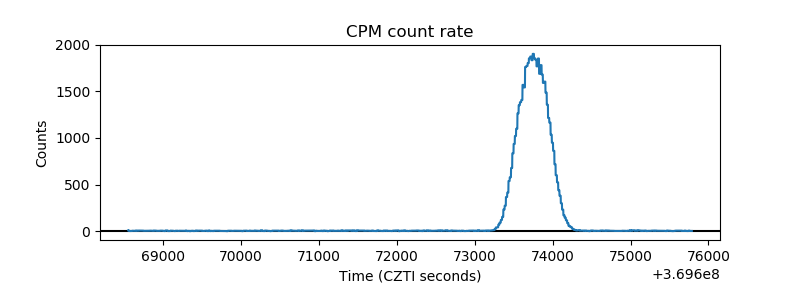 |
| CZT Counter | 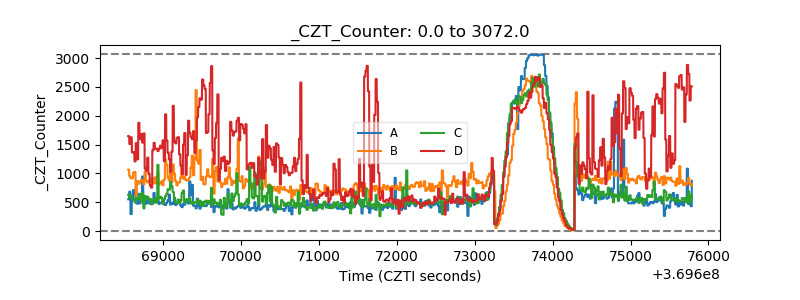 |
| +2.5 Volts monitor |  |
| +5 Volts monitor |  |
| _ROLL_ROT | 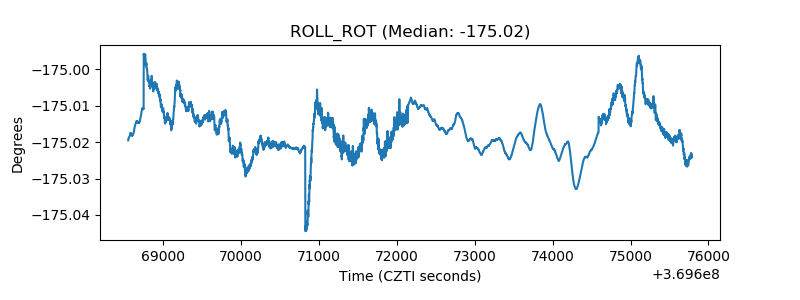 |
| _Roll_DEC | 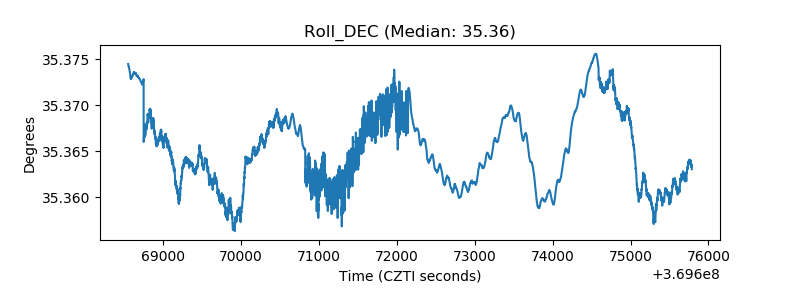 |
| _Roll_RA | 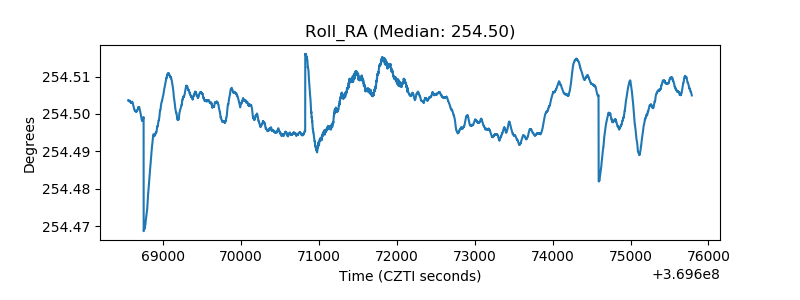 |
| Veto Counter | 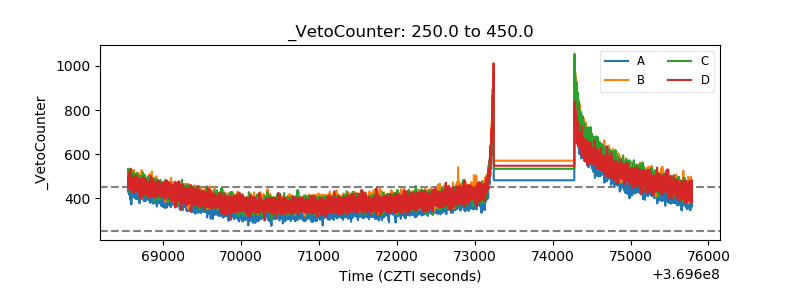 |