| Param | Original file | Final file |
|---|---|---|
| Filename | modeM0/AS1A10_005T01_9000004700_32307cztM0_level2.evt | modeM0/AS1A10_005T01_9000004700_32307cztM0_level2_quad_clean.evt |
| Size (bytes) | 604,183,680 | 99,760,320 |
| Size | 576.2 MB | 95.1 MB |
| Events in quadrant A | 3,291,070 | 674,900 |
| Events in quadrant B | 5,825,821 | 657,269 |
| Events in quadrant C | 4,185,645 | 632,995 |
| Events in quadrant D | 4,566,584 | 613,270 |
| Mode M0 | |||
|---|---|---|---|
| Quadrant | BADHDUFLAG | Total packets | Discarded packets |
| A | 0 | 13753 | 3 |
| B | 0 | 21772 | 2 |
| C | 0 | 16629 | 2 |
| D | 0 | 17788 | 2 |
| Mode M9 | |||
|---|---|---|---|
| Quadrant | BADHDUFLAG | Total packets | Discarded packets |
| A | 0 | 12 | 0 |
| B | 0 | 12 | 0 |
| C | 0 | 12 | 0 |
| D | 0 | 12 | 0 |
| Mode SS | |||
|---|---|---|---|
| Quadrant | BADHDUFLAG | Total packets | Discarded packets |
| A | 0 | 130 | 0 |
| B | 0 | 130 | 0 |
| C | 0 | 130 | 0 |
| D | 0 | 130 | 0 |
| Quadrant | Total seconds | Saturated seconds | Saturation percentage |
|---|---|---|---|
| A | 6336 | 31 | 0.489268% |
| B | 6336 | 282 | 4.450758% |
| C | 6336 | 298 | 4.703283% |
| D | 6336 | 216 | 3.409091% |
Noise dominated data is calculated using 1-second bins in cleaned event files. If a bin has >2000 counts, and if more than 50% of those come from <1% of pixels, then it is considered to be noise-dominated and hence unusable.
| Quadrant | # 1 sec bins | Bins with >0 counts | Bins with >2000 counts | High rate bins dominated by noise | Noise dominated (total time) | Noise dominated (detector-on time) | Marked lightcurve |
|---|---|---|---|---|---|---|---|
| A | 7586 | 6337 | 0 | 0 | 0.00% | 0.00% | 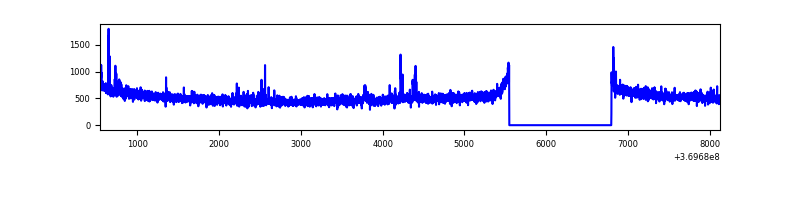 |
| B | 7586 | 6337 | 131 | 131 | 1.73% | 2.07% | 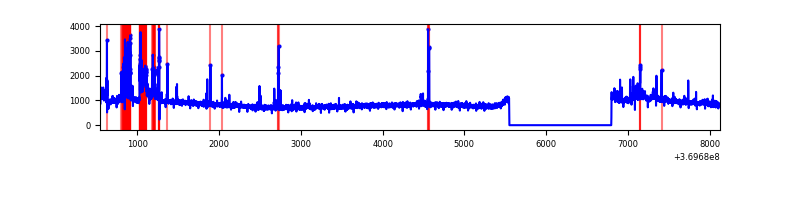 |
| C | 7586 | 6337 | 83 | 83 | 1.09% | 1.31% | 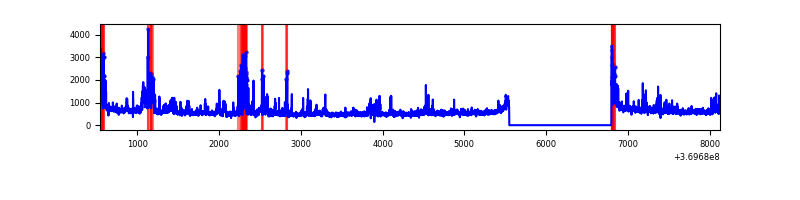 |
| D | 7586 | 6337 | 139 | 139 | 1.83% | 2.19% | 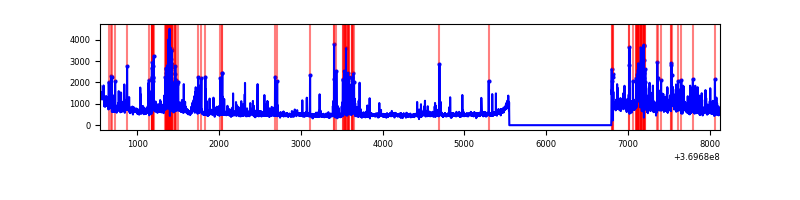 |
Top three noisy pixels from each quadrant. If the there are fewer than three noisy pixels in the level2.evt file, extra rows are filled as -1
| Pixel properties | Quadrant properties | ||||||
|---|---|---|---|---|---|---|---|
| Quadrant | DetID | PixID | Counts | Sigma | Mean | Median | Sigma |
| A | 12 | 189 | 53382 | 322.83 | 824 | 807 | 162.9 |
| A | 0 | 6 | 29258 | 174.7 | 824 | 807 | 162.9 |
| A | 13 | 6 | 17176 | 100.51 | 824 | 807 | 162.9 |
| B | 6 | 159 | 2085231 | 13799.21 | 812 | 792 | 151.1 |
| B | 5 | 172 | 390949 | 2582.88 | 812 | 792 | 151.1 |
| B | 0 | 168 | 64574 | 422.24 | 812 | 792 | 151.1 |
| C | 3 | 233 | 426182 | 2334.87 | 787 | 795 | 182.2 |
| C | 15 | 208 | 225753 | 1234.75 | 787 | 795 | 182.2 |
| C | 0 | 10 | 195920 | 1071.0 | 787 | 795 | 182.2 |
| D | 8 | 195 | 546111 | 2928.5 | 793 | 772 | 186.2 |
| D | 13 | 249 | 337700 | 1809.32 | 793 | 772 | 186.2 |
| D | 12 | 218 | 184091 | 984.43 | 793 | 772 | 186.2 |
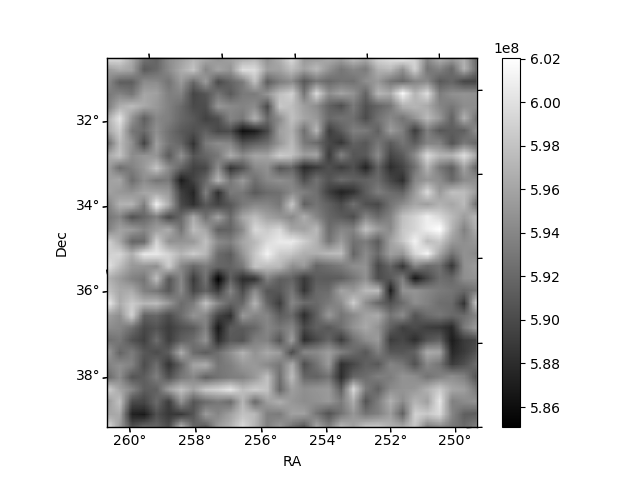
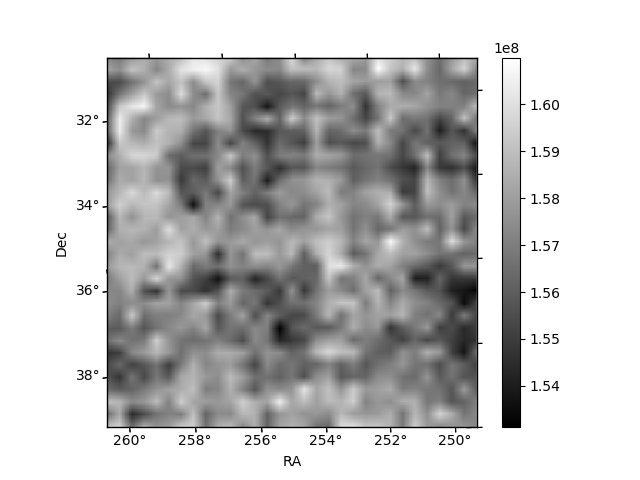
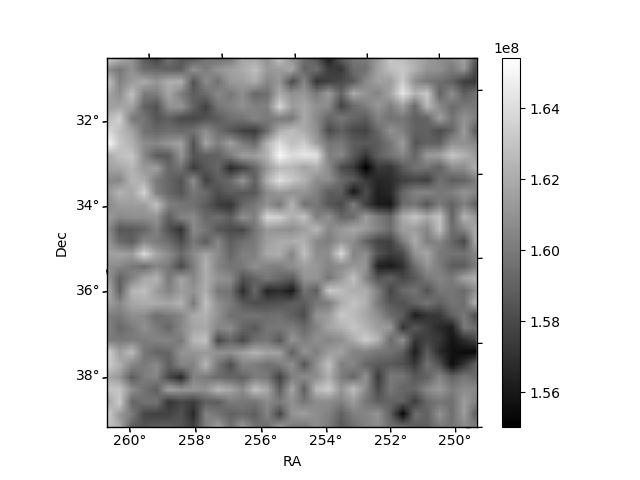
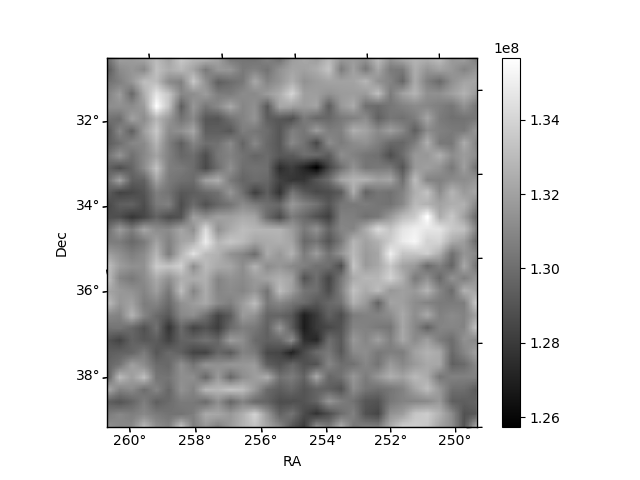
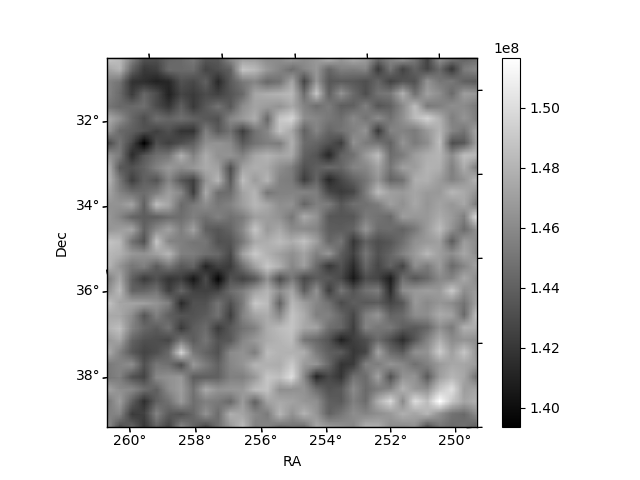
Histogram calculated using DETX and DETY for each event in the final _common_clean file
| Quadrant A | 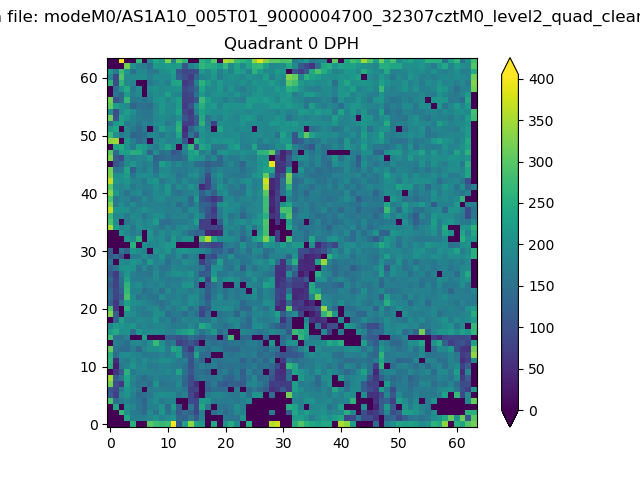 |
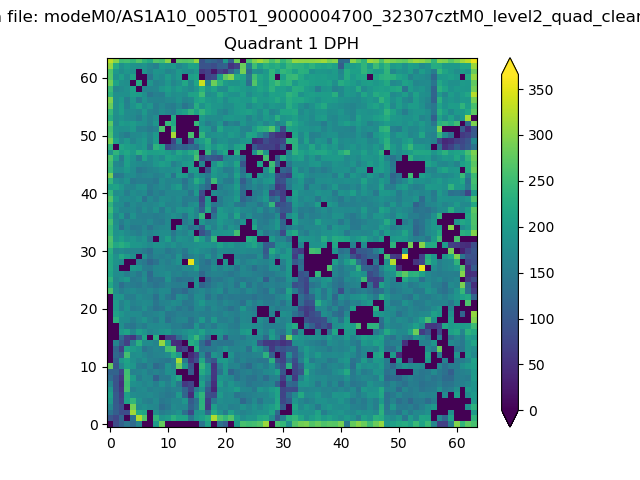 |
Quadrant B |
|---|---|---|---|
| Quadrant D | 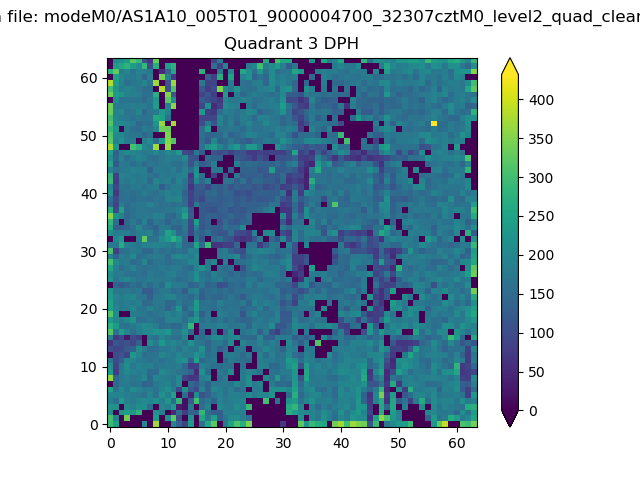 |
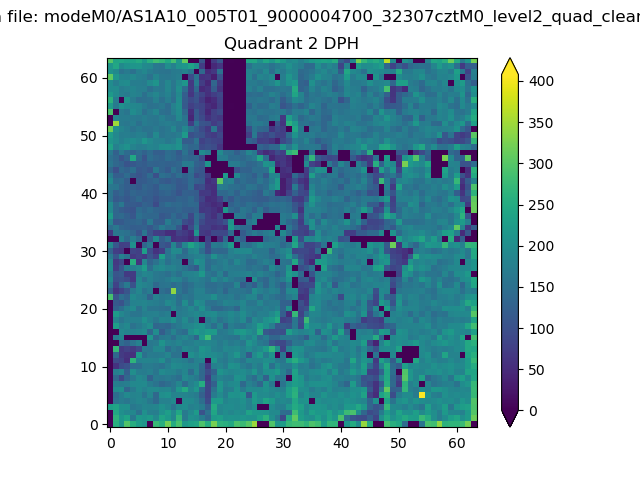 |
Quadrant C |
| Plot type | Count rate plots | Images |
|---|---|---|
| Comparison with Poisson distribution Blue bars denote a histogram of data divided into 1 sec bins. Red curve is a Poisson curve with rate = median count rate of data. |
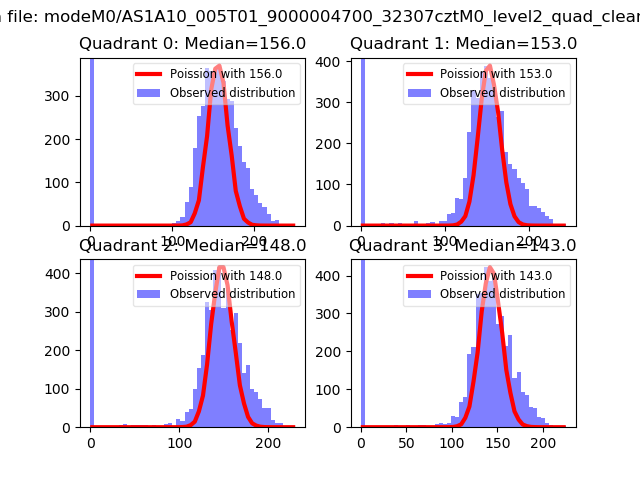 |
 |
| Quadrant-wise count rates Data is divided into 100 sec bins |
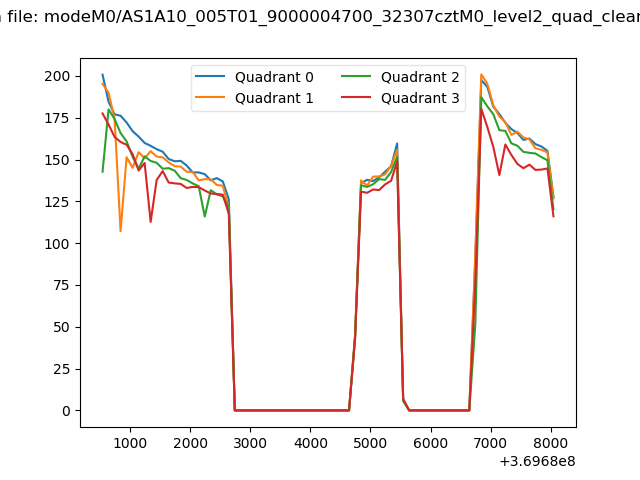 |
|
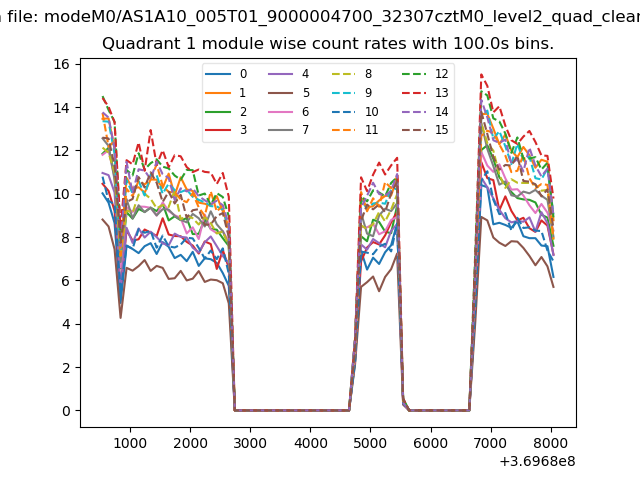
| Module-wise count rates for Quadrant A Data is divided into 100 sec bins |
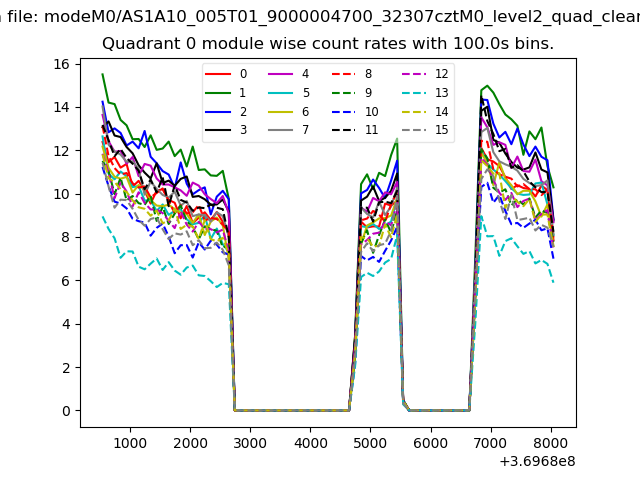 |
 |
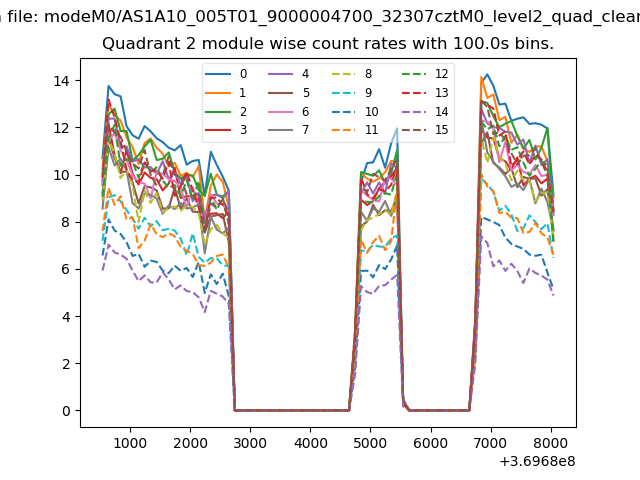
| Module-wise count rates for Quadrant B Data is divided into 100 sec bins |
 |
 |
| Module-wise count rates for Quadrant C Data is divided into 100 sec bins |
 |
 |
| Module-wise count rates for Quadrant D Data is divided into 100 sec bins |
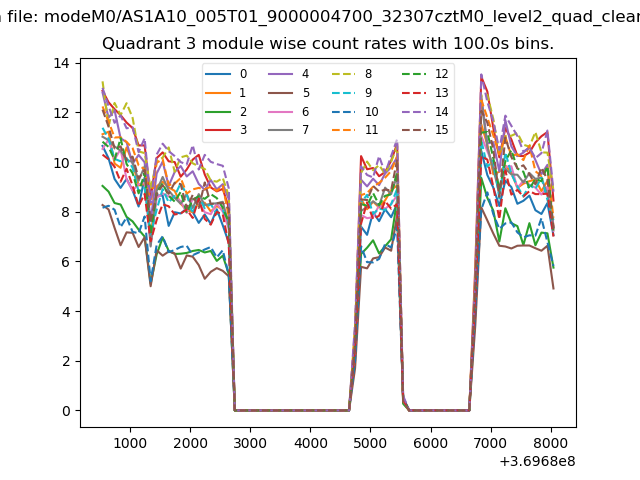 |
 |
| Parameter | Plot |
|---|---|
| CZT HV Monitor | 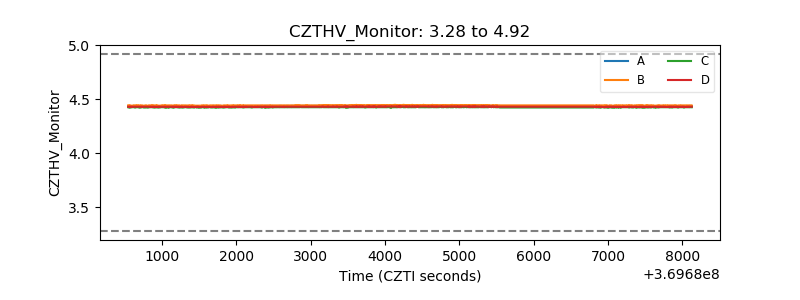 |
| D_VDD | 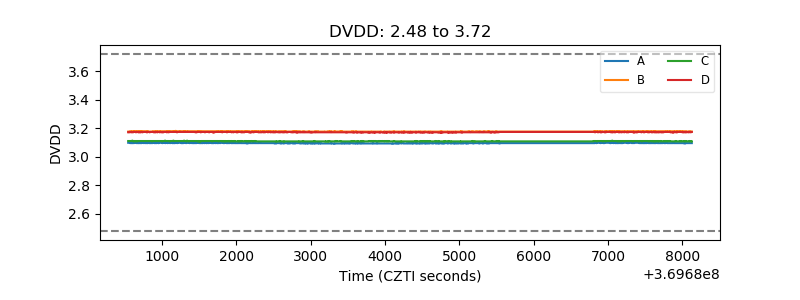 |
| Temperature 1 | 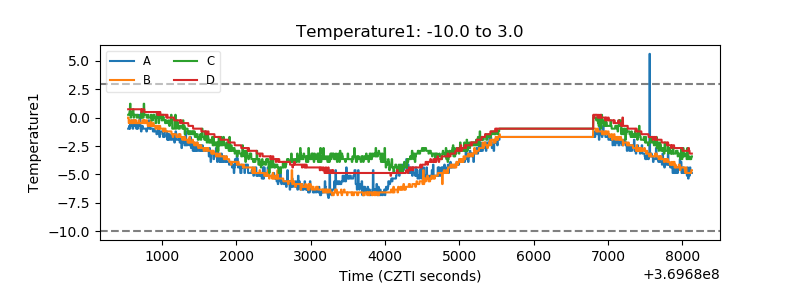 |
| Veto HV Monitor | 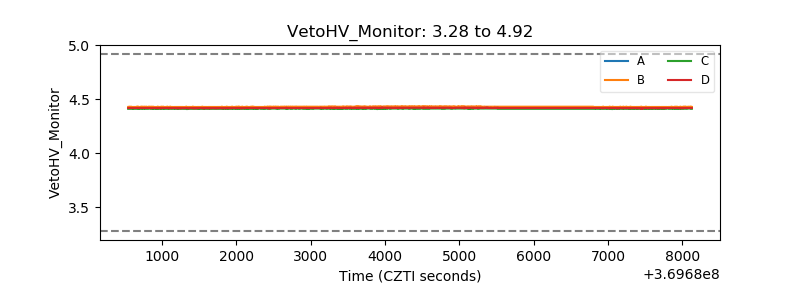 |
| Veto LLD | 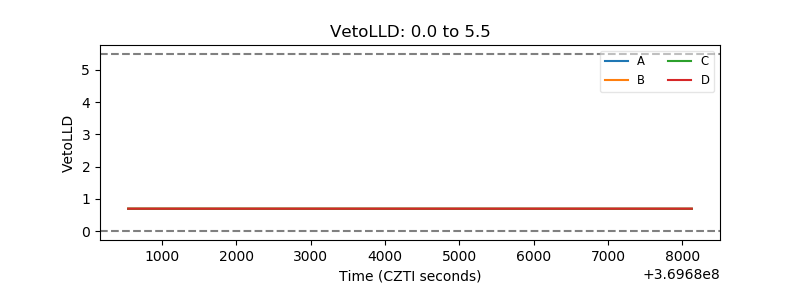 |
| Alpha Counter | 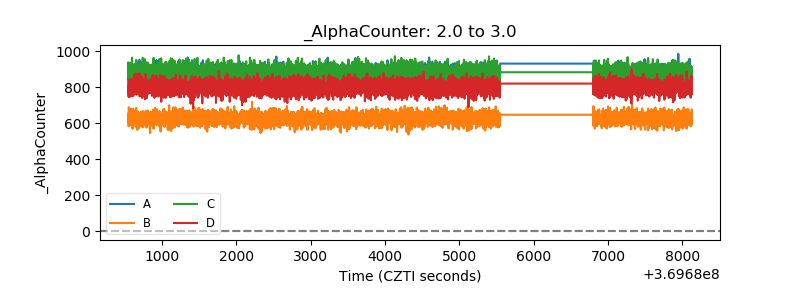 |
| _CPM_Rate | 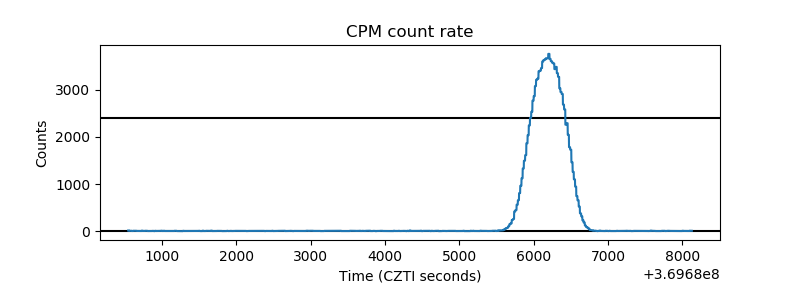 |
| CZT Counter | 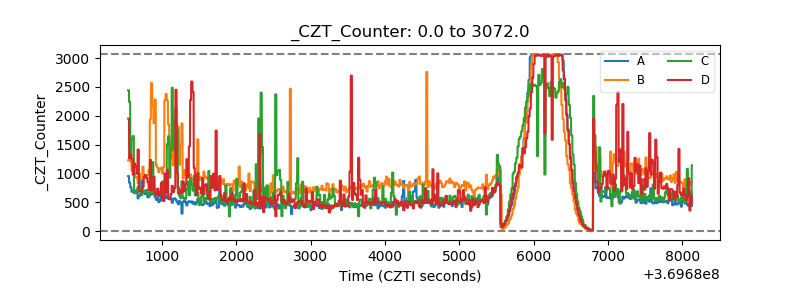 |
| +2.5 Volts monitor |  |
| +5 Volts monitor |  |
| _ROLL_ROT | 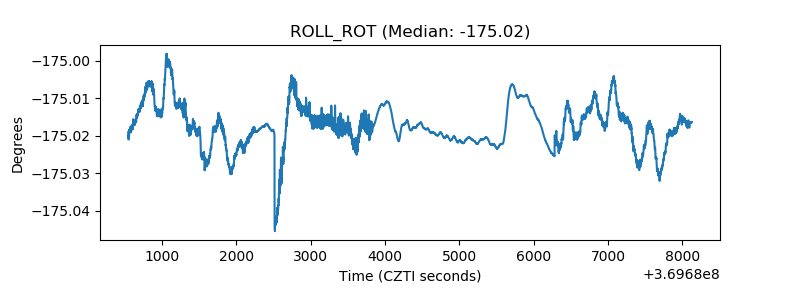 |
| _Roll_DEC | 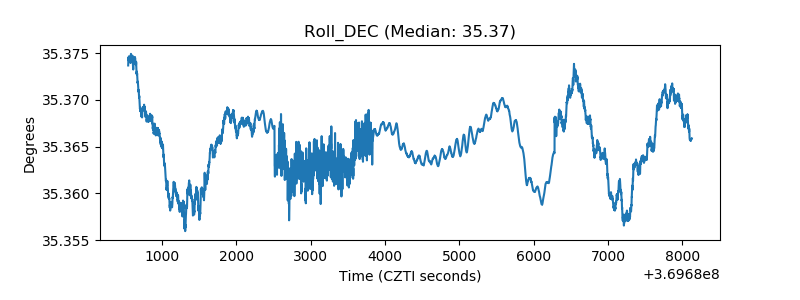 |
| _Roll_RA | 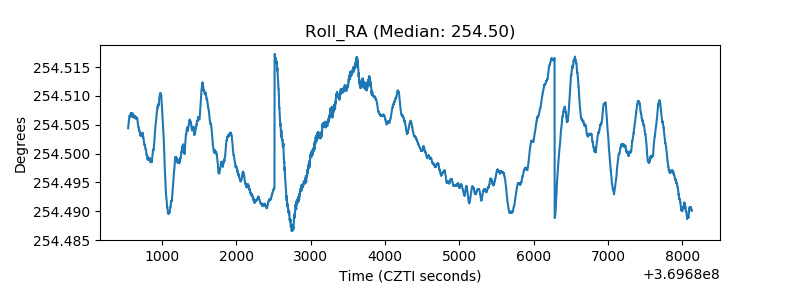 |
| Veto Counter | 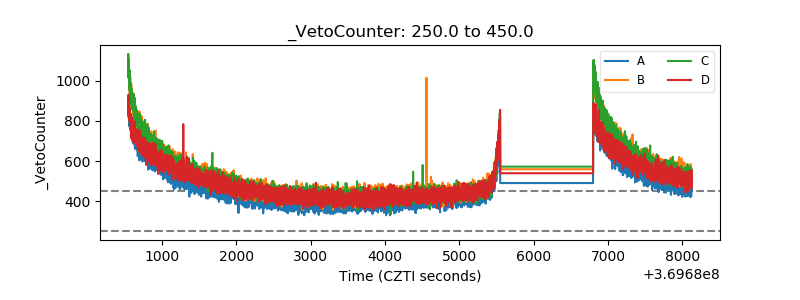 |