| Param | Original file | Final file |
|---|---|---|
| Filename | modeM0/AS1A10_005T01_9000004700_32308cztM0_level2.evt | modeM0/AS1A10_005T01_9000004700_32308cztM0_level2_quad_clean.evt |
| Size (bytes) | 619,715,520 | 98,340,480 |
| Size | 591.0 MB | 93.8 MB |
| Events in quadrant A | 3,282,988 | 661,529 |
| Events in quadrant B | 5,490,593 | 662,732 |
| Events in quadrant C | 4,026,560 | 626,275 |
| Events in quadrant D | 5,550,448 | 595,557 |
| Mode M0 | |||
|---|---|---|---|
| Quadrant | BADHDUFLAG | Total packets | Discarded packets |
| A | 0 | 13606 | 3 |
| B | 0 | 20614 | 2 |
| C | 0 | 16065 | 2 |
| D | 0 | 20784 | 2 |
| Mode M9 | |||
|---|---|---|---|
| Quadrant | BADHDUFLAG | Total packets | Discarded packets |
| A | 0 | 14 | 0 |
| B | 0 | 14 | 0 |
| C | 0 | 14 | 0 |
| D | 0 | 15 | 0 |
| Mode SS | |||
|---|---|---|---|
| Quadrant | BADHDUFLAG | Total packets | Discarded packets |
| A | 0 | 124 | 0 |
| B | 0 | 124 | 0 |
| C | 0 | 124 | 0 |
| D | 0 | 124 | 0 |
| Quadrant | Total seconds | Saturated seconds | Saturation percentage |
|---|---|---|---|
| A | 6193 | 32 | 0.516712% |
| B | 6193 | 101 | 1.630874% |
| C | 6193 | 248 | 4.004521% |
| D | 6193 | 275 | 4.440497% |
Noise dominated data is calculated using 1-second bins in cleaned event files. If a bin has >2000 counts, and if more than 50% of those come from <1% of pixels, then it is considered to be noise-dominated and hence unusable.
| Quadrant | # 1 sec bins | Bins with >0 counts | Bins with >2000 counts | High rate bins dominated by noise | Noise dominated (total time) | Noise dominated (detector-on time) | Marked lightcurve |
|---|---|---|---|---|---|---|---|
| A | 7523 | 6194 | 9 | 9 | 0.12% | 0.15% | 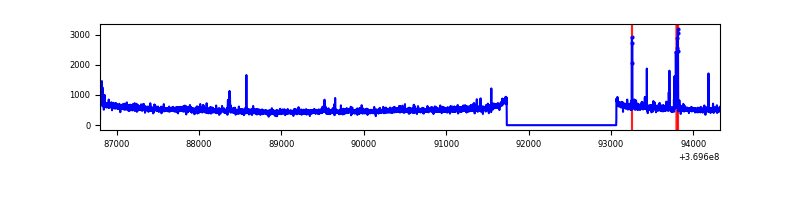 |
| B | 7523 | 6194 | 8 | 8 | 0.11% | 0.13% | 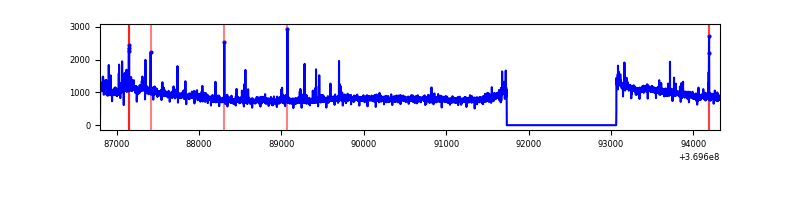 |
| C | 7523 | 6194 | 44 | 44 | 0.58% | 0.71% | 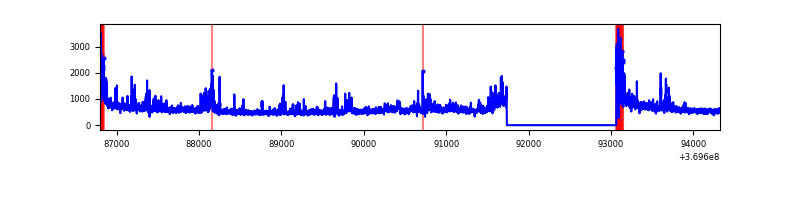 |
| D | 7523 | 6194 | 198 | 198 | 2.63% | 3.20% | 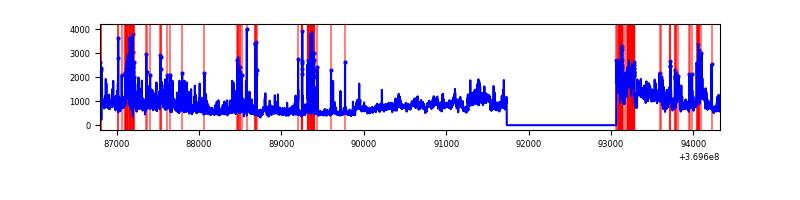 |
Top three noisy pixels from each quadrant. If the there are fewer than three noisy pixels in the level2.evt file, extra rows are filled as -1
| Pixel properties | Quadrant properties | ||||||
|---|---|---|---|---|---|---|---|
| Quadrant | DetID | PixID | Counts | Sigma | Mean | Median | Sigma |
| A | 0 | 6 | 71843 | 440.18 | 812 | 797 | 161.4 |
| A | 12 | 189 | 33186 | 200.67 | 812 | 797 | 161.4 |
| A | 13 | 6 | 23284 | 139.32 | 812 | 797 | 161.4 |
| B | 6 | 159 | 1965547 | 13049.84 | 814 | 795 | 150.6 |
| B | 0 | 168 | 189738 | 1254.95 | 814 | 795 | 150.6 |
| B | 4 | 80 | 60844 | 398.84 | 814 | 795 | 150.6 |
| C | 3 | 233 | 536764 | 2958.43 | 782 | 788 | 181.2 |
| C | 0 | 10 | 200832 | 1104.18 | 782 | 788 | 181.2 |
| C | 14 | 238 | 132276 | 725.78 | 782 | 788 | 181.2 |
| D | 8 | 195 | 1652854 | 8947.4 | 777 | 758 | 184.6 |
| D | 13 | 249 | 381249 | 2060.66 | 777 | 758 | 184.6 |
| D | 14 | 52 | 173765 | 936.97 | 777 | 758 | 184.6 |
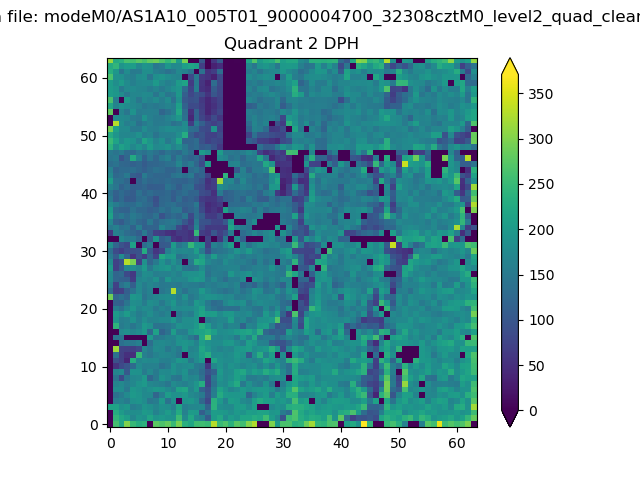
Histogram calculated using DETX and DETY for each event in the final _common_clean file
| Quadrant A | 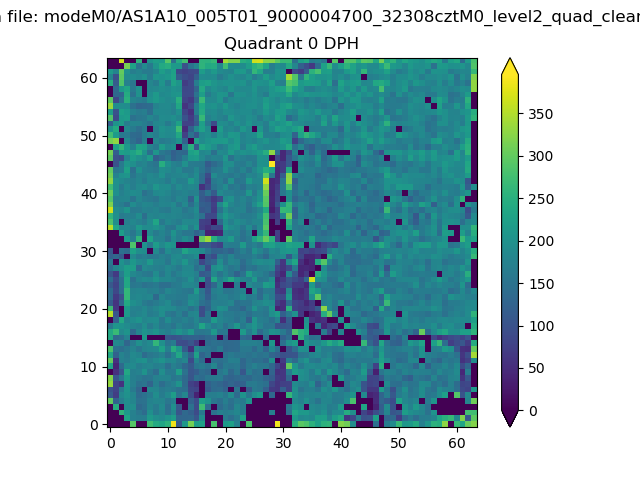 |
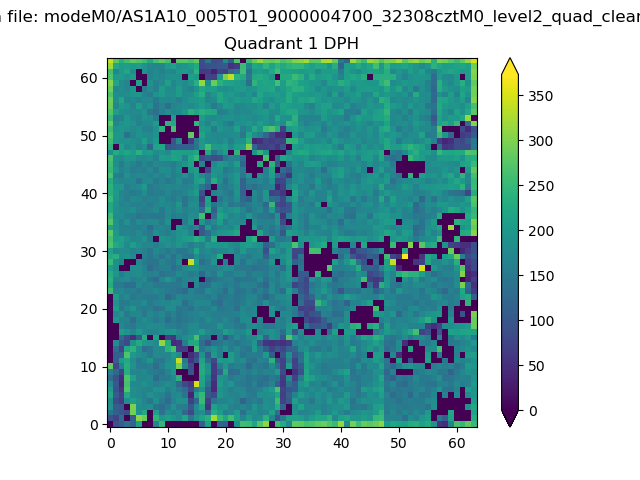 |
Quadrant B |
|---|---|---|---|
| Quadrant D | 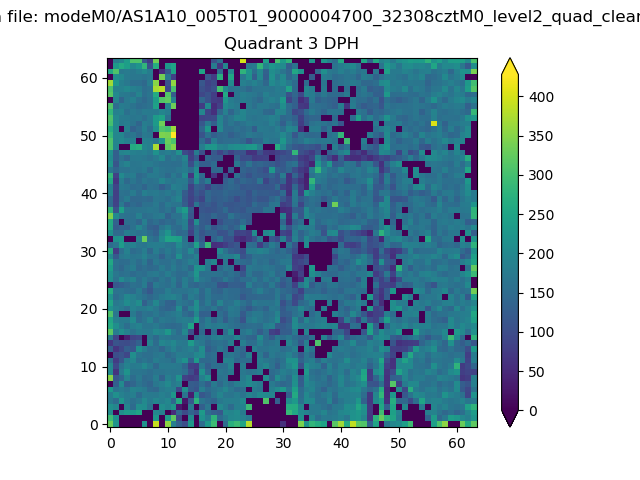 |
 |
Quadrant C |
| Plot type | Count rate plots | Images |
|---|---|---|
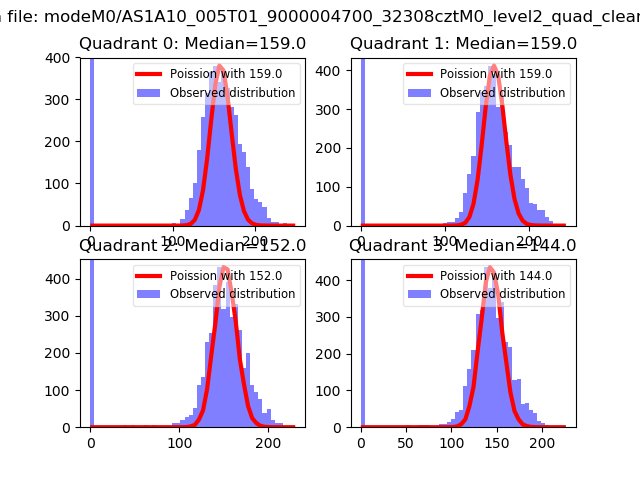
| Comparison with Poisson distribution Blue bars denote a histogram of data divided into 1 sec bins. Red curve is a Poisson curve with rate = median count rate of data. |
 |
 |
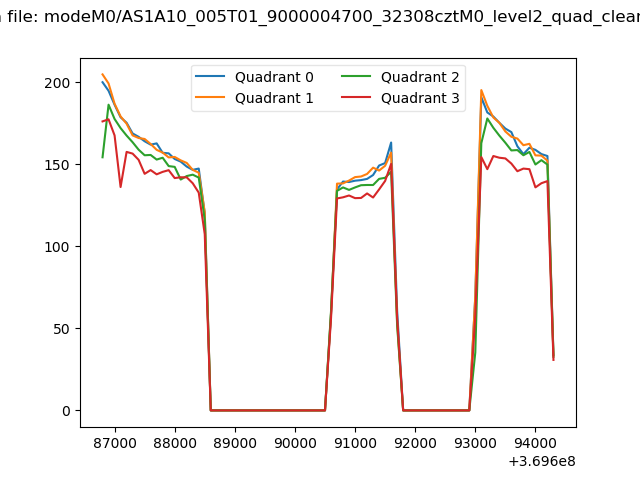
| Quadrant-wise count rates Data is divided into 100 sec bins |
 |
|
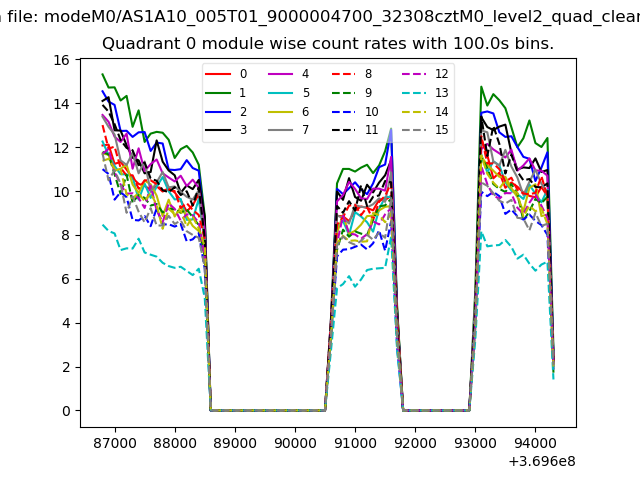
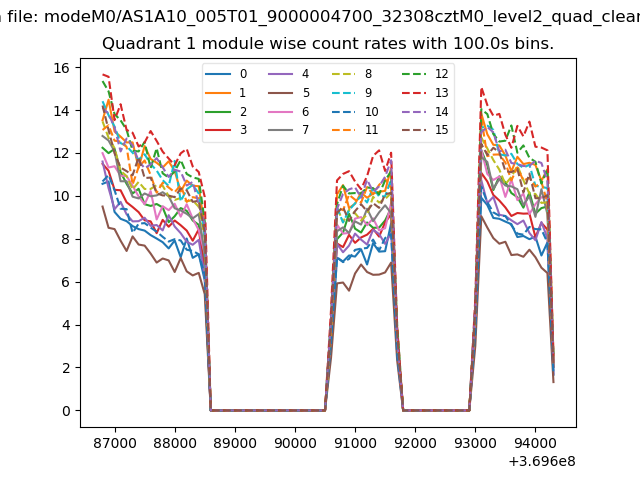
| Module-wise count rates for Quadrant A Data is divided into 100 sec bins |
 |
 |
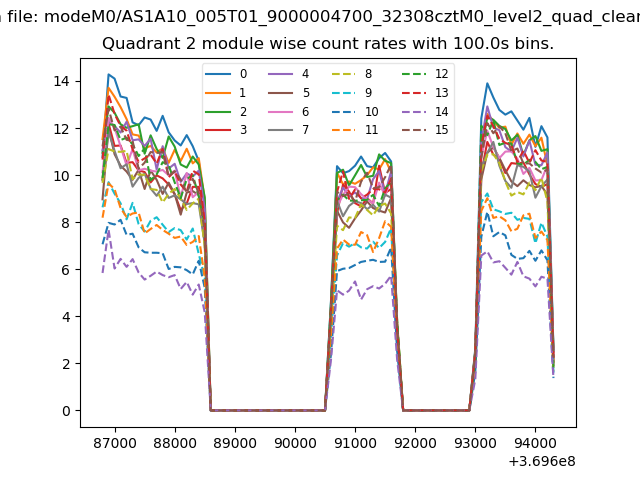
| Module-wise count rates for Quadrant B Data is divided into 100 sec bins |
 |
 |
| Module-wise count rates for Quadrant C Data is divided into 100 sec bins |
 |
 |
| Module-wise count rates for Quadrant D Data is divided into 100 sec bins |
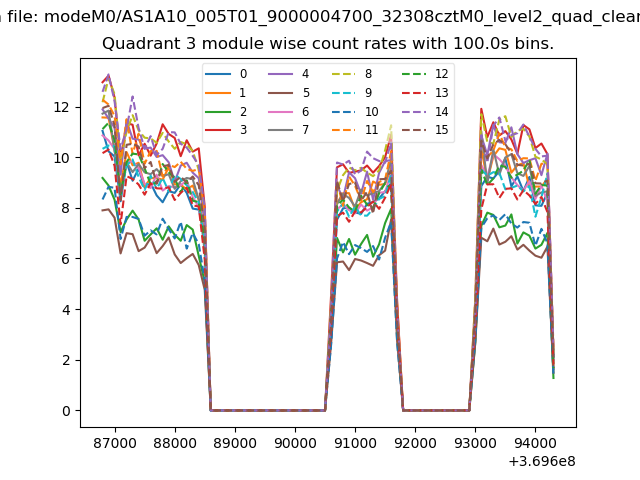 |
 |
| Parameter | Plot |
|---|---|
| CZT HV Monitor | 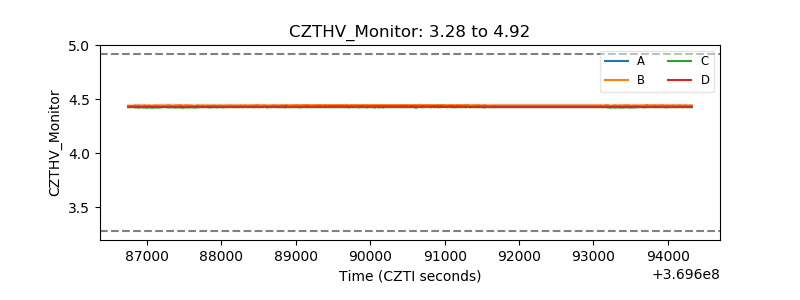 |
| D_VDD | 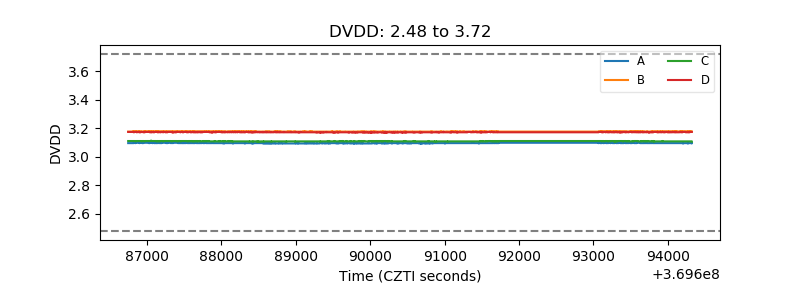 |
| Temperature 1 | 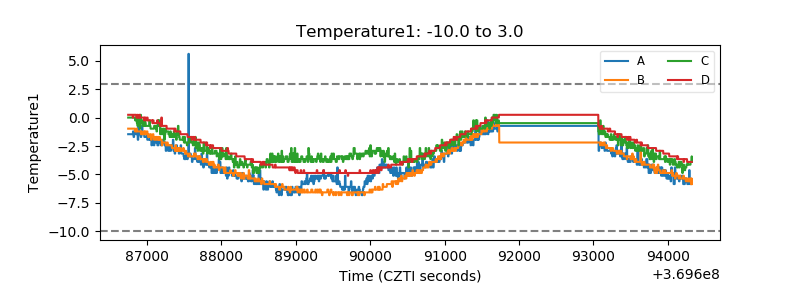 |
| Veto HV Monitor | 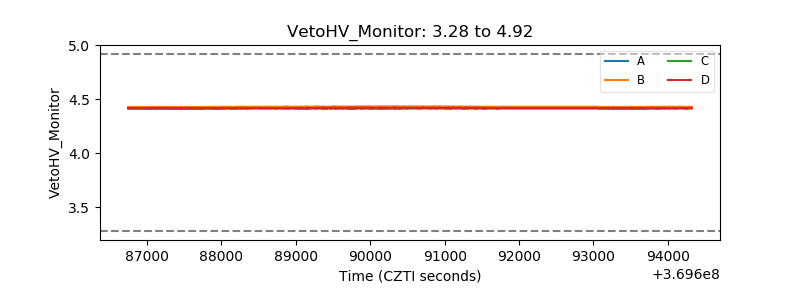 |
| Veto LLD | 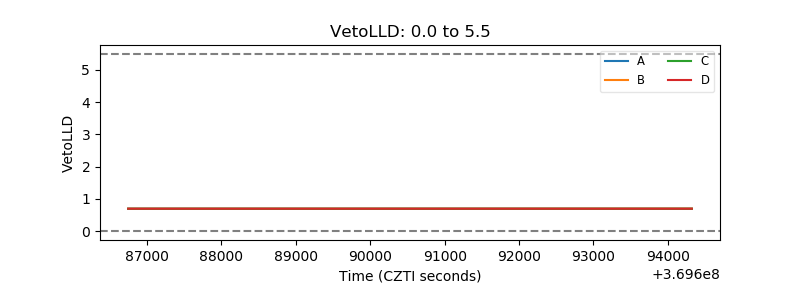 |
| Alpha Counter | 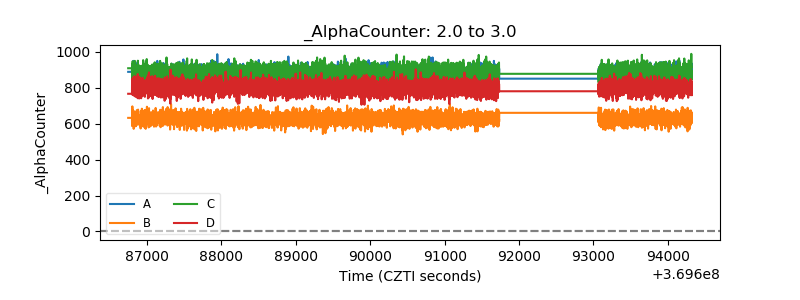 |
| _CPM_Rate | 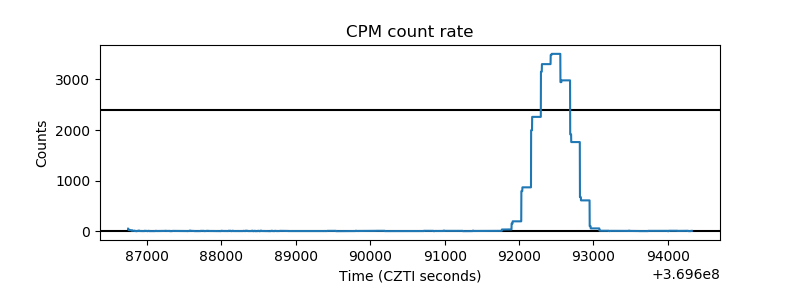 |
| CZT Counter |  |
| +2.5 Volts monitor |  |
| +5 Volts monitor |  |
| _ROLL_ROT | 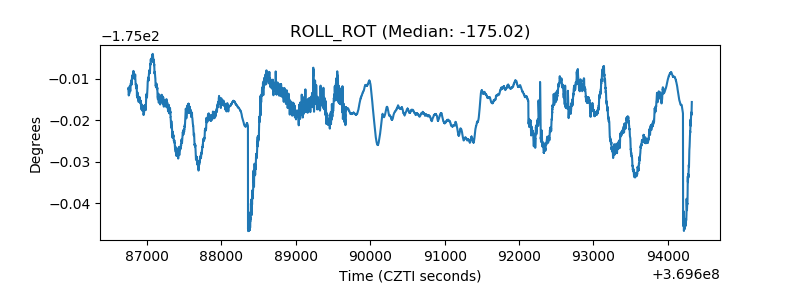 |
| _Roll_DEC | 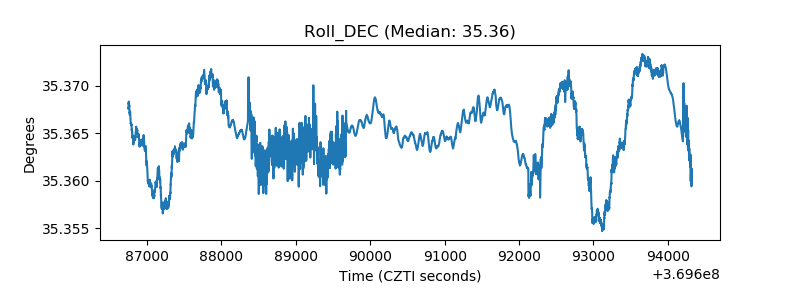 |
| _Roll_RA | 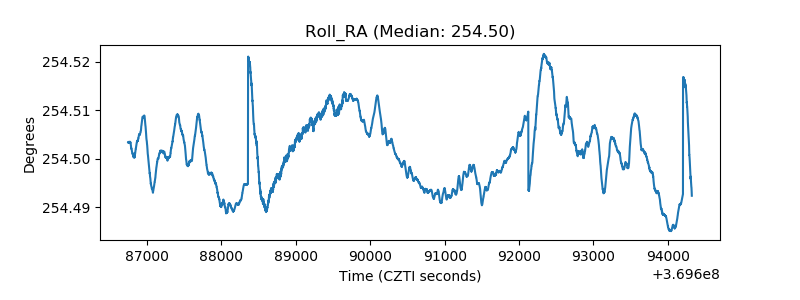 |
| Veto Counter | 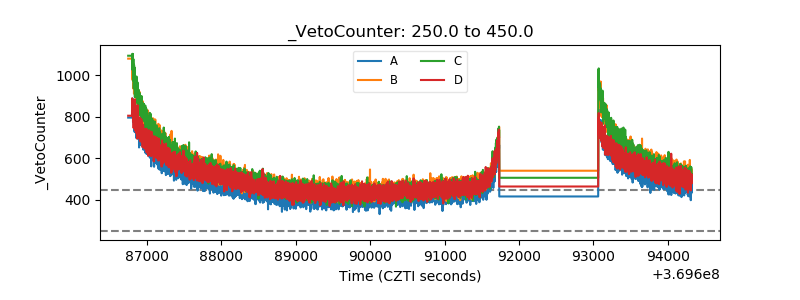 |