| Param | Original file | Final file |
|---|---|---|
| Filename | modeM0/AS1A10_005T01_9000004700_32310cztM0_level2.evt | modeM0/AS1A10_005T01_9000004700_32310cztM0_level2_quad_clean.evt |
| Size (bytes) | 663,612,480 | 81,190,080 |
| Size | 632.9 MB | 77.4 MB |
| Events in quadrant A | 3,300,810 | 523,455 |
| Events in quadrant B | 5,794,806 | 514,898 |
| Events in quadrant C | 4,315,507 | 484,273 |
| Events in quadrant D | 6,238,528 | 473,057 |
| Mode M0 | |||
|---|---|---|---|
| Quadrant | BADHDUFLAG | Total packets | Discarded packets |
| A | 0 | 13867 | 3 |
| B | 0 | 21898 | 2 |
| C | 0 | 16943 | 2 |
| D | 0 | 23072 | 2 |
| Mode M9 | |||
|---|---|---|---|
| Quadrant | BADHDUFLAG | Total packets | Discarded packets |
| A | 0 | 19 | 0 |
| B | 0 | 19 | 0 |
| C | 0 | 19 | 0 |
| D | 0 | 20 | 0 |
| Mode SS | |||
|---|---|---|---|
| Quadrant | BADHDUFLAG | Total packets | Discarded packets |
| A | 0 | 136 | 0 |
| B | 0 | 136 | 0 |
| C | 0 | 136 | 0 |
| D | 0 | 136 | 0 |
| Quadrant | Total seconds | Saturated seconds | Saturation percentage |
|---|---|---|---|
| A | 6632 | 28 | 0.422195% |
| B | 6632 | 156 | 2.352232% |
| C | 6632 | 325 | 4.900483% |
| D | 6632 | 401 | 6.046441% |
Noise dominated data is calculated using 1-second bins in cleaned event files. If a bin has >2000 counts, and if more than 50% of those come from <1% of pixels, then it is considered to be noise-dominated and hence unusable.
| Quadrant | # 1 sec bins | Bins with >0 counts | Bins with >2000 counts | High rate bins dominated by noise | Noise dominated (total time) | Noise dominated (detector-on time) | Marked lightcurve |
|---|---|---|---|---|---|---|---|
| A | 7868 | 6633 | 3 | 3 | 0.04% | 0.05% | 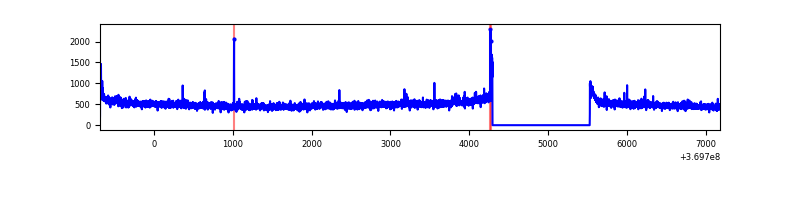 |
| B | 7868 | 6633 | 34 | 34 | 0.43% | 0.51% | 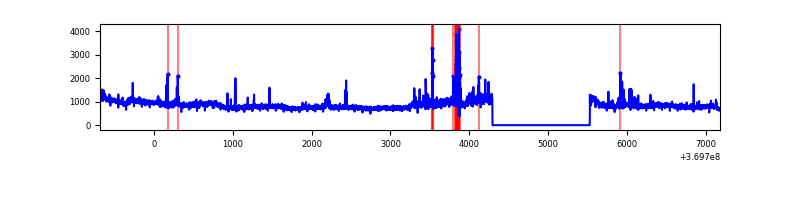 |
| C | 7868 | 6633 | 166 | 166 | 2.11% | 2.50% | 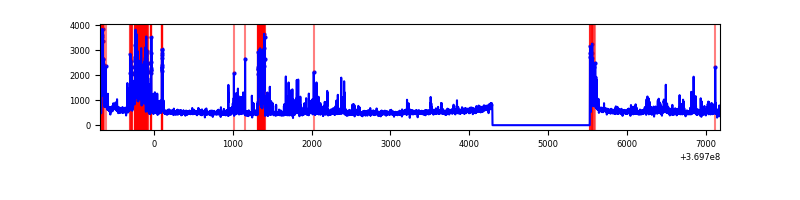 |
| D | 7868 | 6633 | 319 | 319 | 4.05% | 4.81% | 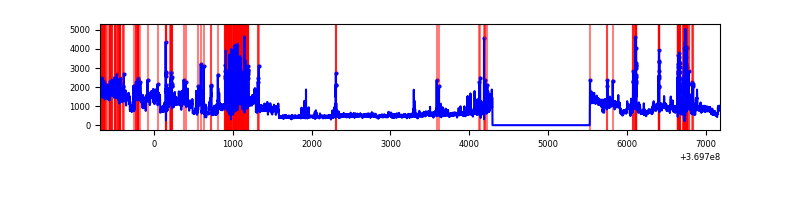 |
Top three noisy pixels from each quadrant. If the there are fewer than three noisy pixels in the level2.evt file, extra rows are filled as -1
| Pixel properties | Quadrant properties | ||||||
|---|---|---|---|---|---|---|---|
| Quadrant | DetID | PixID | Counts | Sigma | Mean | Median | Sigma |
| A | 0 | 6 | 25482 | 146.35 | 838 | 823 | 168.5 |
| A | 13 | 6 | 22331 | 127.64 | 838 | 823 | 168.5 |
| A | 13 | 254 | 12699 | 70.48 | 838 | 823 | 168.5 |
| B | 6 | 159 | 1938427 | 12464.27 | 832 | 814 | 155.5 |
| B | 0 | 168 | 293868 | 1885.16 | 832 | 814 | 155.5 |
| B | 5 | 172 | 165188 | 1057.38 | 832 | 814 | 155.5 |
| C | 15 | 208 | 654160 | 3541.94 | 794 | 800 | 184.5 |
| C | 0 | 10 | 180325 | 973.23 | 794 | 800 | 184.5 |
| C | 3 | 233 | 167112 | 901.6 | 794 | 800 | 184.5 |
| D | 8 | 195 | 2128784 | 11308.94 | 787 | 767 | 188.2 |
| D | 13 | 249 | 776032 | 4120.0 | 787 | 767 | 188.2 |
| D | 14 | 52 | 172354 | 911.87 | 787 | 767 | 188.2 |
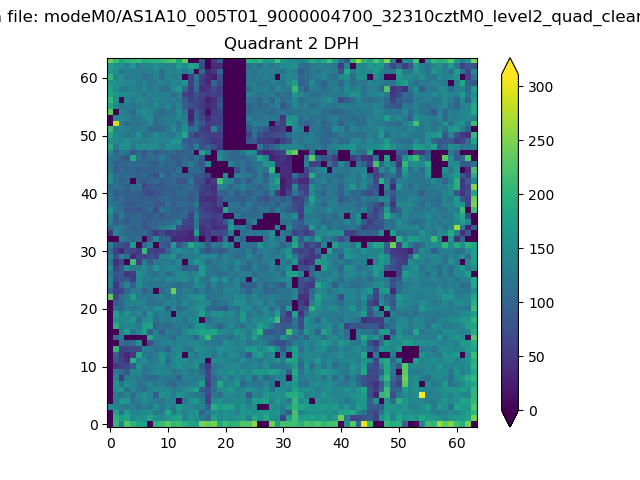
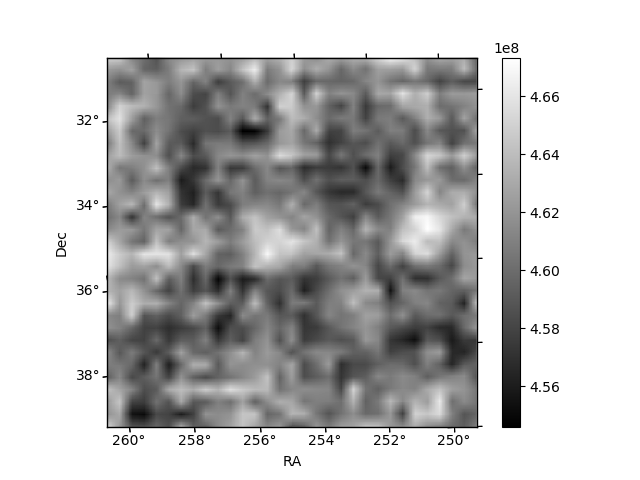
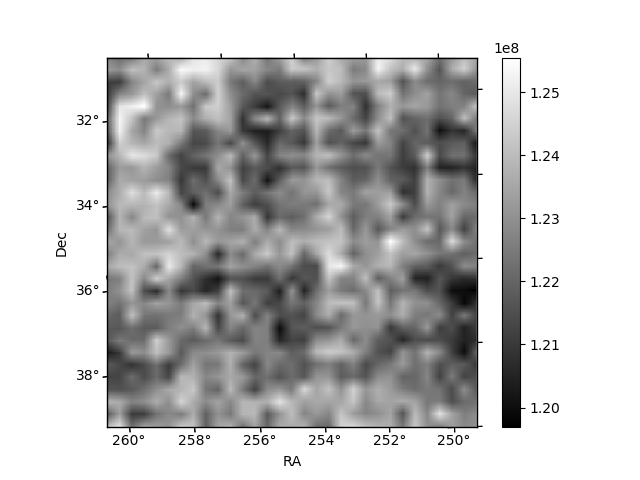
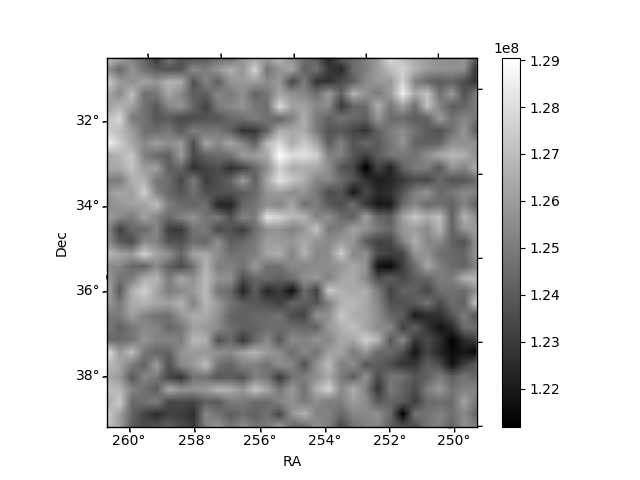
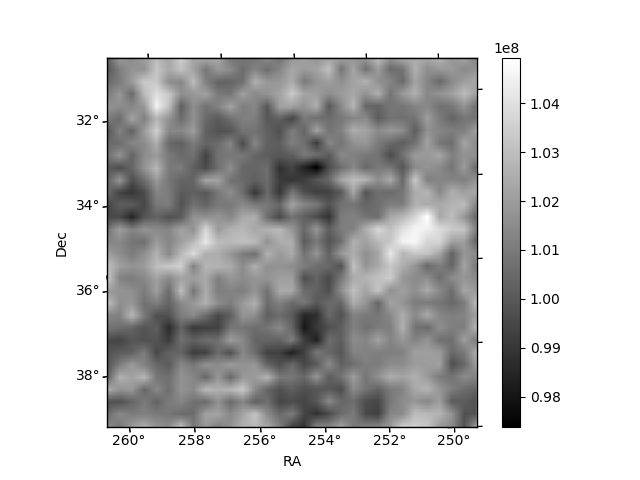
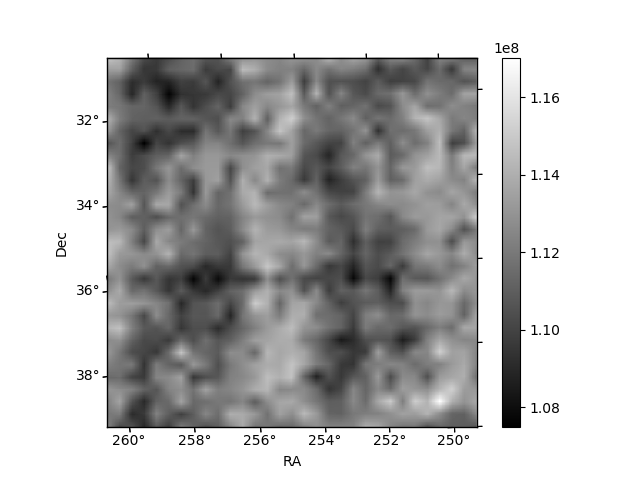
Histogram calculated using DETX and DETY for each event in the final _common_clean file
| Quadrant A | 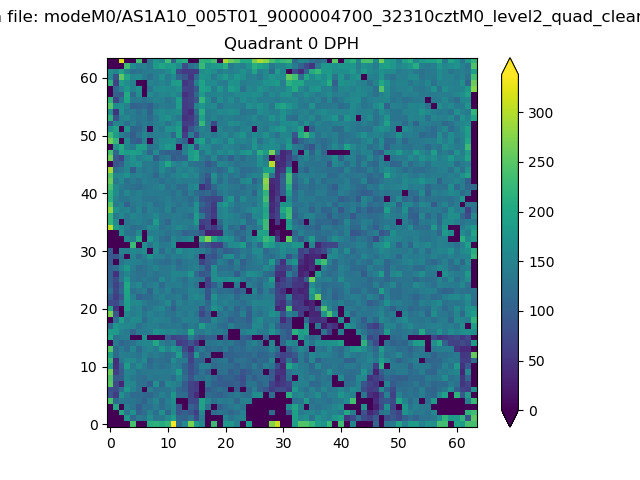 |
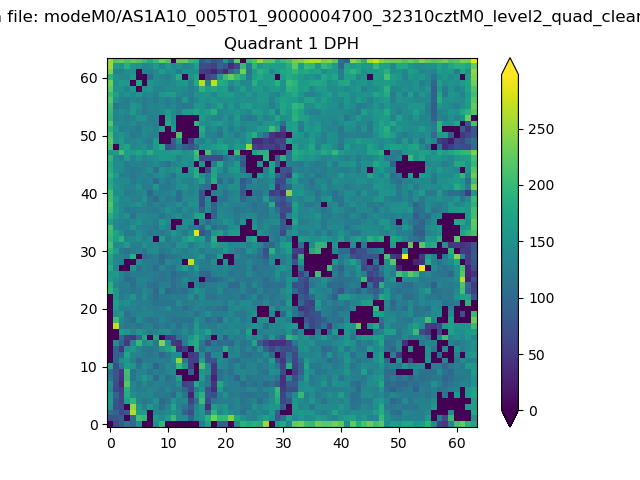 |
Quadrant B |
|---|---|---|---|
| Quadrant D | 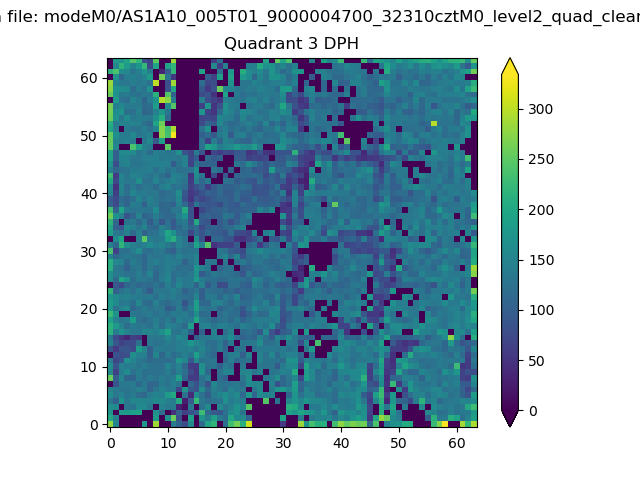 |
 |
Quadrant C |
| Plot type | Count rate plots | Images |
|---|---|---|
| Comparison with Poisson distribution Blue bars denote a histogram of data divided into 1 sec bins. Red curve is a Poisson curve with rate = median count rate of data. |
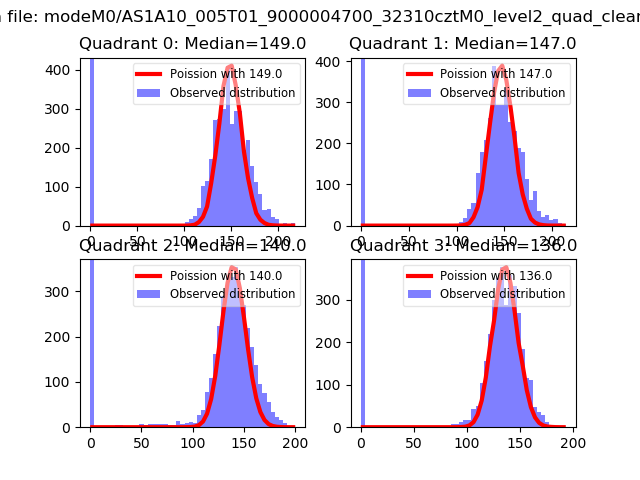 |
 |
| Quadrant-wise count rates Data is divided into 100 sec bins |
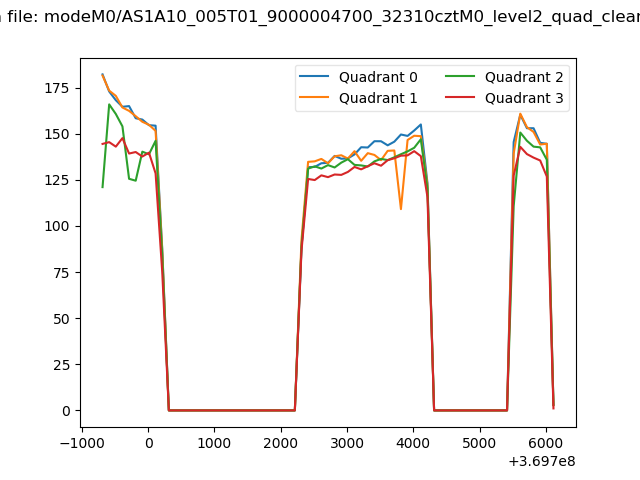 |
|
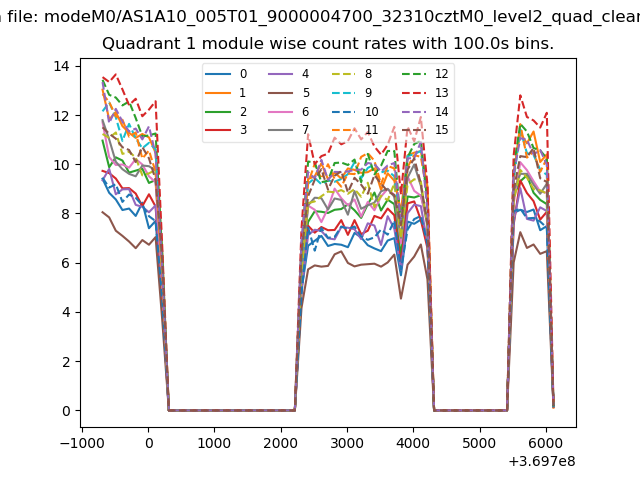
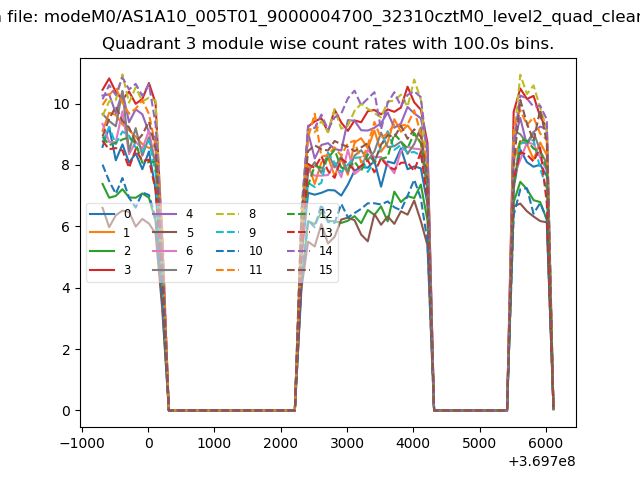
| Module-wise count rates for Quadrant A Data is divided into 100 sec bins |
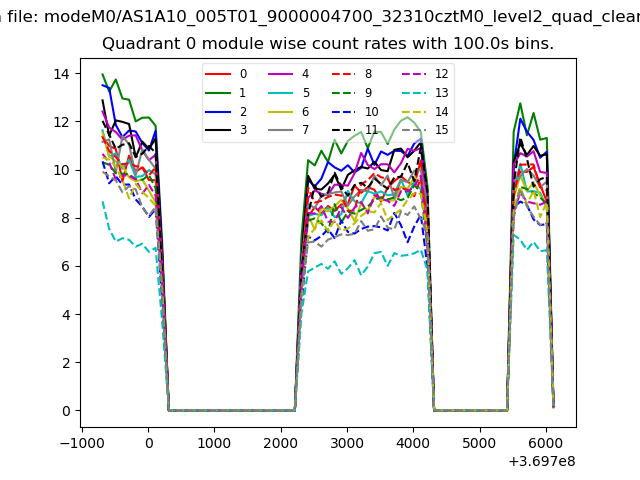 |
 |
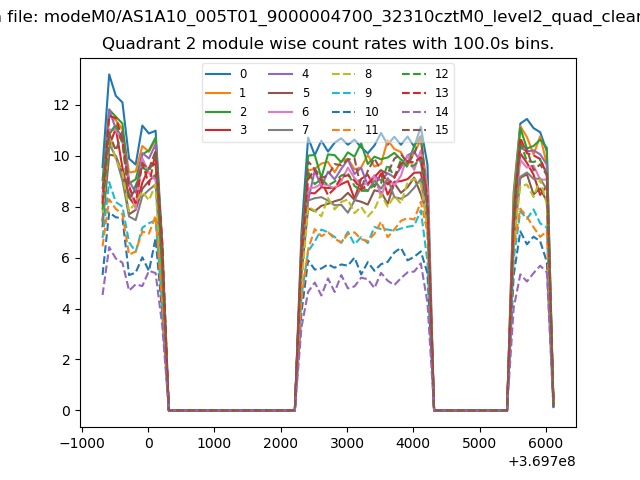
| Module-wise count rates for Quadrant B Data is divided into 100 sec bins |
 |
 |
| Module-wise count rates for Quadrant C Data is divided into 100 sec bins |
 |
 |
| Module-wise count rates for Quadrant D Data is divided into 100 sec bins |
 |
 |
| Parameter | Plot |
|---|---|
| CZT HV Monitor | 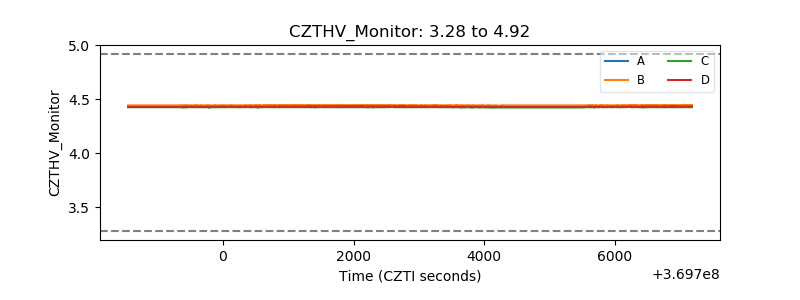 |
| D_VDD | 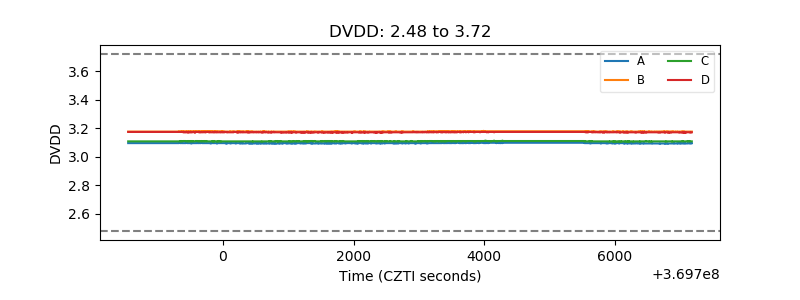 |
| Temperature 1 | 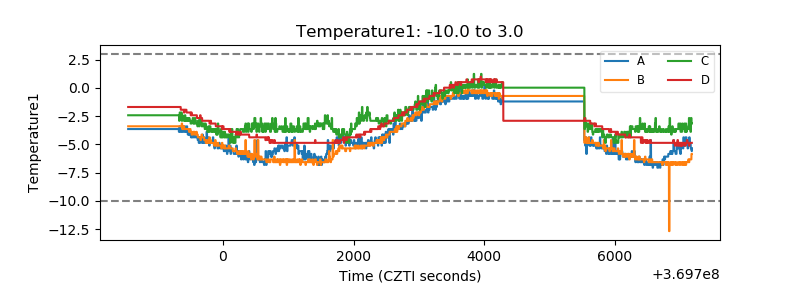 |
| Veto HV Monitor | 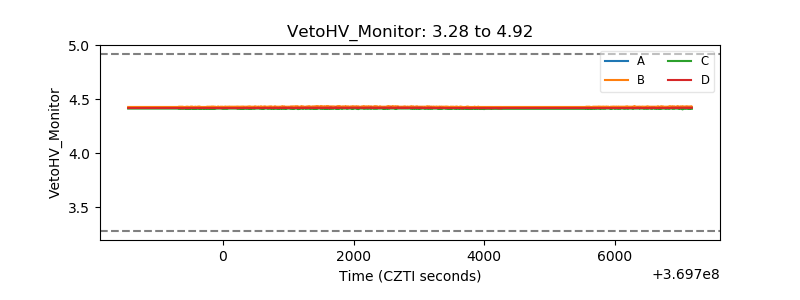 |
| Veto LLD | 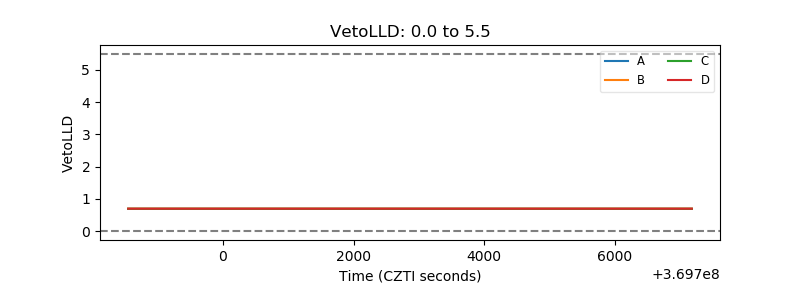 |
| Alpha Counter | 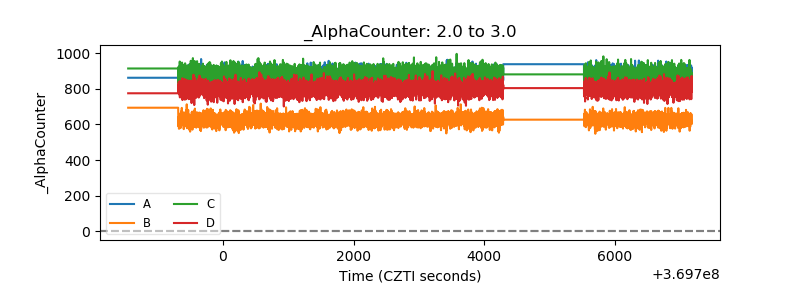 |
| _CPM_Rate | 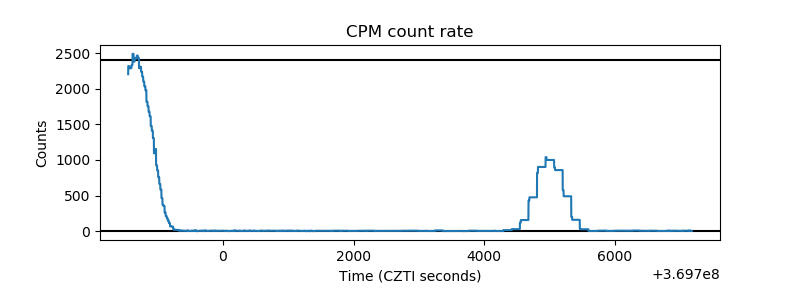 |
| CZT Counter | 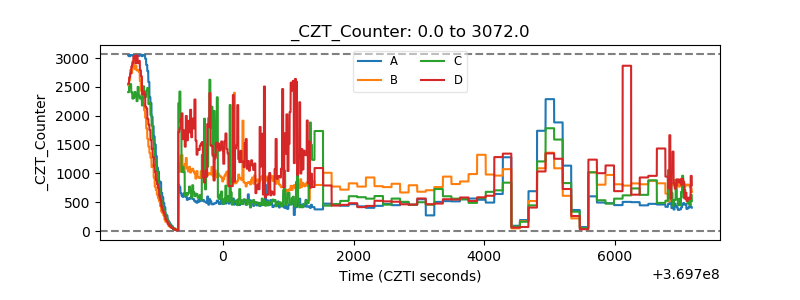 |
| +2.5 Volts monitor |  |
| +5 Volts monitor | 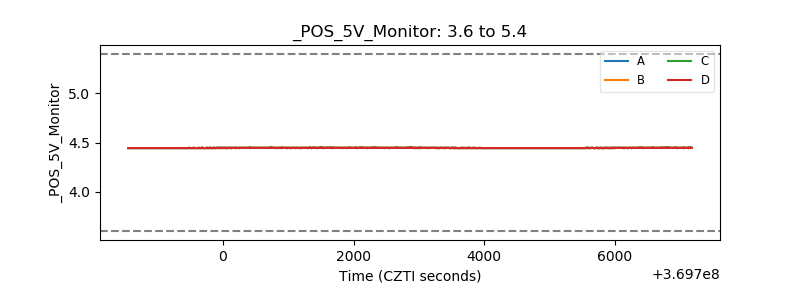 |
| _ROLL_ROT | 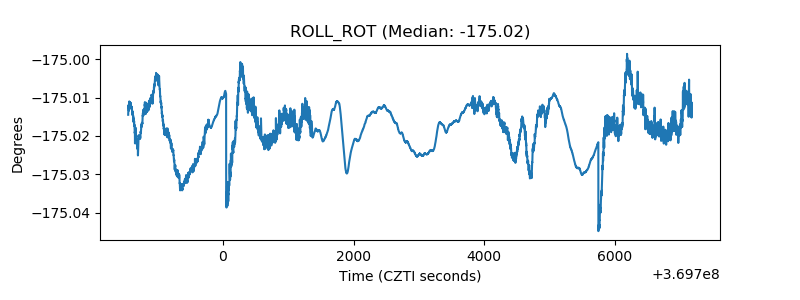 |
| _Roll_DEC | 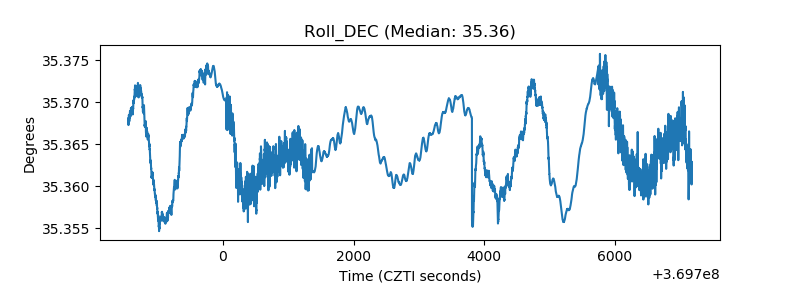 |
| _Roll_RA | 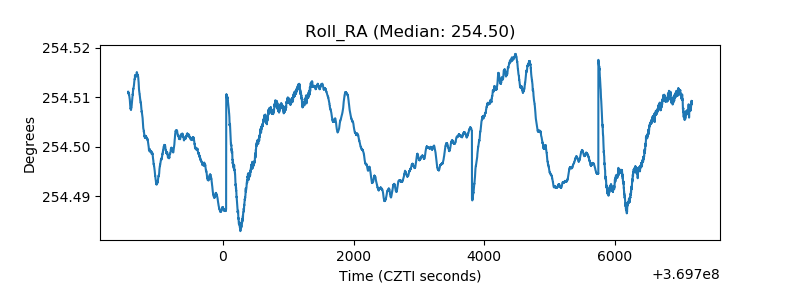 |
| Veto Counter | 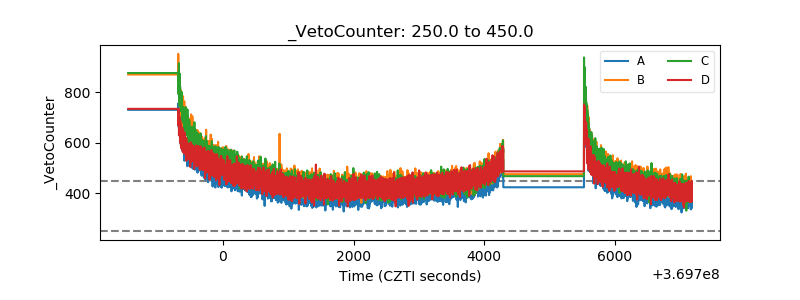 |