| Param | Original file | Final file |
|---|---|---|
| Filename | modeM0/AS1A10_005T01_9000004700_32311cztM0_level2.evt | modeM0/AS1A10_005T01_9000004700_32311cztM0_level2_quad_clean.evt |
| Size (bytes) | 619,583,040 | 68,734,080 |
| Size | 590.9 MB | 65.5 MB |
| Events in quadrant A | 3,263,771 | 446,642 |
| Events in quadrant B | 5,622,291 | 435,010 |
| Events in quadrant C | 4,088,421 | 315,833 |
| Events in quadrant D | 5,333,102 | 413,612 |
| Mode M0 | |||
|---|---|---|---|
| Quadrant | BADHDUFLAG | Total packets | Discarded packets |
| A | 0 | 13959 | 2 |
| B | 0 | 21417 | 1 |
| C | 0 | 16456 | 1 |
| D | 0 | 20508 | 1 |
| Mode M9 | |||
|---|---|---|---|
| Quadrant | BADHDUFLAG | Total packets | Discarded packets |
| A | 0 | 9 | 0 |
| B | 0 | 9 | 0 |
| C | 0 | 9 | 0 |
| D | 0 | 9 | 0 |
| Mode SS | |||
|---|---|---|---|
| Quadrant | BADHDUFLAG | Total packets | Discarded packets |
| A | 0 | 136 | 0 |
| B | 0 | 136 | 0 |
| C | 0 | 136 | 0 |
| D | 0 | 136 | 0 |
| Quadrant | Total seconds | Saturated seconds | Saturation percentage |
|---|---|---|---|
| A | 6735 | 58 | 0.861173% |
| B | 6735 | 182 | 2.702301% |
| C | 6735 | 1668 | 24.766147% |
| D | 6735 | 252 | 3.741648% |
Noise dominated data is calculated using 1-second bins in cleaned event files. If a bin has >2000 counts, and if more than 50% of those come from <1% of pixels, then it is considered to be noise-dominated and hence unusable.
| Quadrant | # 1 sec bins | Bins with >0 counts | Bins with >2000 counts | High rate bins dominated by noise | Noise dominated (total time) | Noise dominated (detector-on time) | Marked lightcurve |
|---|---|---|---|---|---|---|---|
| A | 7655 | 6736 | 2 | 2 | 0.03% | 0.03% | 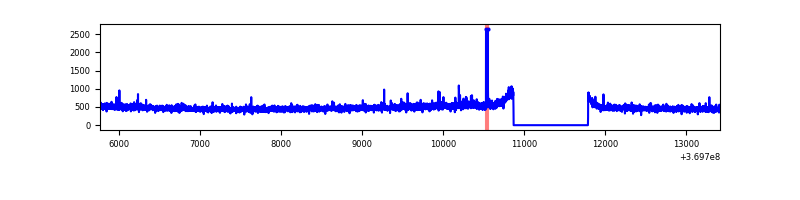 |
| B | 7655 | 6736 | 48 | 48 | 0.63% | 0.71% | 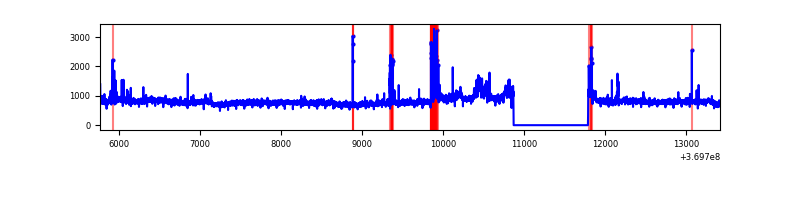 |
| C | 7655 | 6732 | 16 | 16 | 0.21% | 0.24% | 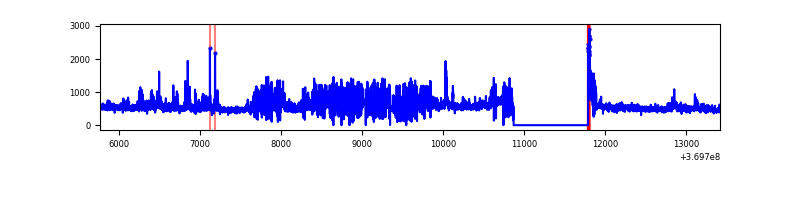 |
| D | 7655 | 6736 | 175 | 175 | 2.29% | 2.60% | 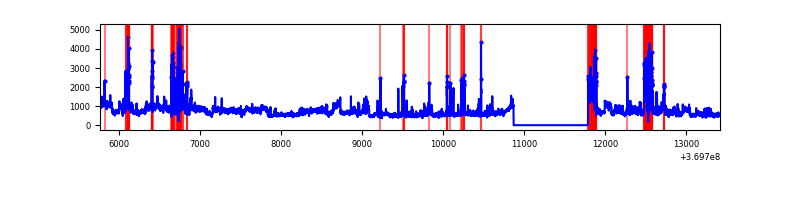 |
Top three noisy pixels from each quadrant. If the there are fewer than three noisy pixels in the level2.evt file, extra rows are filled as -1
| Pixel properties | Quadrant properties | ||||||
|---|---|---|---|---|---|---|---|
| Quadrant | DetID | PixID | Counts | Sigma | Mean | Median | Sigma |
| A | 9 | 143 | 22656 | 132.18 | 827 | 809 | 165.3 |
| A | 13 | 6 | 19171 | 111.1 | 827 | 809 | 165.3 |
| A | 0 | 6 | 16295 | 93.7 | 827 | 809 | 165.3 |
| B | 6 | 159 | 2007587 | 12845.07 | 817 | 797 | 156.2 |
| B | 5 | 172 | 157437 | 1002.62 | 817 | 797 | 156.2 |
| B | 0 | 190 | 118053 | 750.53 | 817 | 797 | 156.2 |
| C | 14 | 254 | 540315 | 3361.74 | 680 | 685 | 160.5 |
| C | 14 | 238 | 494300 | 3075.08 | 680 | 685 | 160.5 |
| C | 3 | 233 | 184354 | 1144.2 | 680 | 685 | 160.5 |
| D | 8 | 195 | 1619957 | 8671.18 | 785 | 765 | 186.7 |
| D | 13 | 249 | 633592 | 3388.94 | 785 | 765 | 186.7 |
| D | 2 | 234 | 29801 | 155.49 | 785 | 765 | 186.7 |
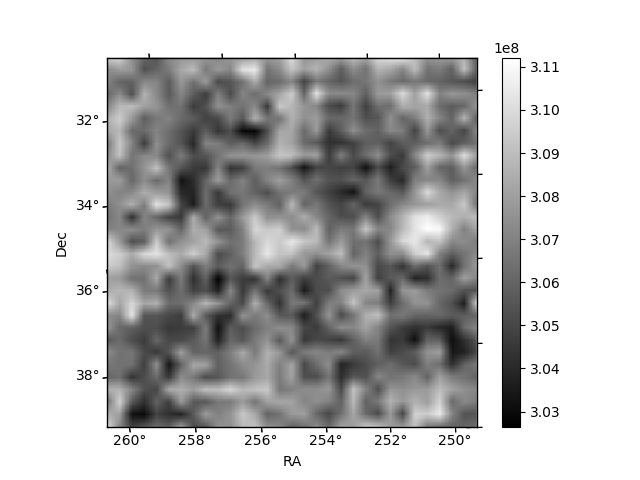
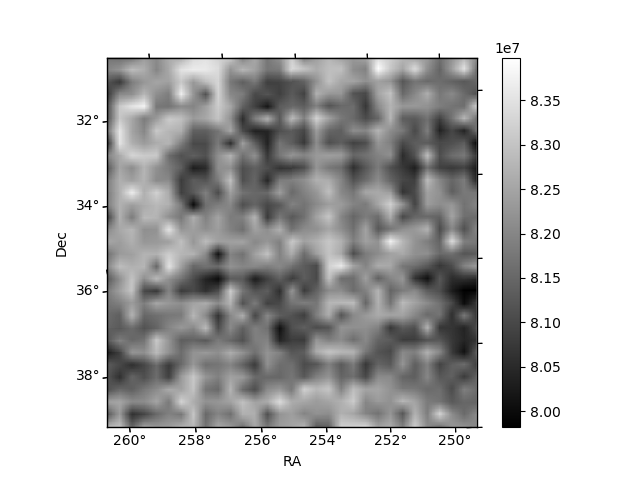
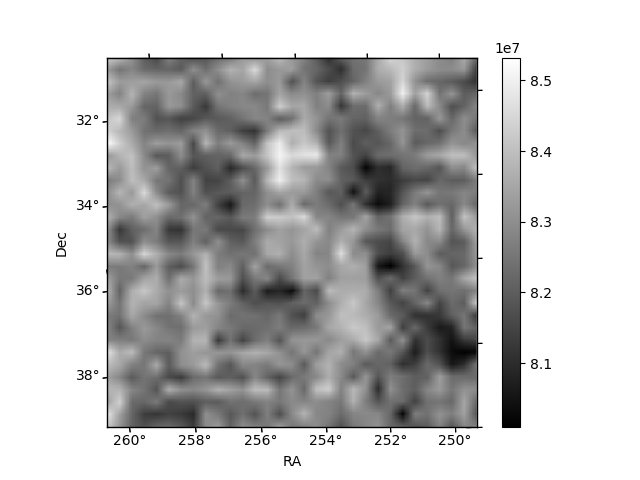
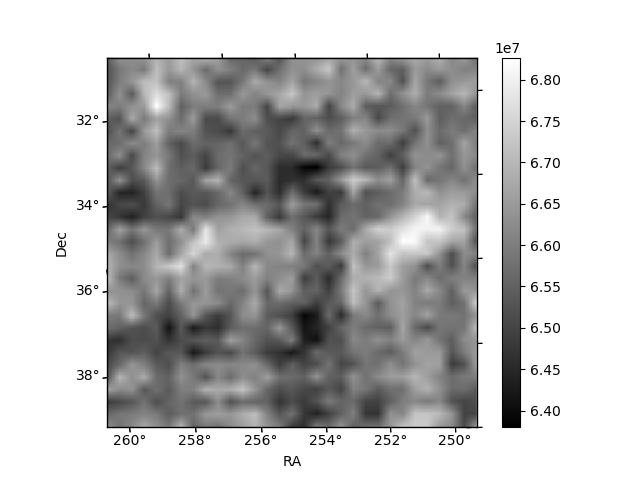
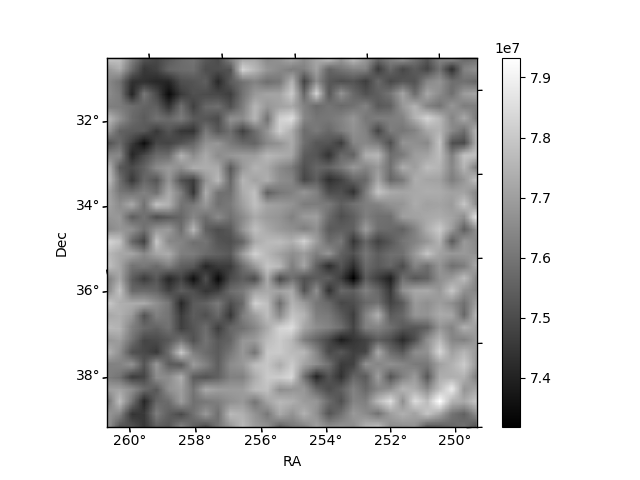
Histogram calculated using DETX and DETY for each event in the final _common_clean file
| Quadrant A | 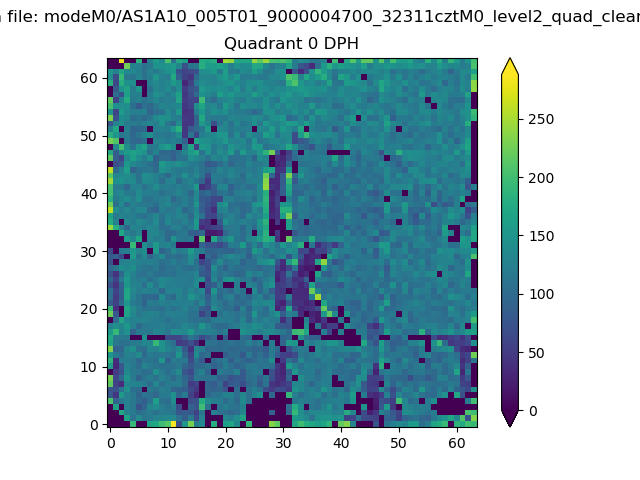 |
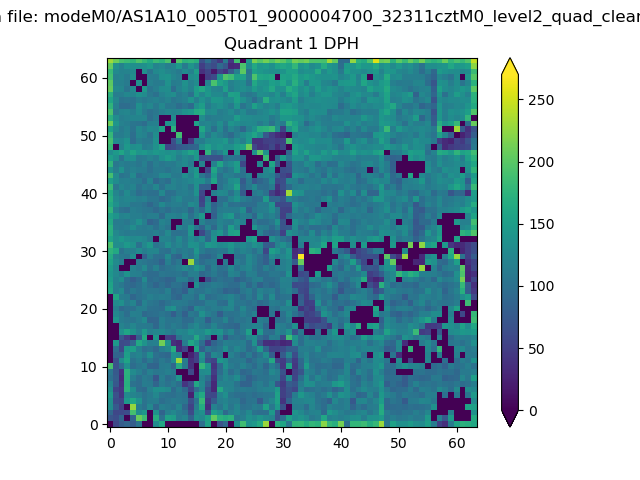 |
Quadrant B |
|---|---|---|---|
| Quadrant D | 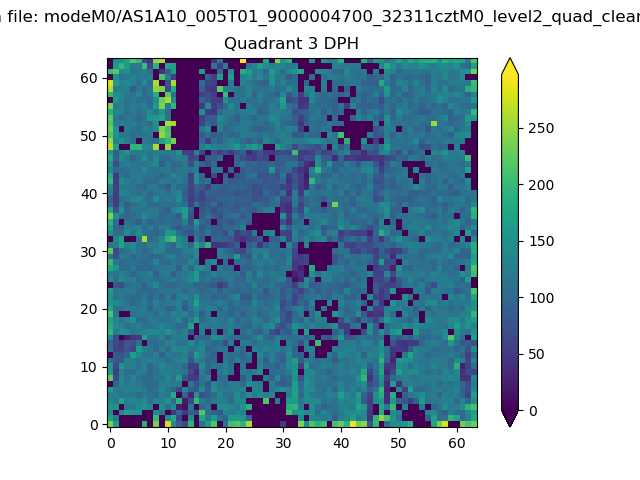 |
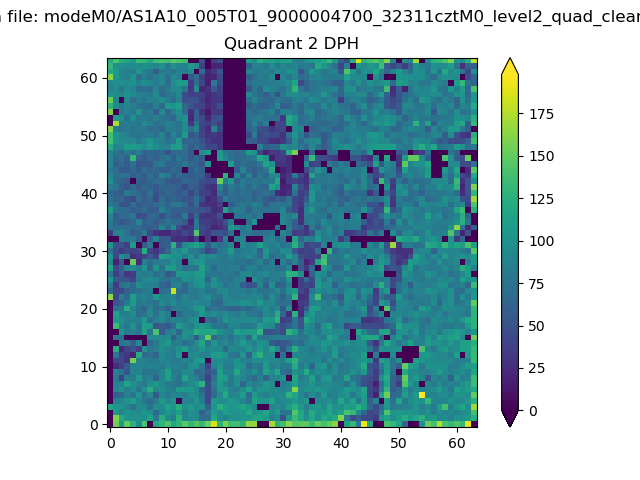 |
Quadrant C |
| Plot type | Count rate plots | Images |
|---|---|---|
| Comparison with Poisson distribution Blue bars denote a histogram of data divided into 1 sec bins. Red curve is a Poisson curve with rate = median count rate of data. |
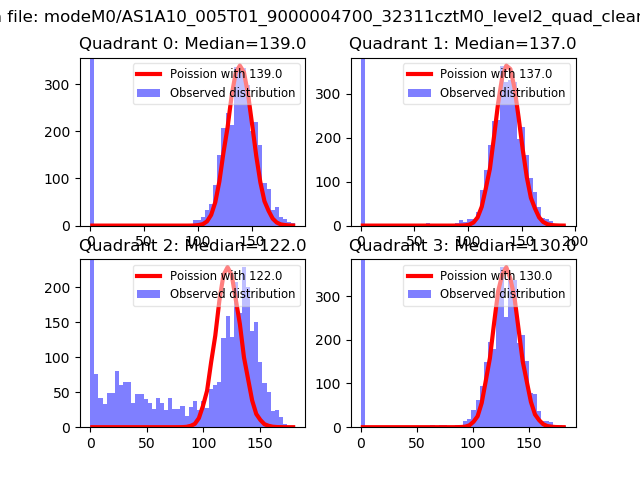 |
 |
| Quadrant-wise count rates Data is divided into 100 sec bins |
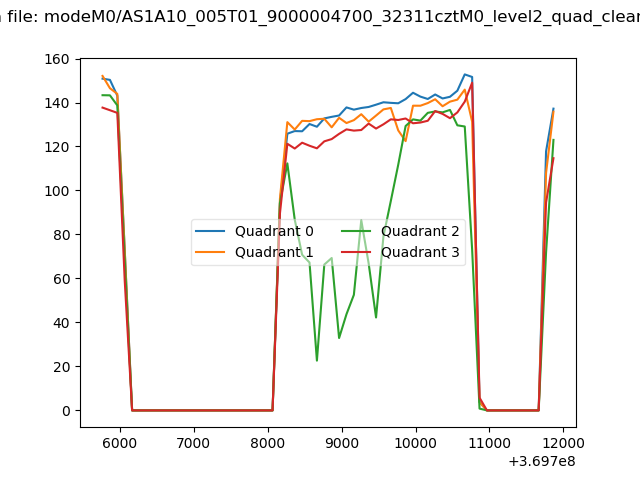 |
|
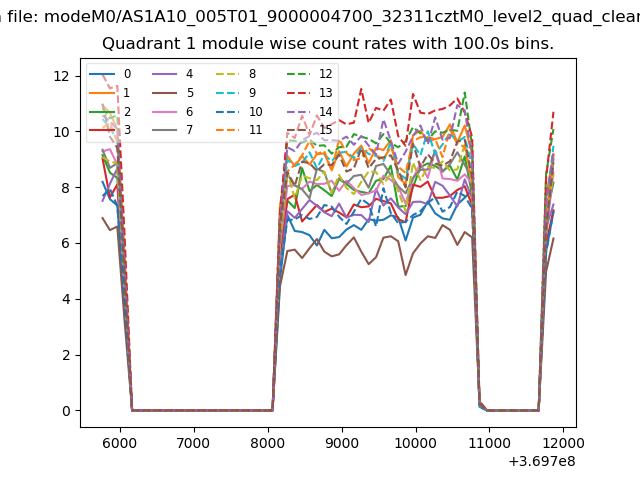
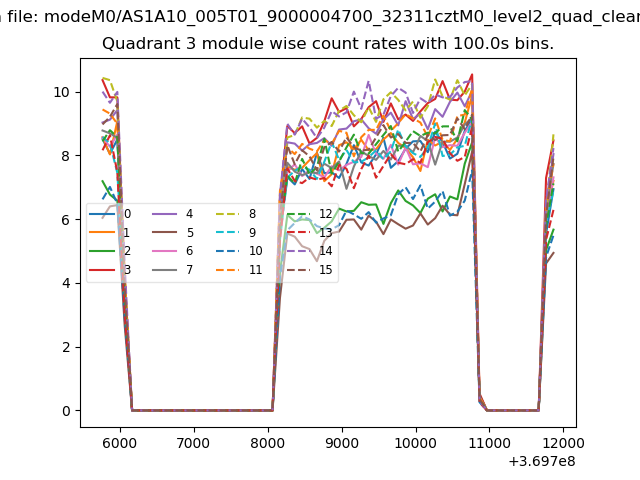
| Module-wise count rates for Quadrant A Data is divided into 100 sec bins |
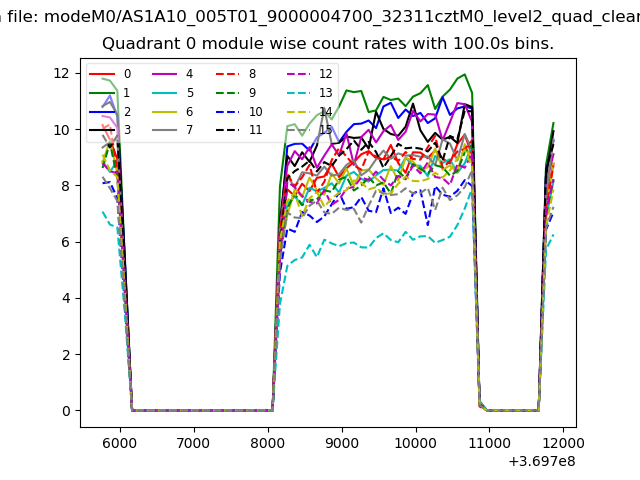 |
 |
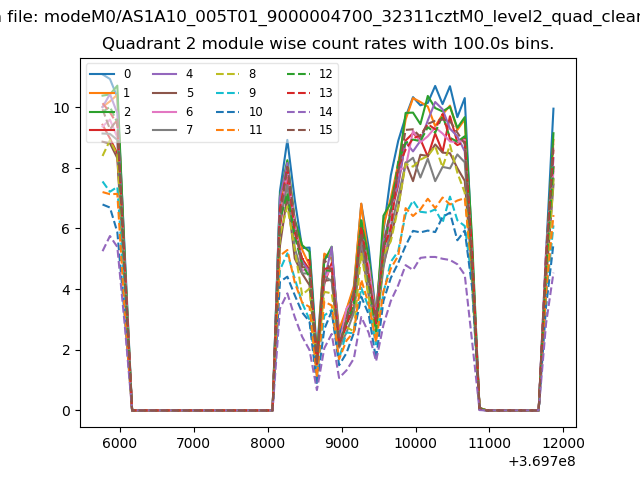
| Module-wise count rates for Quadrant B Data is divided into 100 sec bins |
 |
 |
| Module-wise count rates for Quadrant C Data is divided into 100 sec bins |
 |
 |
| Module-wise count rates for Quadrant D Data is divided into 100 sec bins |
 |
 |
| Parameter | Plot |
|---|---|
| CZT HV Monitor | 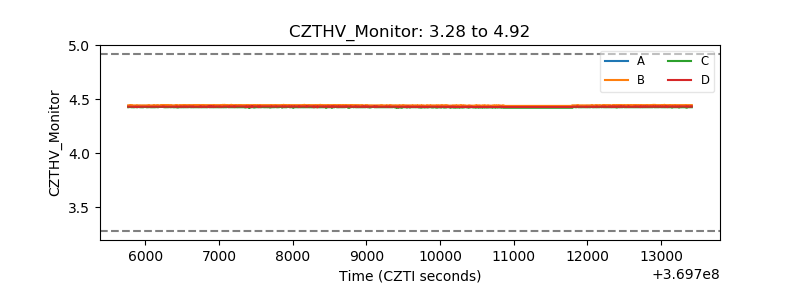 |
| D_VDD | 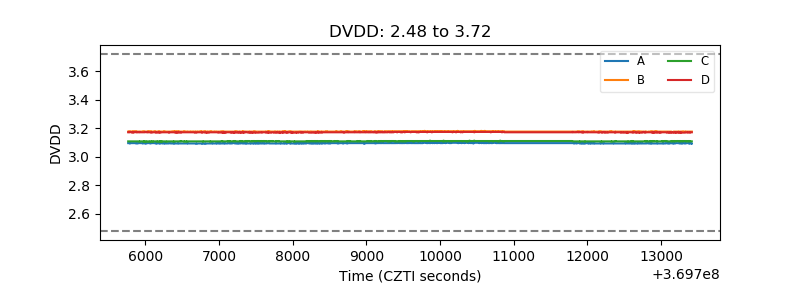 |
| Temperature 1 | 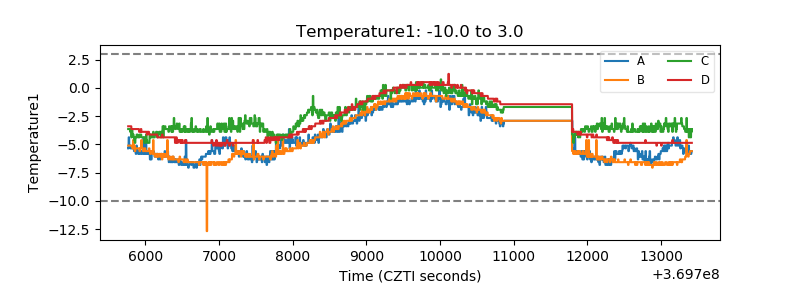 |
| Veto HV Monitor | 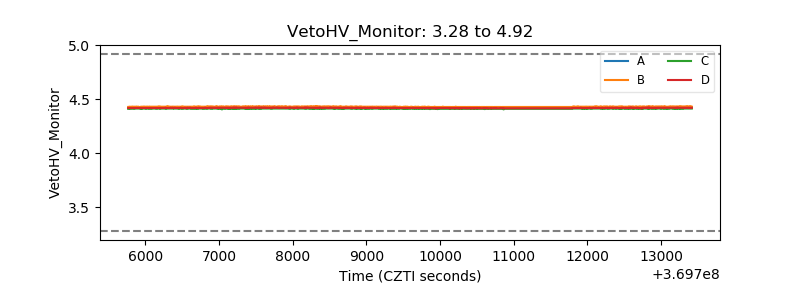 |
| Veto LLD | 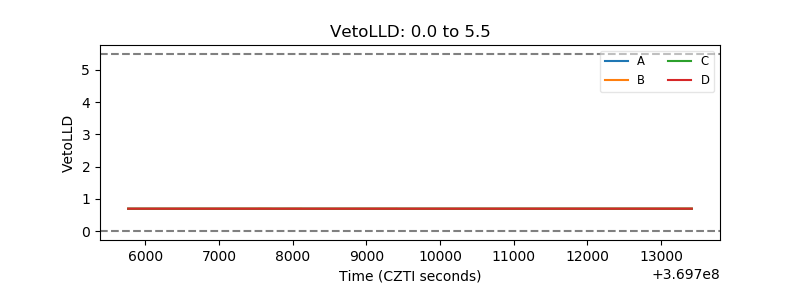 |
| Alpha Counter | 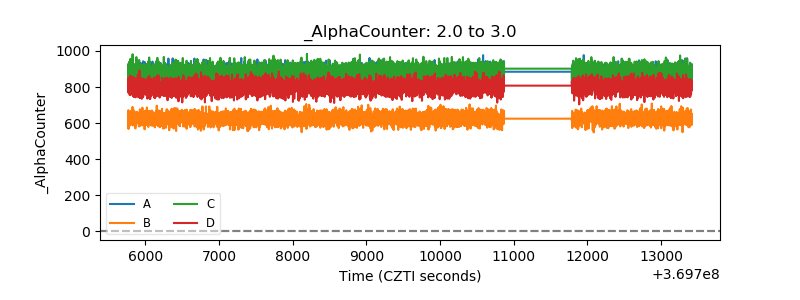 |
| _CPM_Rate | 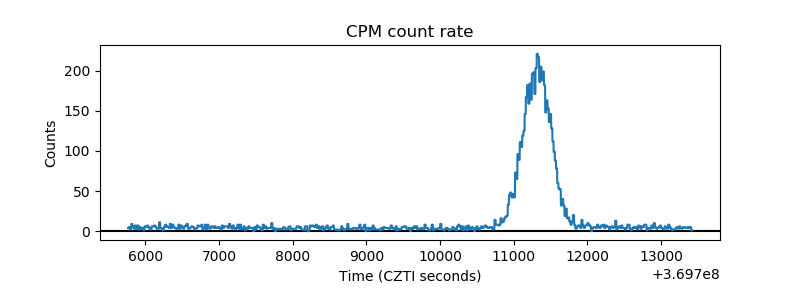 |
| CZT Counter | 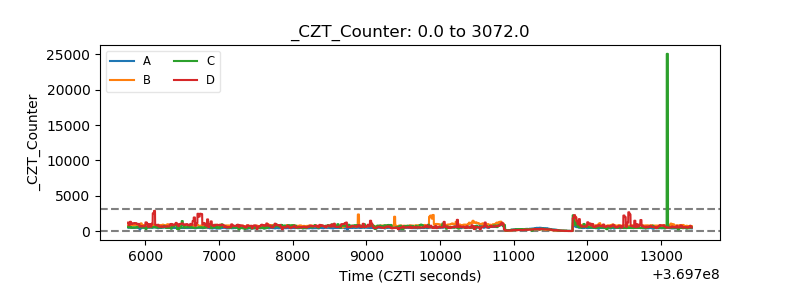 |
| +2.5 Volts monitor |  |
| +5 Volts monitor |  |
| _ROLL_ROT | 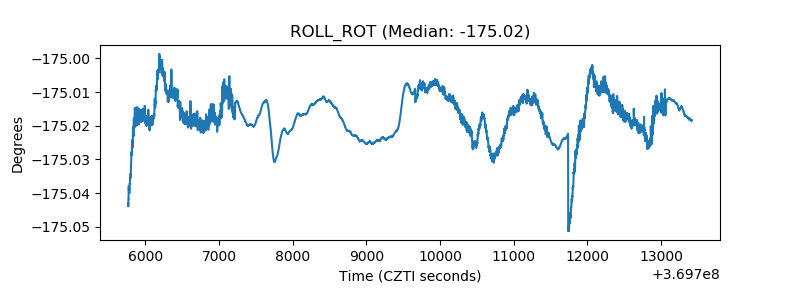 |
| _Roll_DEC | 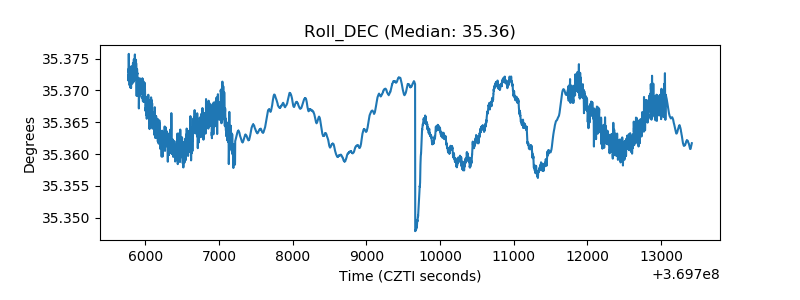 |
| _Roll_RA | 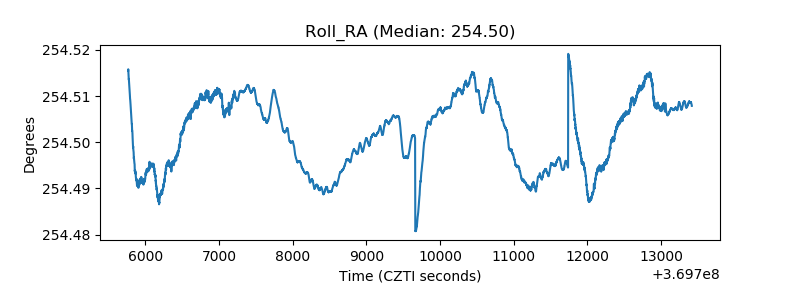 |
| Veto Counter | 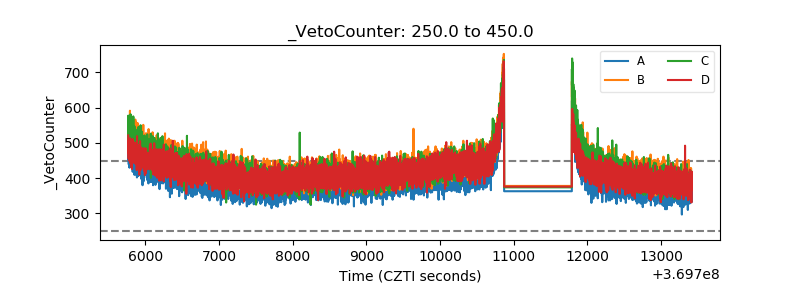 |