| Param | Original file | Final file |
|---|---|---|
| Filename | modeM0/AS1A10_005T01_9000004700_32312cztM0_level2.evt | modeM0/AS1A10_005T01_9000004700_32312cztM0_level2_quad_clean.evt |
| Size (bytes) | 658,203,840 | 78,756,480 |
| Size | 627.7 MB | 75.1 MB |
| Events in quadrant A | 3,590,364 | 488,854 |
| Events in quadrant B | 5,918,771 | 478,474 |
| Events in quadrant C | 4,066,675 | 460,396 |
| Events in quadrant D | 5,864,809 | 448,916 |
| Mode M0 | |||
|---|---|---|---|
| Quadrant | BADHDUFLAG | Total packets | Discarded packets |
| A | 0 | 15334 | 3 |
| B | 0 | 22671 | 2 |
| C | 0 | 16644 | 2 |
| D | 0 | 22768 | 2 |
| Mode M9 | |||
|---|---|---|---|
| Quadrant | BADHDUFLAG | Total packets | Discarded packets |
| A | 0 | 4 | 0 |
| B | 0 | 4 | 0 |
| C | 0 | 4 | 0 |
| D | 0 | 5 | 0 |
| Mode SS | |||
|---|---|---|---|
| Quadrant | BADHDUFLAG | Total packets | Discarded packets |
| A | 0 | 148 | 0 |
| B | 0 | 148 | 0 |
| C | 0 | 148 | 0 |
| D | 0 | 148 | 0 |
| Quadrant | Total seconds | Saturated seconds | Saturation percentage |
|---|---|---|---|
| A | 7294 | 147 | 2.015355% |
| B | 7294 | 275 | 3.770222% |
| C | 7294 | 359 | 4.921854% |
| D | 7294 | 280 | 3.838772% |
Noise dominated data is calculated using 1-second bins in cleaned event files. If a bin has >2000 counts, and if more than 50% of those come from <1% of pixels, then it is considered to be noise-dominated and hence unusable.
| Quadrant | # 1 sec bins | Bins with >0 counts | Bins with >2000 counts | High rate bins dominated by noise | Noise dominated (total time) | Noise dominated (detector-on time) | Marked lightcurve |
|---|---|---|---|---|---|---|---|
| A | 7709 | 7295 | 2 | 2 | 0.03% | 0.03% | 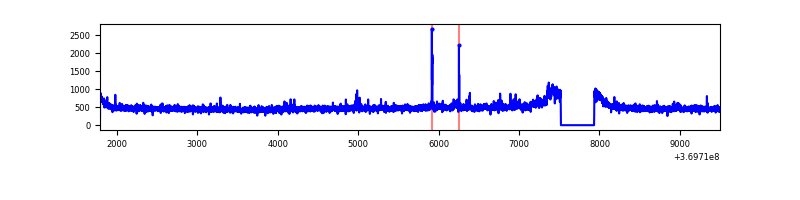 |
| B | 7709 | 7295 | 12 | 12 | 0.16% | 0.16% | 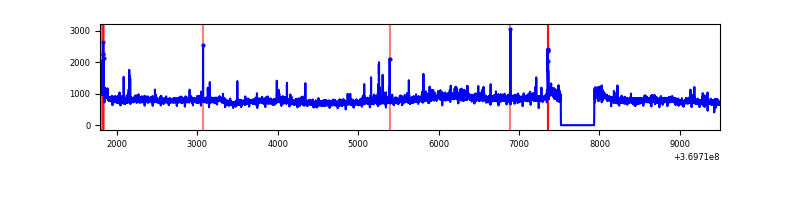 |
| C | 7709 | 7295 | 18 | 18 | 0.23% | 0.25% | 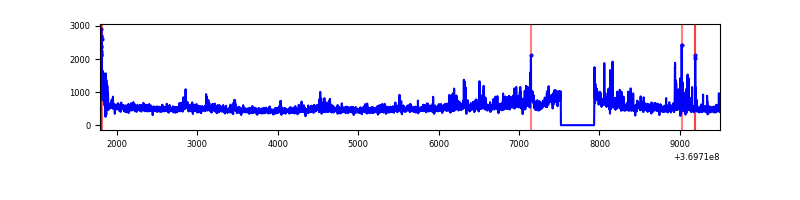 |
| D | 7709 | 7295 | 125 | 125 | 1.62% | 1.71% | 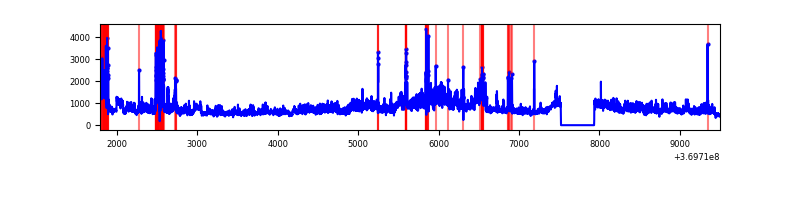 |
Top three noisy pixels from each quadrant. If the there are fewer than three noisy pixels in the level2.evt file, extra rows are filled as -1
| Pixel properties | Quadrant properties | ||||||
|---|---|---|---|---|---|---|---|
| Quadrant | DetID | PixID | Counts | Sigma | Mean | Median | Sigma |
| A | 12 | 189 | 59579 | 322.97 | 899 | 878 | 181.8 |
| A | 0 | 6 | 23912 | 126.73 | 899 | 878 | 181.8 |
| A | 13 | 6 | 19397 | 101.89 | 899 | 878 | 181.8 |
| B | 6 | 159 | 2123566 | 12500.28 | 887 | 864 | 169.8 |
| B | 0 | 168 | 95379 | 556.58 | 887 | 864 | 169.8 |
| B | 0 | 190 | 59468 | 345.11 | 887 | 864 | 169.8 |
| C | 3 | 233 | 295444 | 1461.36 | 859 | 863 | 201.6 |
| C | 14 | 238 | 168324 | 830.74 | 859 | 863 | 201.6 |
| C | 0 | 10 | 97534 | 479.57 | 859 | 863 | 201.6 |
| D | 8 | 195 | 2047837 | 9934.43 | 865 | 842 | 206.1 |
| D | 13 | 249 | 376567 | 1823.46 | 865 | 842 | 206.1 |
| D | 2 | 234 | 35669 | 169.02 | 865 | 842 | 206.1 |
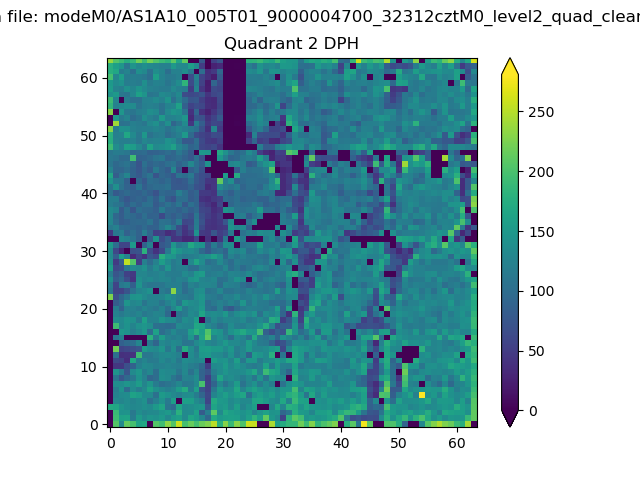
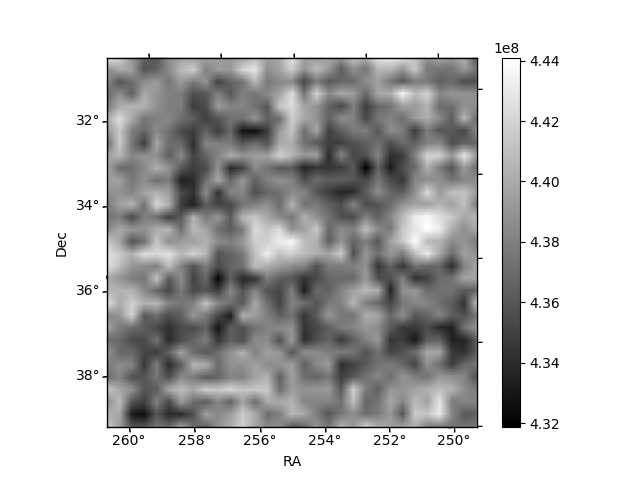
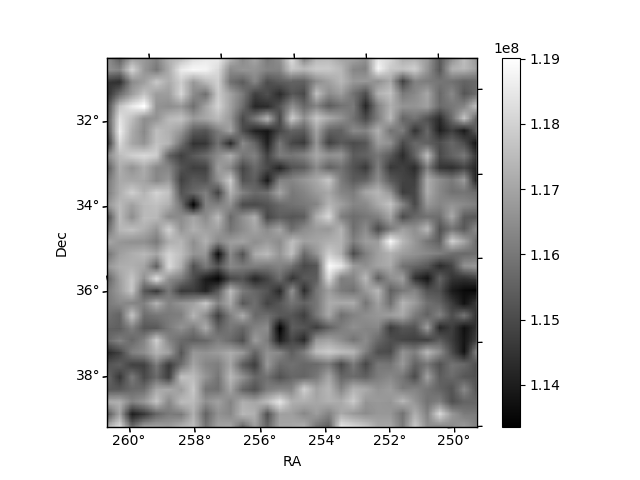
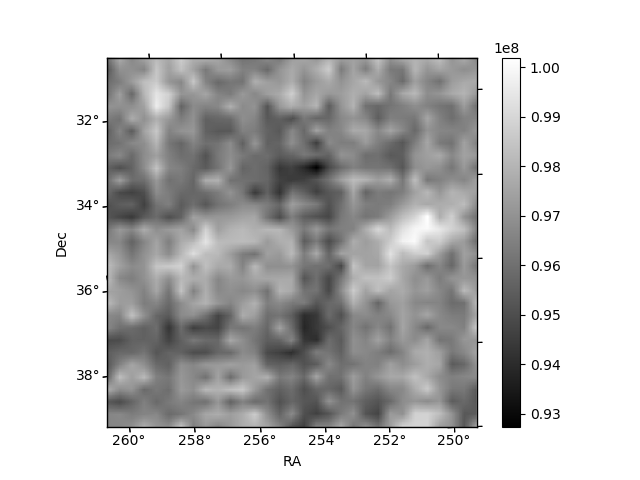
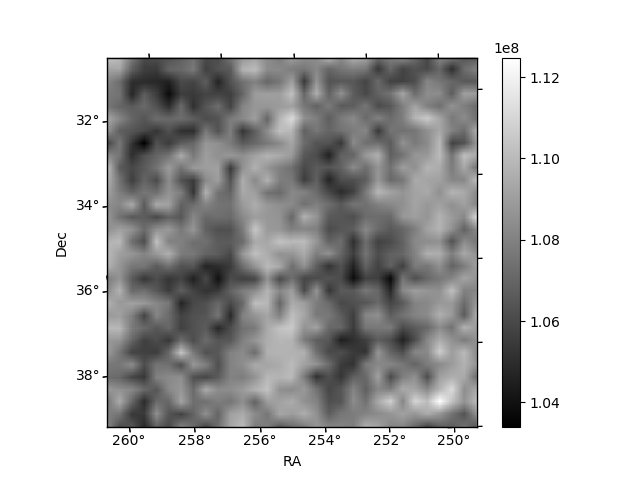
Histogram calculated using DETX and DETY for each event in the final _common_clean file
| Quadrant A | 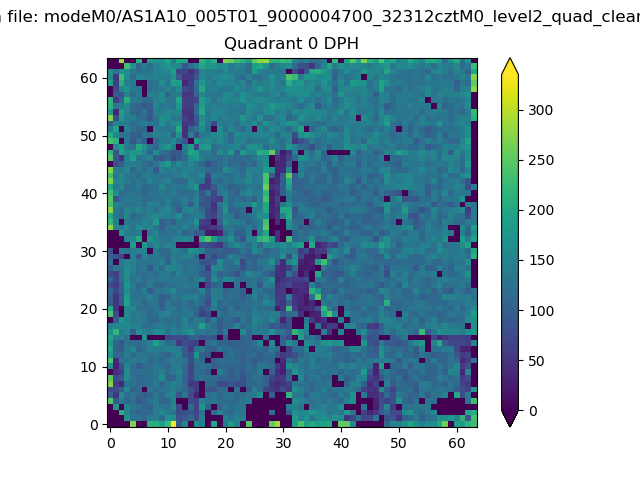 |
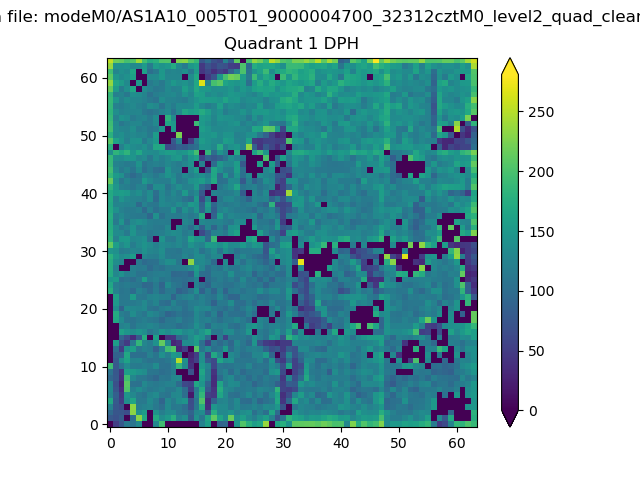 |
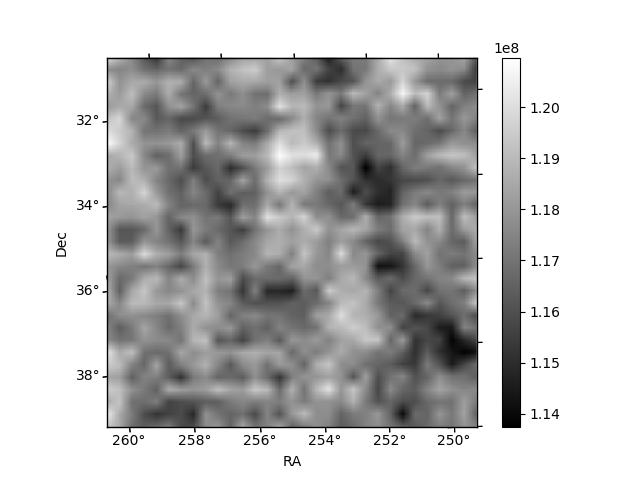
Quadrant B |
|---|---|---|---|
| Quadrant D | 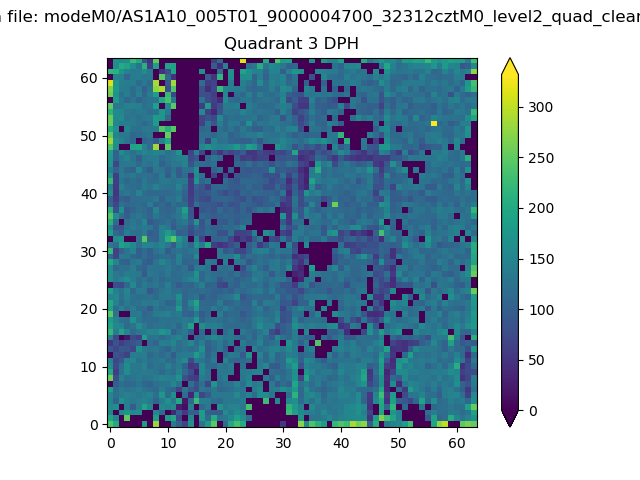 |
 |
Quadrant C |
| Plot type | Count rate plots | Images |
|---|---|---|
| Comparison with Poisson distribution Blue bars denote a histogram of data divided into 1 sec bins. Red curve is a Poisson curve with rate = median count rate of data. |
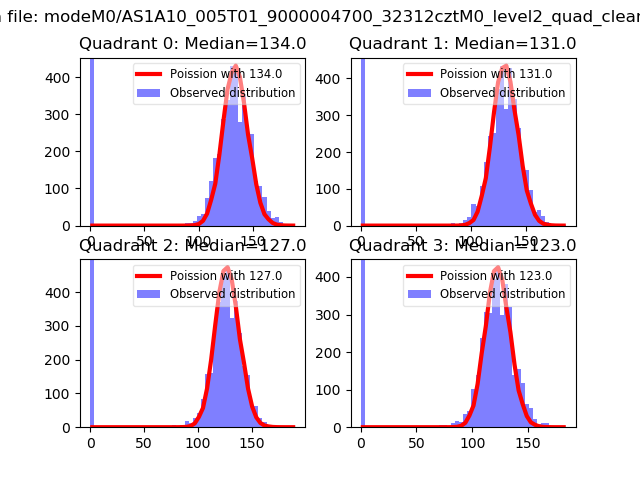 |
 |
| Quadrant-wise count rates Data is divided into 100 sec bins |
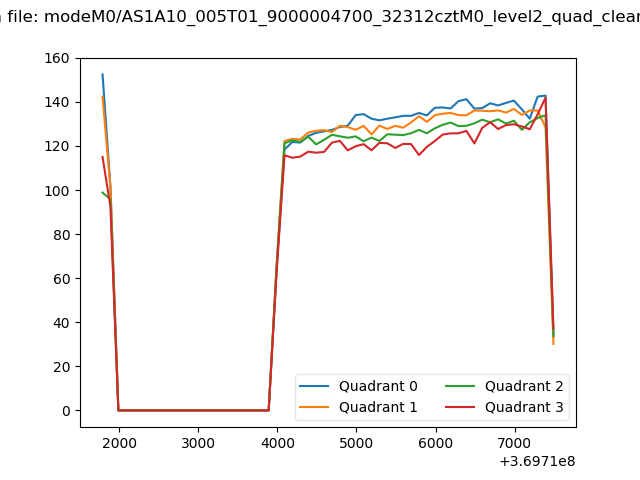 |
|
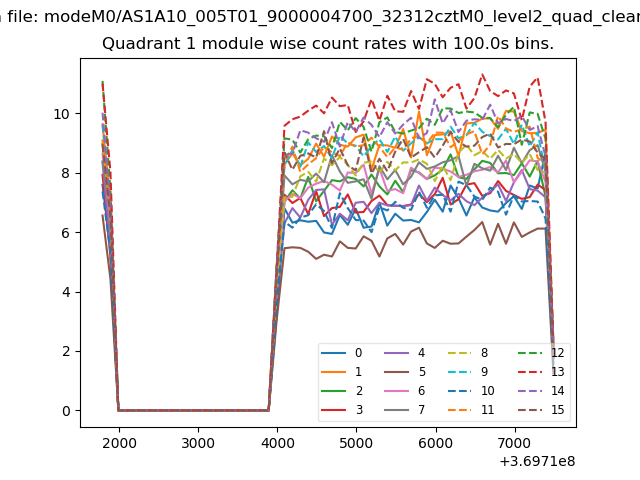
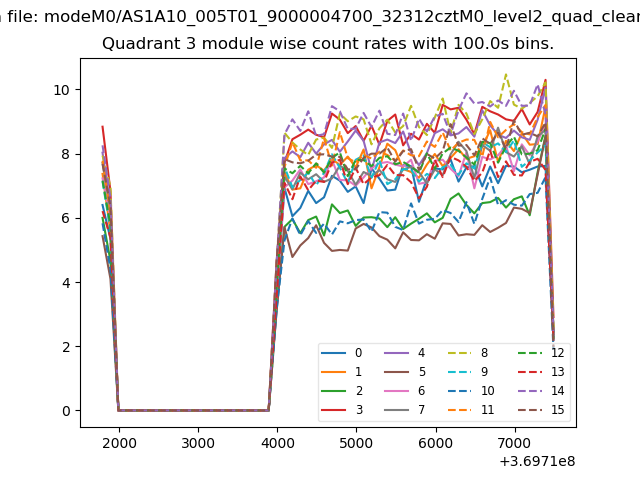
| Module-wise count rates for Quadrant A Data is divided into 100 sec bins |
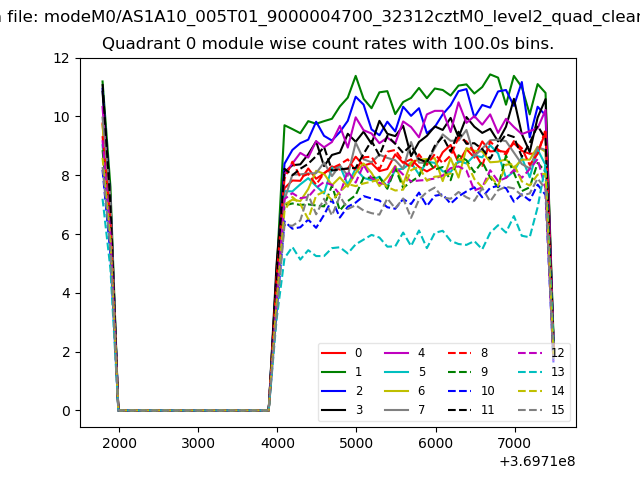 |
 |
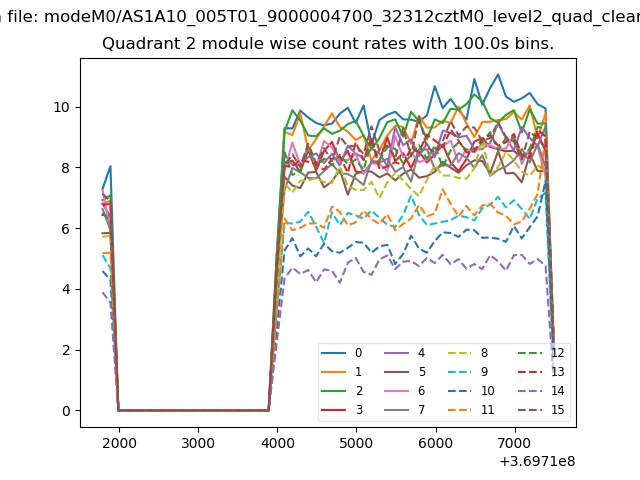
| Module-wise count rates for Quadrant B Data is divided into 100 sec bins |
 |
 |
| Module-wise count rates for Quadrant C Data is divided into 100 sec bins |
 |
 |
| Module-wise count rates for Quadrant D Data is divided into 100 sec bins |
 |
 |
| Parameter | Plot |
|---|---|
| CZT HV Monitor | 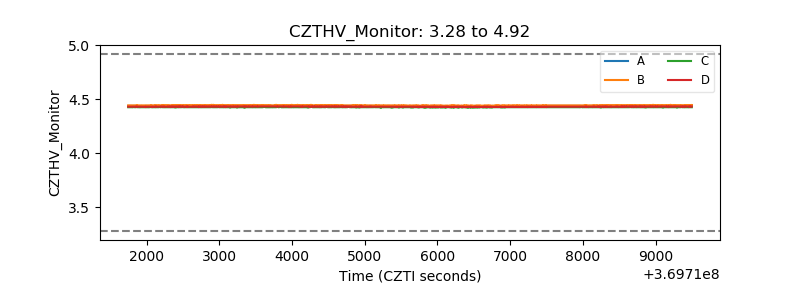 |
| D_VDD | 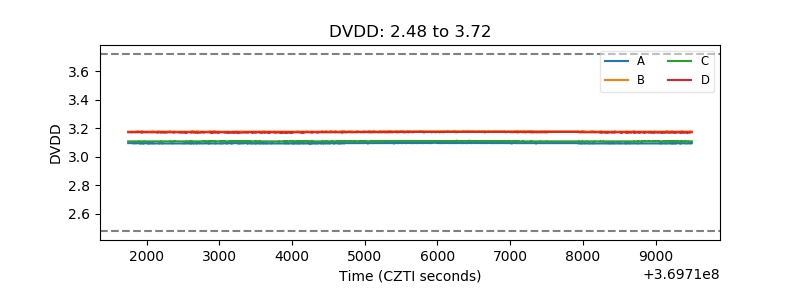 |
| Temperature 1 | 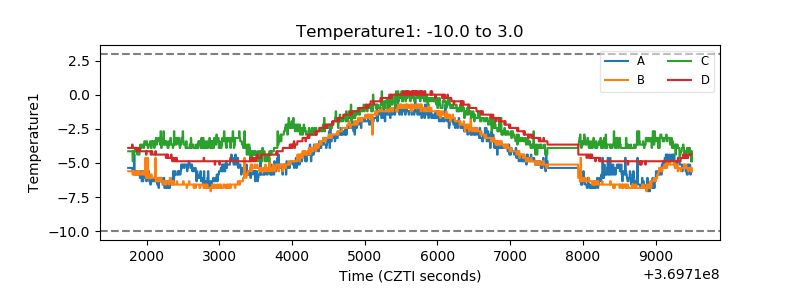 |
| Veto HV Monitor | 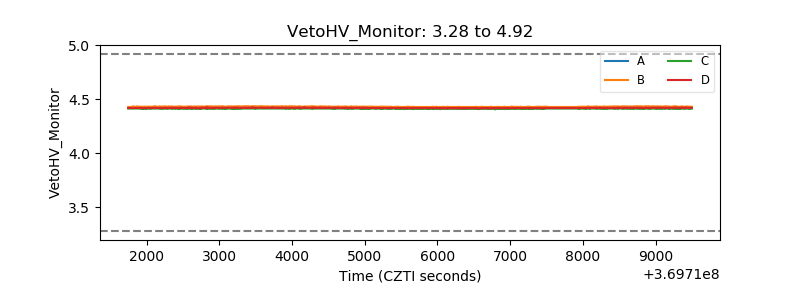 |
| Veto LLD | 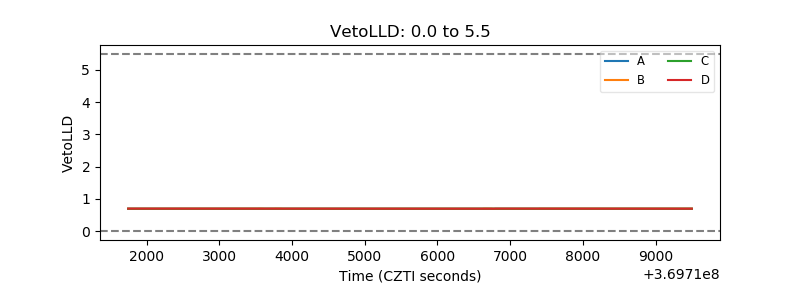 |
| Alpha Counter | 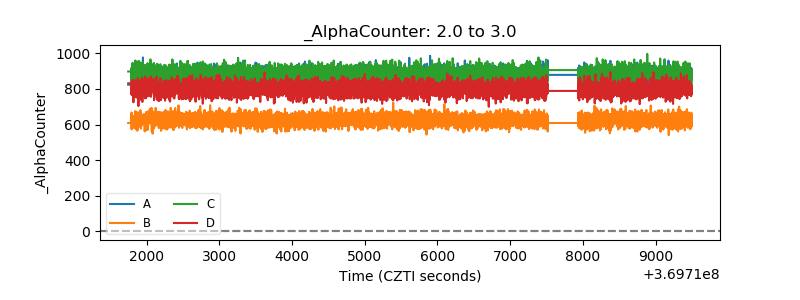 |
| _CPM_Rate | 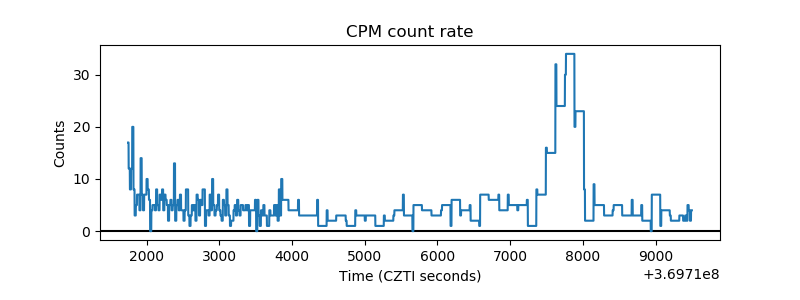 |
| CZT Counter | 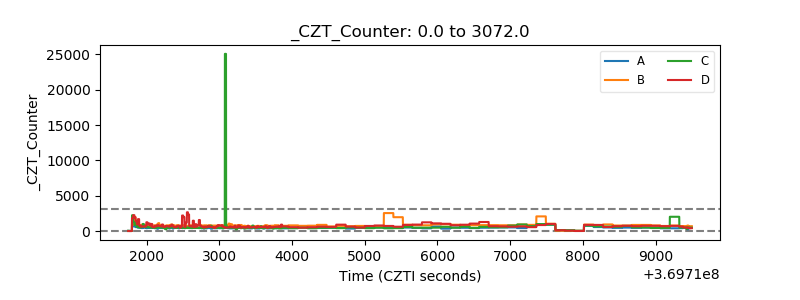 |
| +2.5 Volts monitor |  |
| +5 Volts monitor |  |
| _ROLL_ROT | 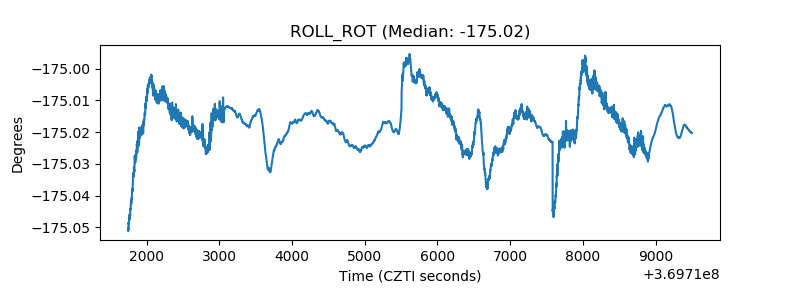 |
| _Roll_DEC | 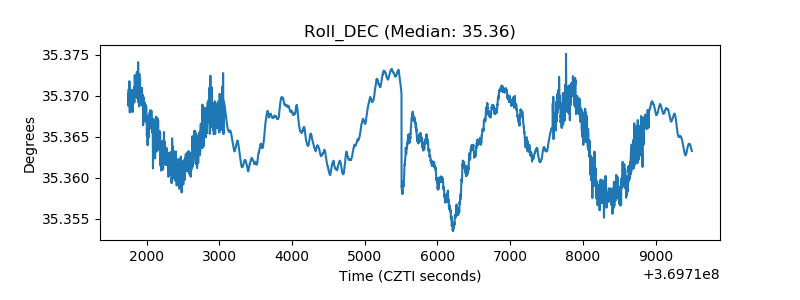 |
| _Roll_RA | 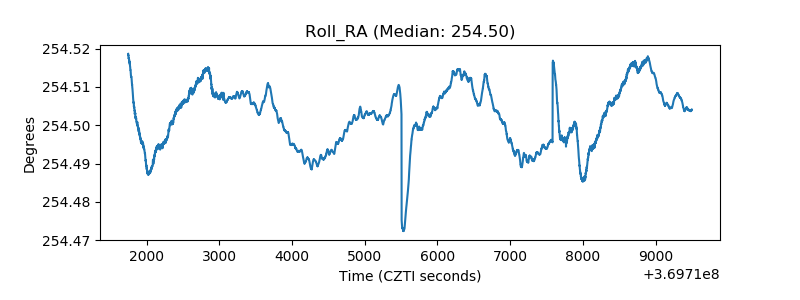 |
| Veto Counter | 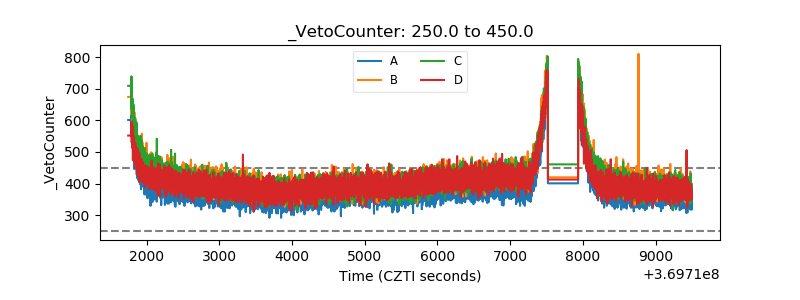 |