| Param | Original file | Final file |
|---|---|---|
| Filename | modeM0/AS1A10_005T01_9000004700_32313cztM0_level2.evt | modeM0/AS1A10_005T01_9000004700_32313cztM0_level2_quad_clean.evt |
| Size (bytes) | 682,585,920 | 85,325,760 |
| Size | 651.0 MB | 81.4 MB |
| Events in quadrant A | 3,922,918 | 527,698 |
| Events in quadrant B | 6,300,920 | 517,344 |
| Events in quadrant C | 4,636,869 | 492,438 |
| Events in quadrant D | 5,272,588 | 492,961 |
| Mode M0 | |||
|---|---|---|---|
| Quadrant | BADHDUFLAG | Total packets | Discarded packets |
| A | 0 | 16766 | 3 |
| B | 0 | 24382 | 2 |
| C | 0 | 18765 | 2 |
| D | 0 | 21077 | 2 |
| Mode M9 | |||
|---|---|---|---|
| Quadrant | BADHDUFLAG | Total packets | Discarded packets |
| A | 0 | 5 | 0 |
| B | 0 | 5 | 0 |
| C | 0 | 5 | 0 |
| D | 0 | 5 | 0 |
| Mode SS | |||
|---|---|---|---|
| Quadrant | BADHDUFLAG | Total packets | Discarded packets |
| A | 0 | 164 | 0 |
| B | 0 | 164 | 0 |
| C | 0 | 164 | 0 |
| D | 0 | 164 | 0 |
| Quadrant | Total seconds | Saturated seconds | Saturation percentage |
|---|---|---|---|
| A | 7954 | 322 | 4.048278% |
| B | 7954 | 529 | 6.650742% |
| C | 7954 | 675 | 8.486296% |
| D | 7954 | 392 | 4.928338% |
Noise dominated data is calculated using 1-second bins in cleaned event files. If a bin has >2000 counts, and if more than 50% of those come from <1% of pixels, then it is considered to be noise-dominated and hence unusable.
| Quadrant | # 1 sec bins | Bins with >0 counts | Bins with >2000 counts | High rate bins dominated by noise | Noise dominated (total time) | Noise dominated (detector-on time) | Marked lightcurve |
|---|---|---|---|---|---|---|---|
| A | 8509 | 7956 | 0 | 0 | 0.00% | 0.00% | 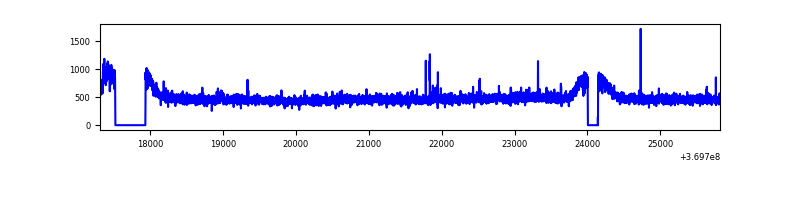 |
| B | 8509 | 7956 | 13 | 13 | 0.15% | 0.16% |  |
| C | 8509 | 7955 | 9 | 9 | 0.11% | 0.11% | 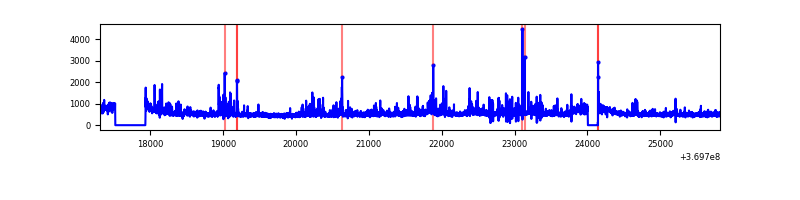 |
| D | 8509 | 7956 | 121 | 121 | 1.42% | 1.52% |  |
Top three noisy pixels from each quadrant. If the there are fewer than three noisy pixels in the level2.evt file, extra rows are filled as -1
| Pixel properties | Quadrant properties | ||||||
|---|---|---|---|---|---|---|---|
| Quadrant | DetID | PixID | Counts | Sigma | Mean | Median | Sigma |
| A | 12 | 189 | 24402 | 115.54 | 998 | 974 | 202.8 |
| A | 13 | 6 | 19903 | 93.35 | 998 | 974 | 202.8 |
| A | 13 | 254 | 15424 | 71.27 | 998 | 974 | 202.8 |
| B | 6 | 159 | 2245442 | 11838.11 | 980 | 952 | 189.6 |
| B | 0 | 168 | 63192 | 328.27 | 980 | 952 | 189.6 |
| B | 5 | 172 | 54211 | 280.9 | 980 | 952 | 189.6 |
| C | 3 | 233 | 477562 | 2127.15 | 946 | 951 | 224.1 |
| C | 14 | 238 | 220642 | 980.5 | 946 | 951 | 224.1 |
| C | 14 | 254 | 99392 | 439.35 | 946 | 951 | 224.1 |
| D | 8 | 195 | 953342 | 4137.95 | 963 | 936 | 230.2 |
| D | 13 | 249 | 277043 | 1199.61 | 963 | 936 | 230.2 |
| D | 12 | 233 | 154258 | 666.14 | 963 | 936 | 230.2 |
Histogram calculated using DETX and DETY for each event in the final _common_clean file
| Quadrant A | 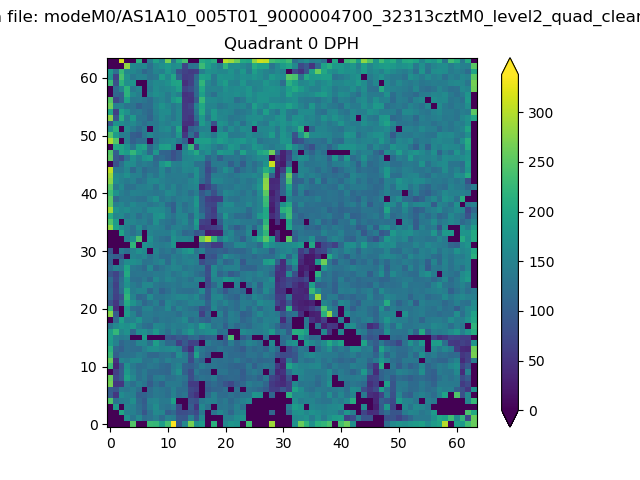 |
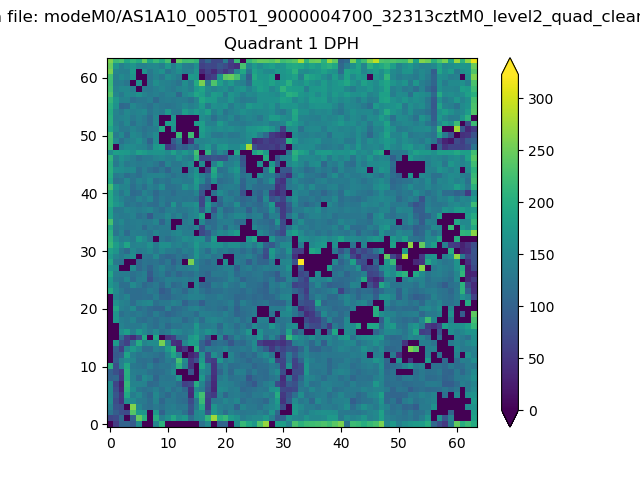 |
Quadrant B |
|---|---|---|---|
| Quadrant D |  |
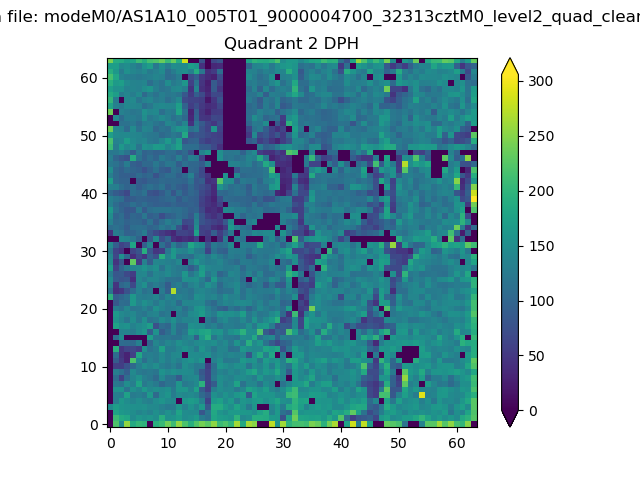 |
Quadrant C |
| Plot type | Count rate plots | Images |
|---|---|---|
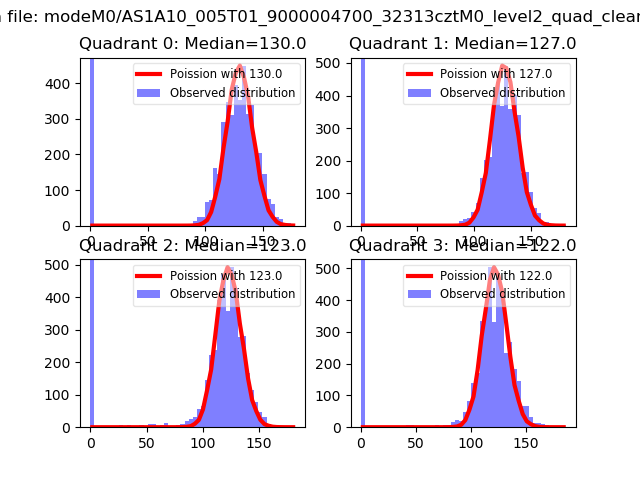
| Comparison with Poisson distribution Blue bars denote a histogram of data divided into 1 sec bins. Red curve is a Poisson curve with rate = median count rate of data. |
 |
 |
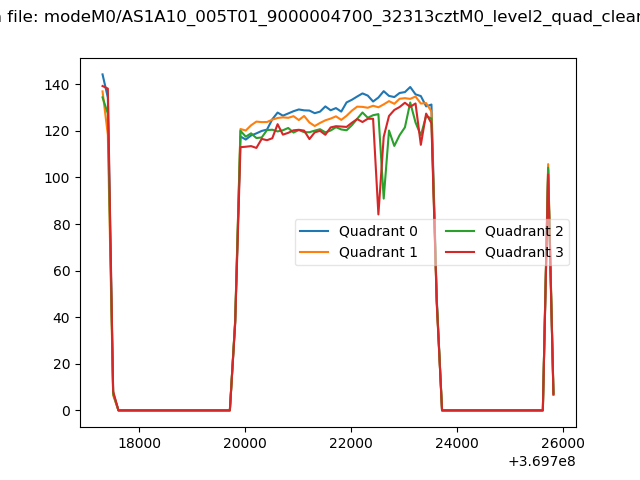
| Quadrant-wise count rates Data is divided into 100 sec bins |
 |
|
| Module-wise count rates for Quadrant A Data is divided into 100 sec bins |
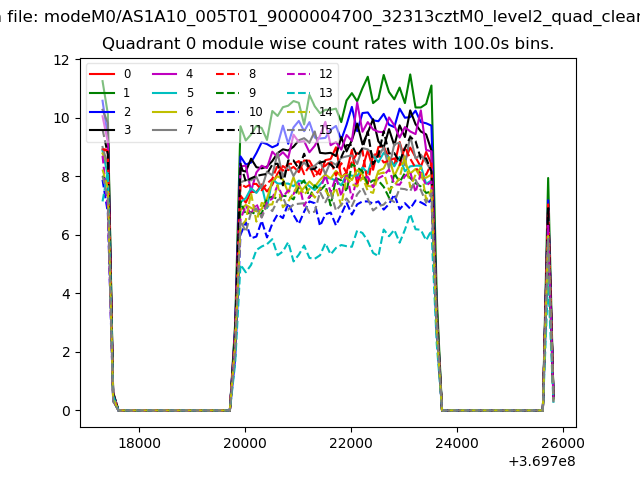 |
 |
| Module-wise count rates for Quadrant B Data is divided into 100 sec bins |
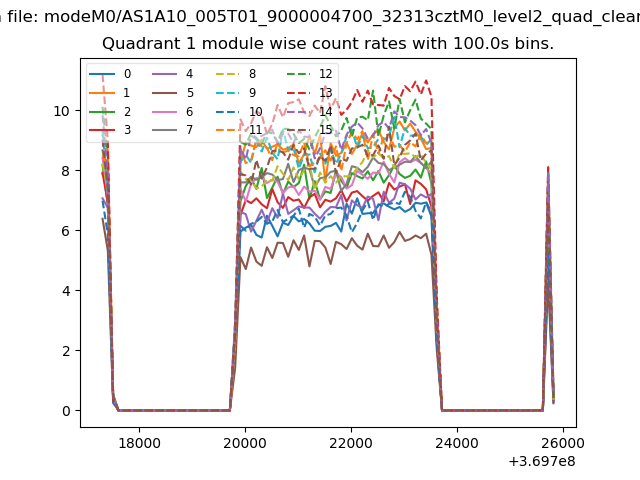 |
 |
| Module-wise count rates for Quadrant C Data is divided into 100 sec bins |
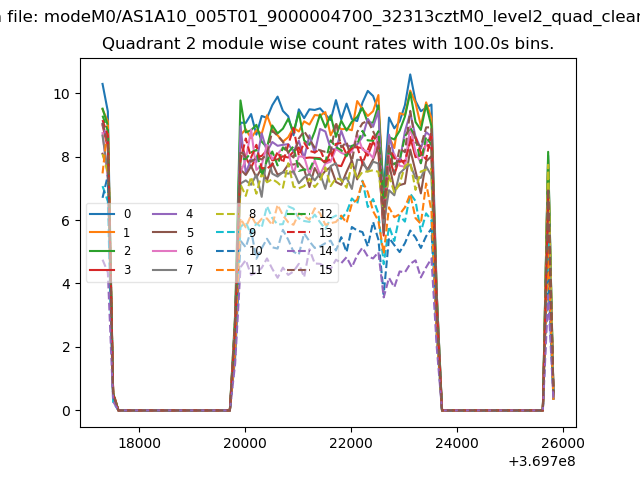 |
 |
| Module-wise count rates for Quadrant D Data is divided into 100 sec bins |
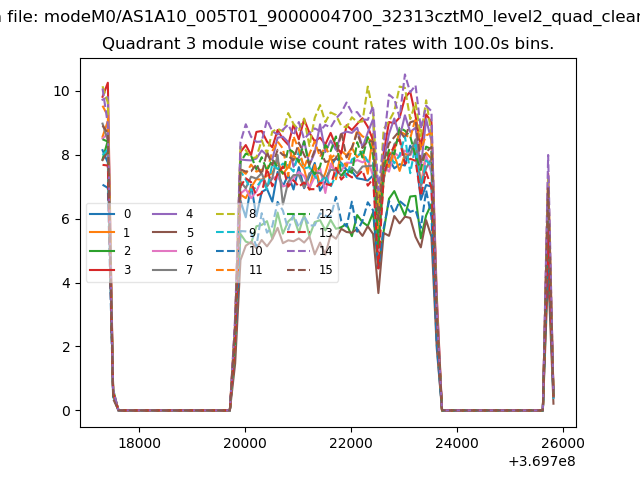 |
 |
| Parameter | Plot |
|---|---|
| CZT HV Monitor | 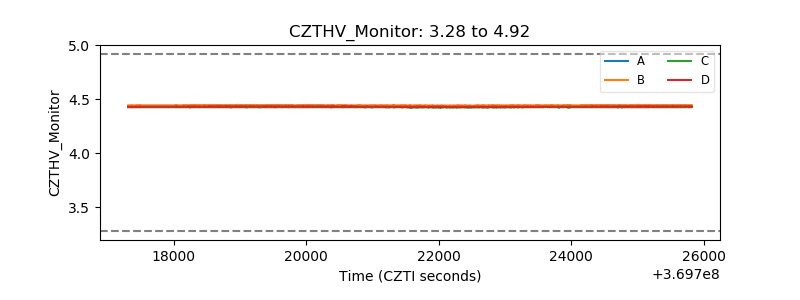 |
| D_VDD | 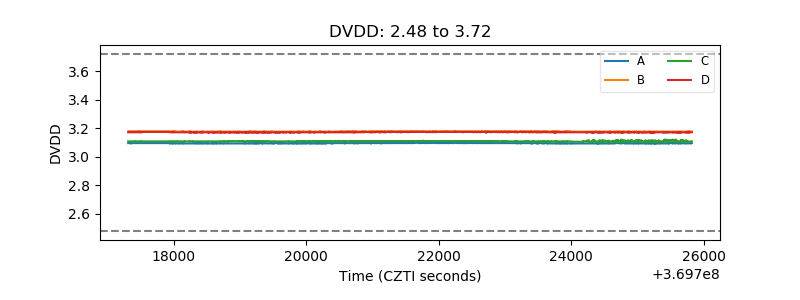 |
| Temperature 1 |  |
| Veto HV Monitor | 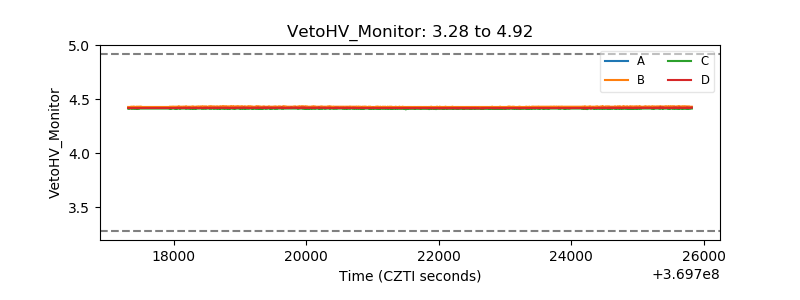 |
| Veto LLD | 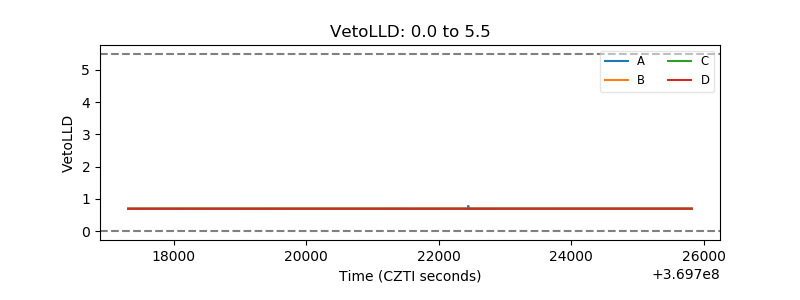 |
| Alpha Counter | 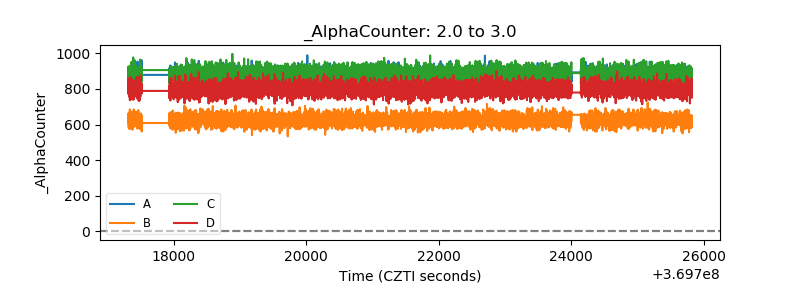 |
| _CPM_Rate | 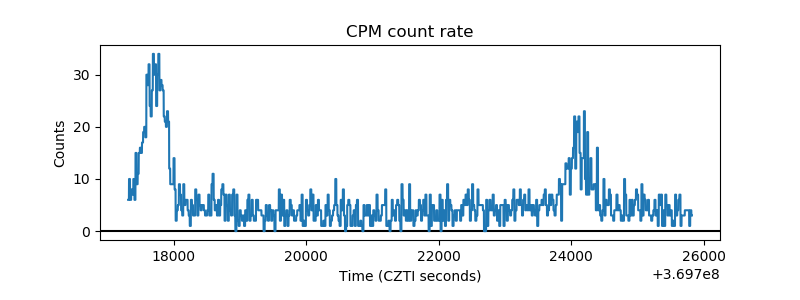 |
| CZT Counter | 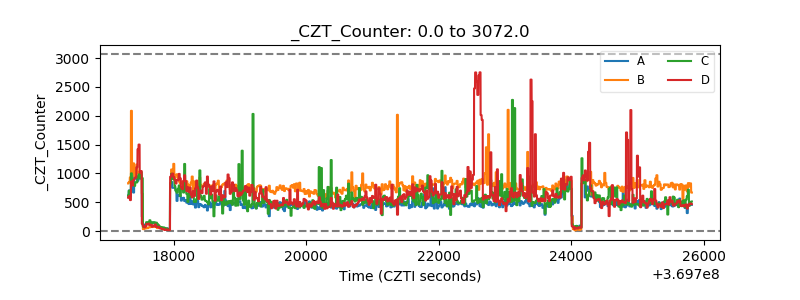 |
| +2.5 Volts monitor |  |
| +5 Volts monitor |  |
| _ROLL_ROT | 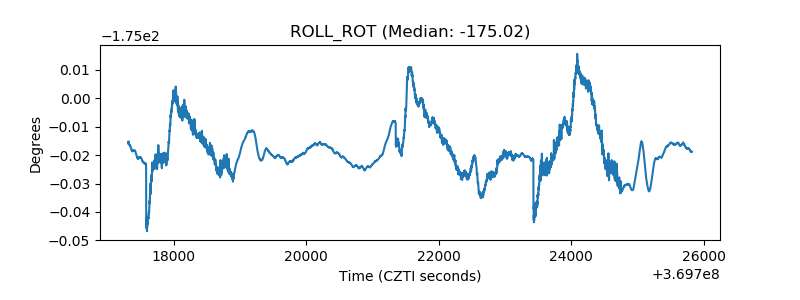 |
| _Roll_DEC | 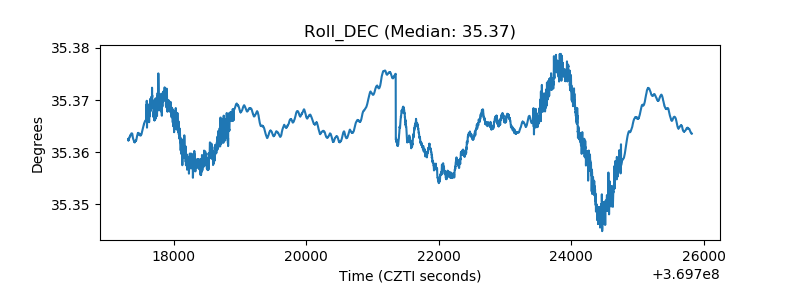 |
| _Roll_RA | 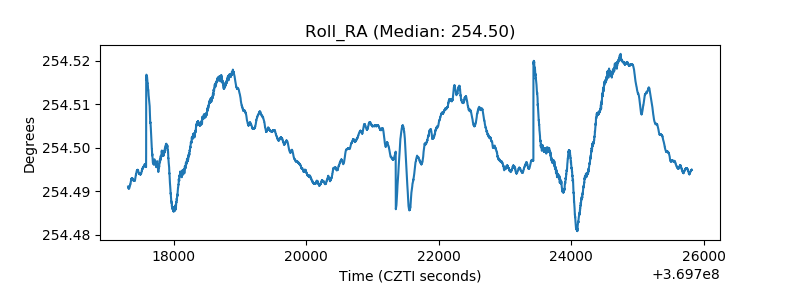 |
| Veto Counter | 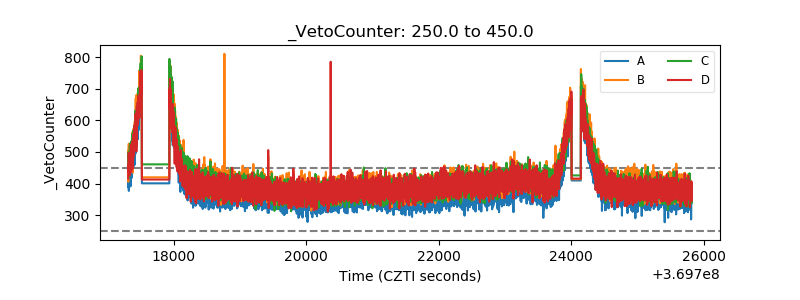 |