| Param | Original file | Final file |
|---|---|---|
| Filename | modeM0/AS1A10_005T01_9000004700_32317cztM0_level2.evt | modeM0/AS1A10_005T01_9000004700_32317cztM0_level2_quad_clean.evt |
| Size (bytes) | 1,637,406,720 | 217,837,440 |
| Size | 1.5 GB | 207.7 MB |
| Events in quadrant A | 9,405,595 | 1,415,071 |
| Events in quadrant B | 13,472,057 | 1,381,619 |
| Events in quadrant C | 10,702,110 | 1,325,195 |
| Events in quadrant D | 14,862,867 | 1,300,023 |
| Mode M0 | |||
|---|---|---|---|
| Quadrant | BADHDUFLAG | Total packets | Discarded packets |
| A | 0 | 39005 | 3 |
| B | 0 | 52778 | 3 |
| C | 0 | 42964 | 3 |
| D | 0 | 56384 | 3 |
| Mode M9 | |||
|---|---|---|---|
| Quadrant | BADHDUFLAG | Total packets | Discarded packets |
| A | 0 | 17 | 0 |
| B | 0 | 16 | 0 |
| C | 0 | 16 | 0 |
| D | 0 | 16 | 0 |
| Mode SS | |||
|---|---|---|---|
| Quadrant | BADHDUFLAG | Total packets | Discarded packets |
| A | 0 | 348 | 0 |
| B | 0 | 348 | 0 |
| C | 0 | 348 | 0 |
| D | 0 | 348 | 0 |
| Quadrant | Total seconds | Saturated seconds | Saturation percentage |
|---|---|---|---|
| A | 17050 | 706 | 4.140762% |
| B | 17050 | 572 | 3.354839% |
| C | 17050 | 1092 | 6.404692% |
| D | 17050 | 557 | 3.266862% |
Noise dominated data is calculated using 1-second bins in cleaned event files. If a bin has >2000 counts, and if more than 50% of those come from <1% of pixels, then it is considered to be noise-dominated and hence unusable.
| Quadrant | # 1 sec bins | Bins with >0 counts | Bins with >2000 counts | High rate bins dominated by noise | Noise dominated (total time) | Noise dominated (detector-on time) | Marked lightcurve |
|---|---|---|---|---|---|---|---|
| A | 18155 | 17052 | 390 | 390 | 2.15% | 2.29% | 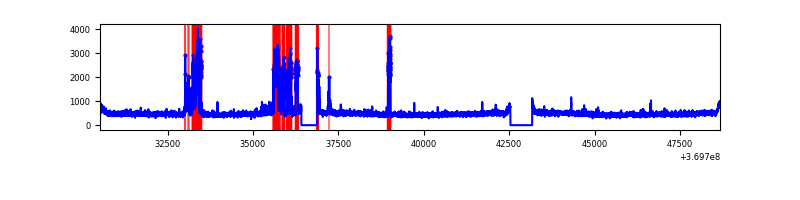 |
| B | 18155 | 17052 | 136 | 136 | 0.75% | 0.80% |  |
| C | 18155 | 17052 | 79 | 79 | 0.44% | 0.46% | 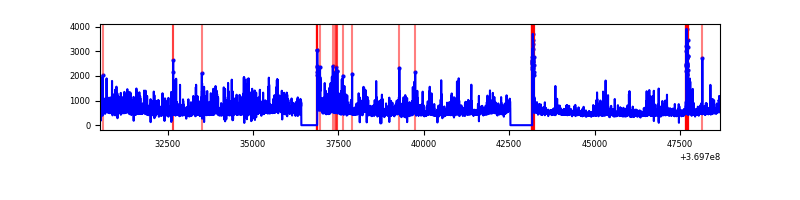 |
| D | 18155 | 17052 | 379 | 379 | 2.09% | 2.22% |  |
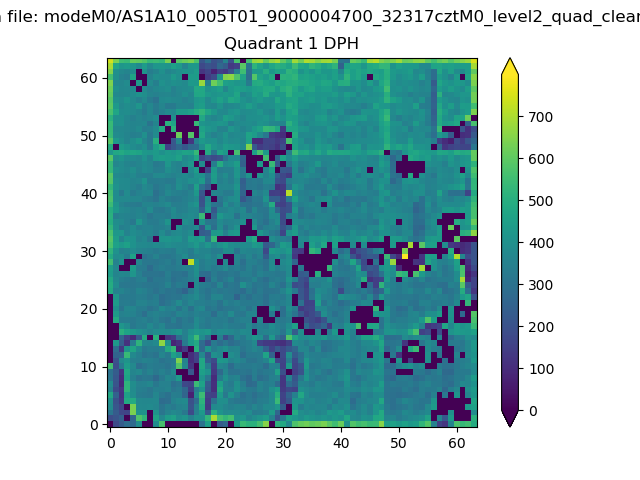
Top three noisy pixels from each quadrant. If the there are fewer than three noisy pixels in the level2.evt file, extra rows are filled as -1
| Pixel properties | Quadrant properties | ||||||
|---|---|---|---|---|---|---|---|
| Quadrant | DetID | PixID | Counts | Sigma | Mean | Median | Sigma |
| A | 9 | 143 | 1449683 | 3585.32 | 2016 | 1974 | 403.8 |
| A | 12 | 189 | 107151 | 260.48 | 2016 | 1974 | 403.8 |
| A | 13 | 6 | 57554 | 137.65 | 2016 | 1974 | 403.8 |
| B | 6 | 159 | 4828964 | 12709.28 | 1998 | 1948 | 379.8 |
| B | 5 | 172 | 434085 | 1137.79 | 1998 | 1948 | 379.8 |
| B | 0 | 190 | 182408 | 475.14 | 1998 | 1948 | 379.8 |
| C | 3 | 233 | 1923019 | 4229.68 | 1915 | 1921 | 454.2 |
| C | 14 | 238 | 489497 | 1073.5 | 1915 | 1921 | 454.2 |
| C | 0 | 10 | 453413 | 994.05 | 1915 | 1921 | 454.2 |
| D | 8 | 195 | 6000210 | 12716.17 | 1964 | 1910 | 471.7 |
| D | 13 | 249 | 597754 | 1263.17 | 1964 | 1910 | 471.7 |
| D | 12 | 233 | 294270 | 619.79 | 1964 | 1910 | 471.7 |
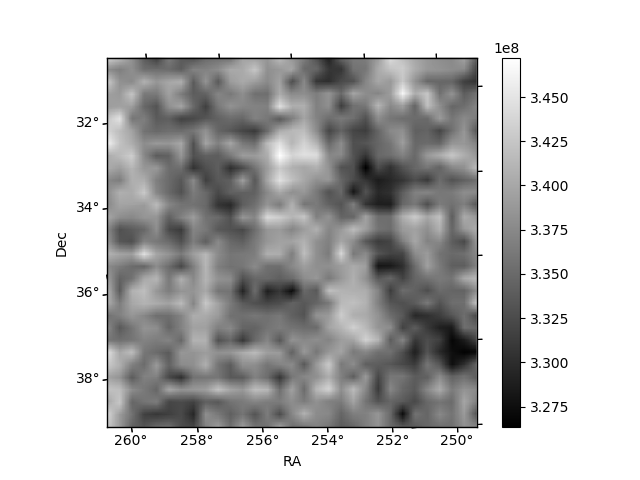
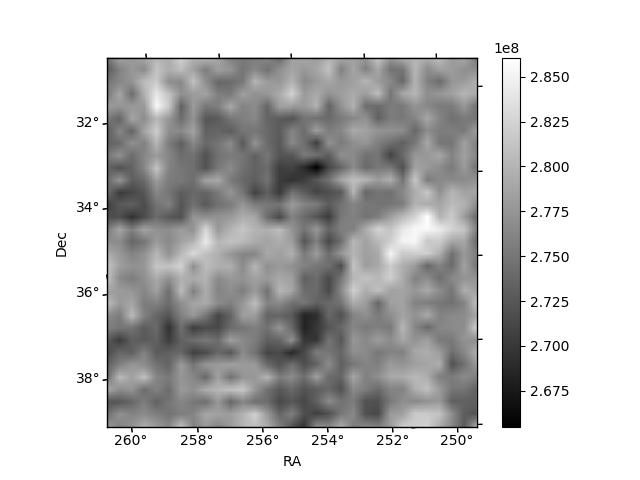
Histogram calculated using DETX and DETY for each event in the final _common_clean file
| Quadrant A | 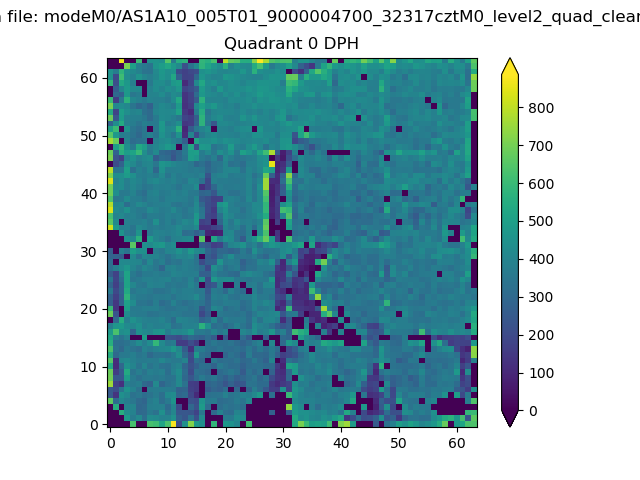 |
 |
Quadrant B |
|---|---|---|---|
| Quadrant D | 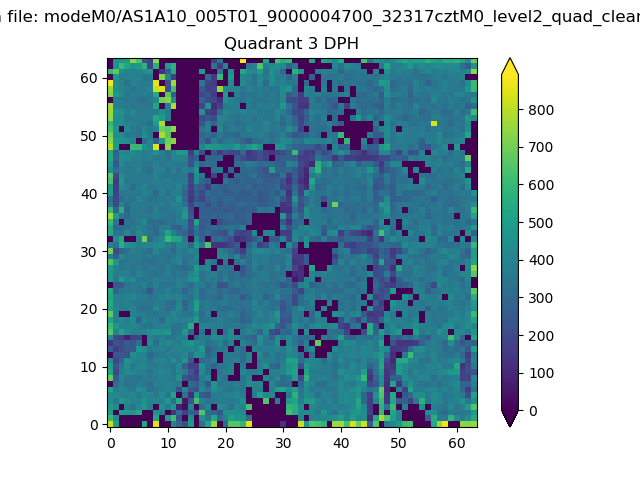 |
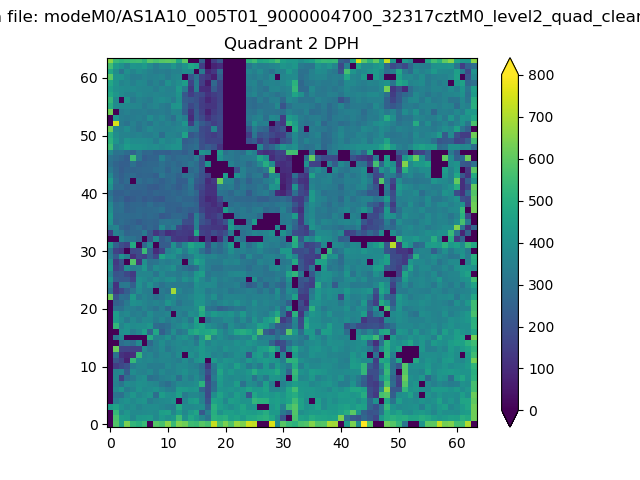 |
Quadrant C |
| Plot type | Count rate plots | Images |
|---|---|---|
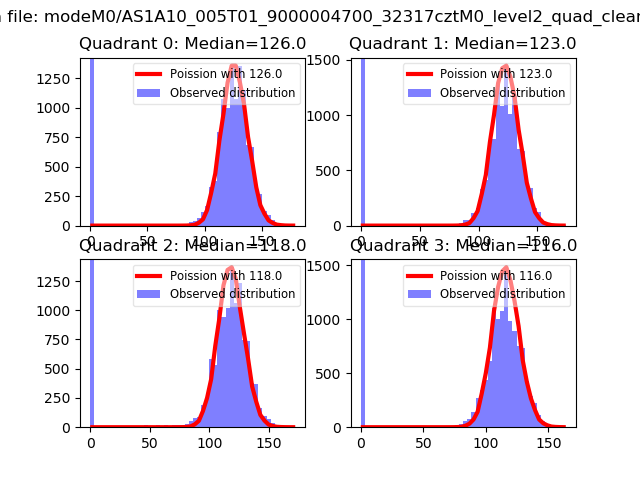
| Comparison with Poisson distribution Blue bars denote a histogram of data divided into 1 sec bins. Red curve is a Poisson curve with rate = median count rate of data. |
 |
 |
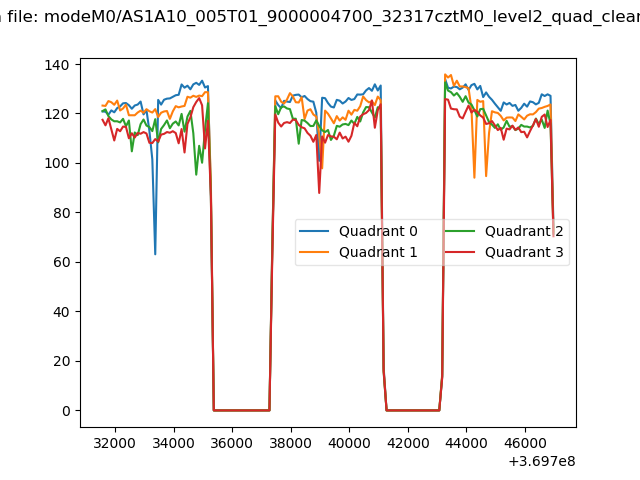
| Quadrant-wise count rates Data is divided into 100 sec bins |
 |
|
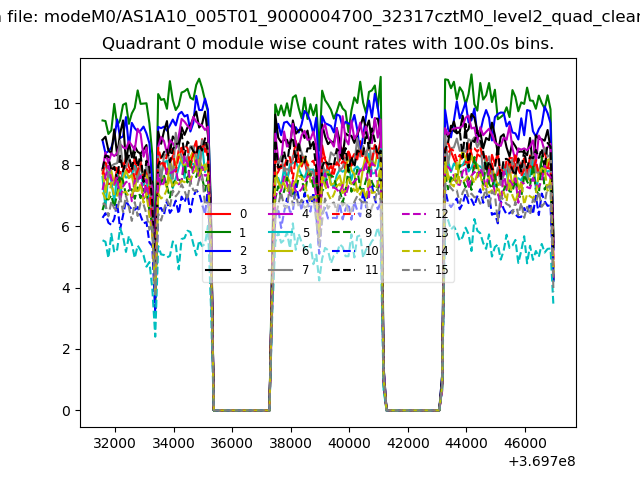
| Module-wise count rates for Quadrant A Data is divided into 100 sec bins |
 |
 |
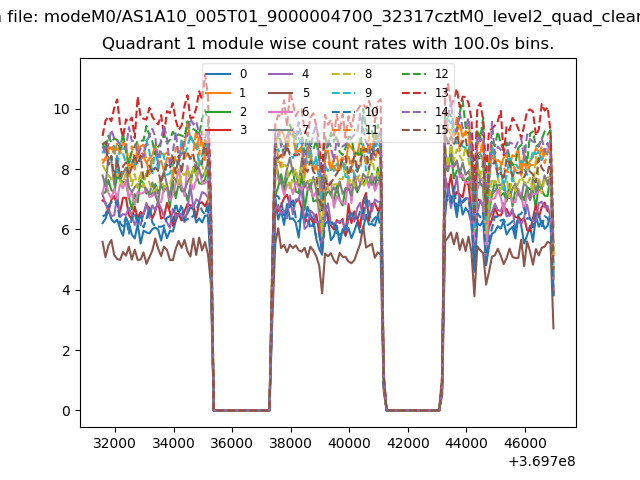
| Module-wise count rates for Quadrant B Data is divided into 100 sec bins |
 |
 |
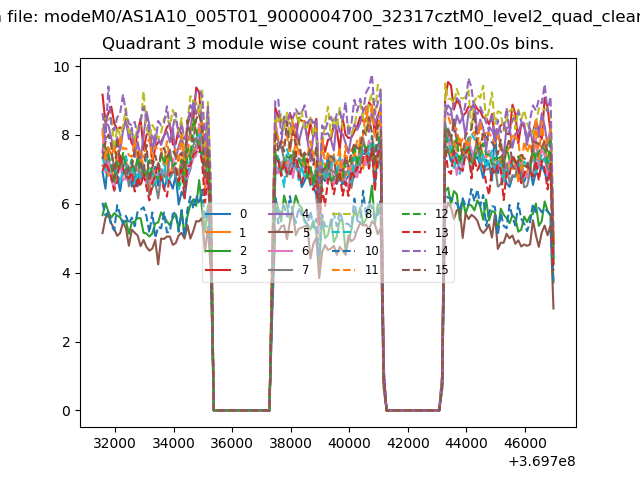
| Module-wise count rates for Quadrant C Data is divided into 100 sec bins |
 |
 |
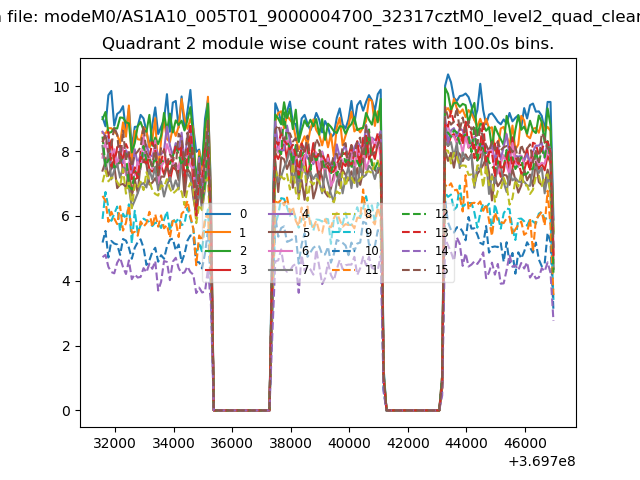
| Module-wise count rates for Quadrant D Data is divided into 100 sec bins |
 |
 |
| Parameter | Plot |
|---|---|
| CZT HV Monitor | 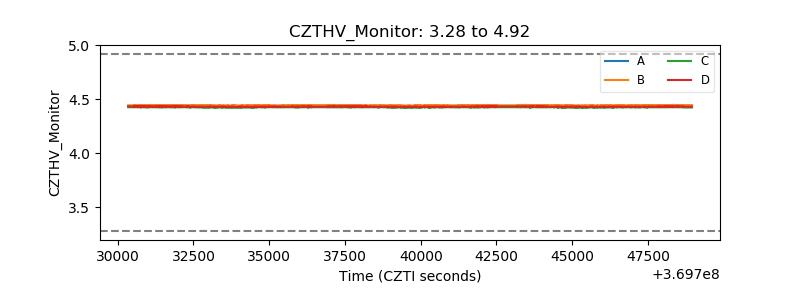 |
| D_VDD | 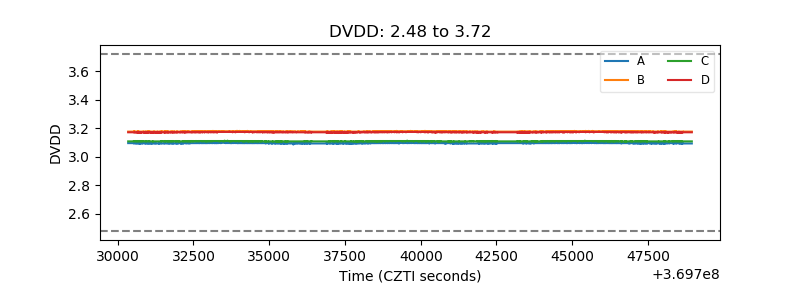 |
| Temperature 1 | 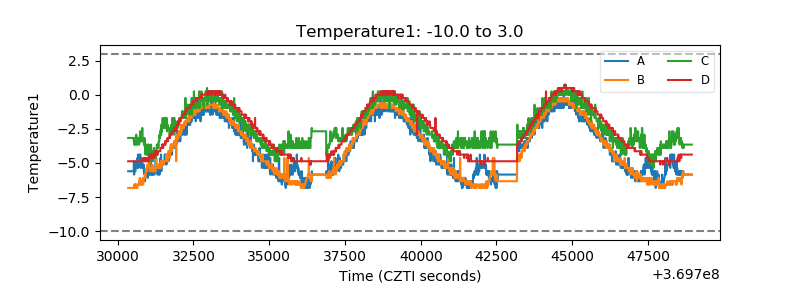 |
| Veto HV Monitor | 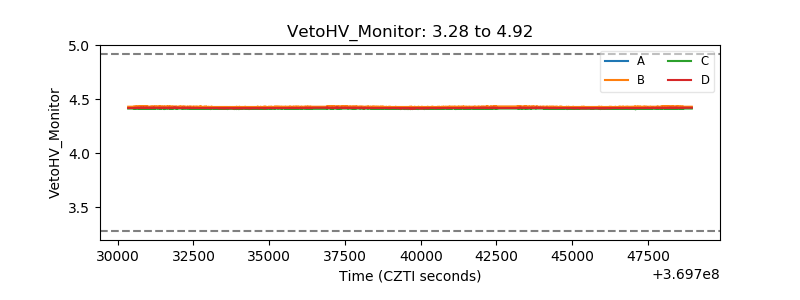 |
| Veto LLD | 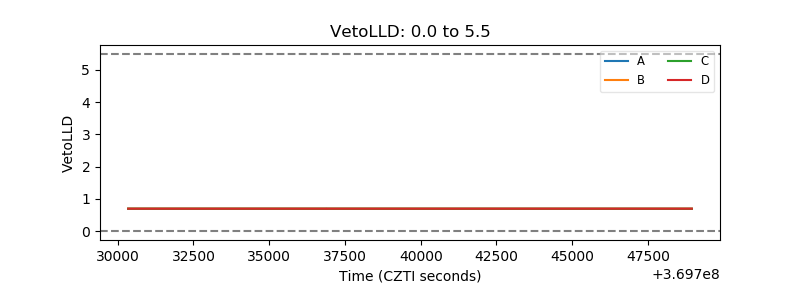 |
| Alpha Counter | 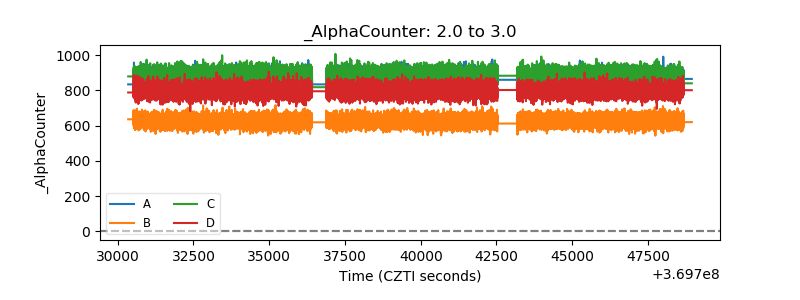 |
| _CPM_Rate | 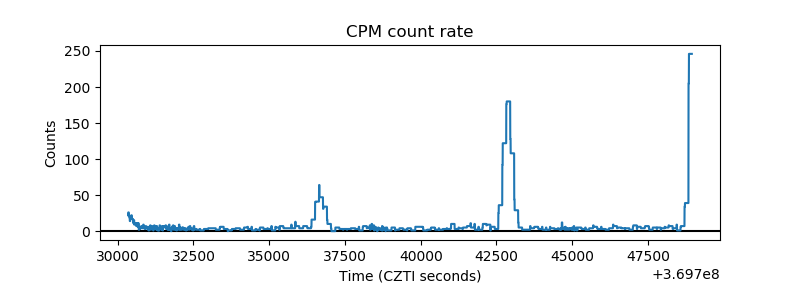 |
| CZT Counter | 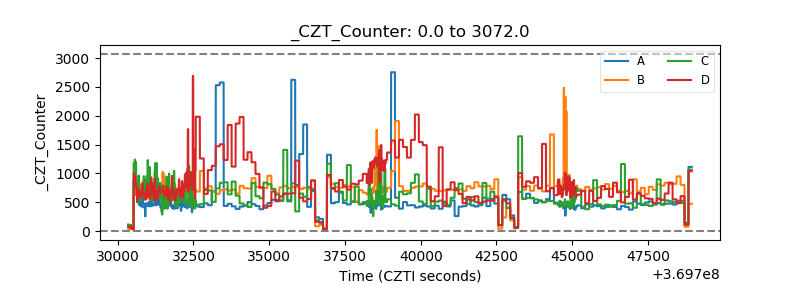 |
| +2.5 Volts monitor | 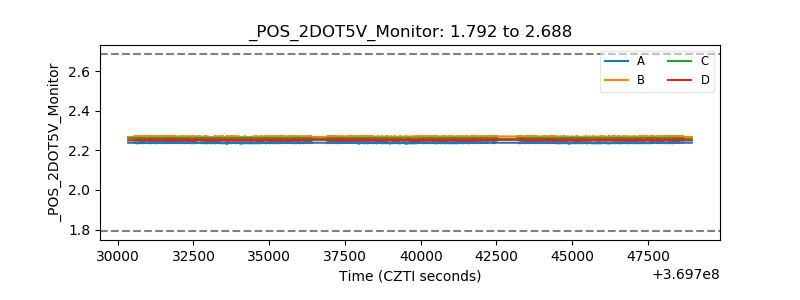 |
| +5 Volts monitor |  |
| _ROLL_ROT | 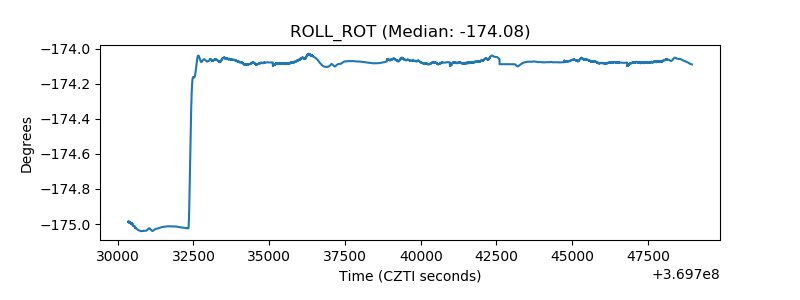 |
| _Roll_DEC | 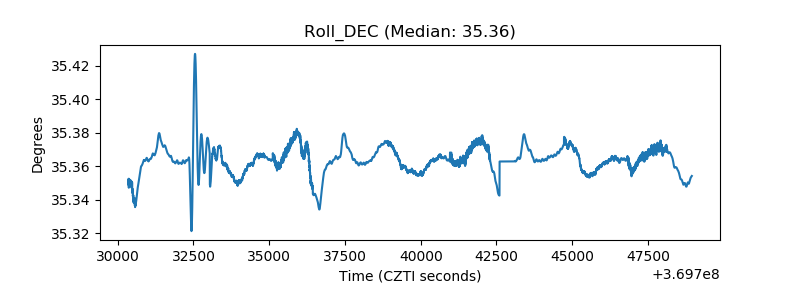 |
| _Roll_RA | 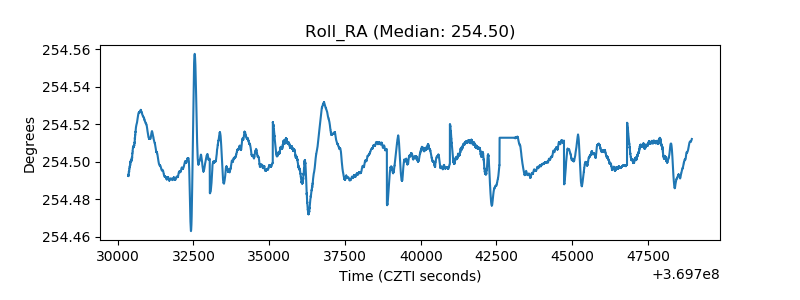 |
| Veto Counter | 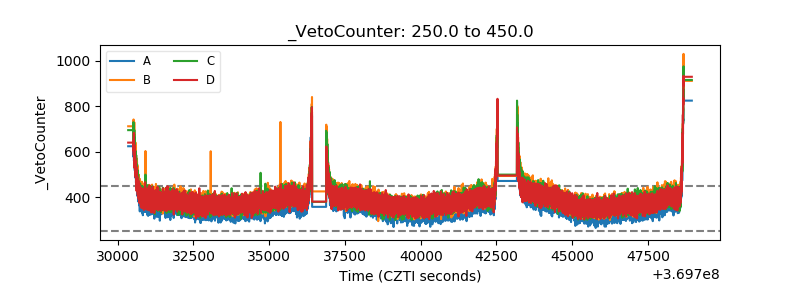 |