| Param | Original file | Final file |
|---|---|---|
| Filename | modeM0/AS1A10_005T01_9000004700_32318cztM0_level2.evt | modeM0/AS1A10_005T01_9000004700_32318cztM0_level2_quad_clean.evt |
| Size (bytes) | 694,189,440 | 100,702,080 |
| Size | 662.0 MB | 96.0 MB |
| Events in quadrant A | 3,395,239 | 680,725 |
| Events in quadrant B | 5,860,761 | 654,976 |
| Events in quadrant C | 4,545,064 | 622,926 |
| Events in quadrant D | 6,752,615 | 605,680 |
| Mode M0 | |||
|---|---|---|---|
| Quadrant | BADHDUFLAG | Total packets | Discarded packets |
| A | 0 | 14599 | 3 |
| B | 0 | 22308 | 2 |
| C | 0 | 18005 | 2 |
| D | 0 | 24847 | 2 |
| Mode M9 | |||
|---|---|---|---|
| Quadrant | BADHDUFLAG | Total packets | Discarded packets |
| A | 0 | 18 | 0 |
| B | 0 | 18 | 0 |
| C | 0 | 18 | 0 |
| D | 0 | 18 | 0 |
| Mode SS | |||
|---|---|---|---|
| Quadrant | BADHDUFLAG | Total packets | Discarded packets |
| A | 0 | 144 | 0 |
| B | 0 | 144 | 0 |
| C | 0 | 144 | 0 |
| D | 0 | 144 | 0 |
| Quadrant | Total seconds | Saturated seconds | Saturation percentage |
|---|---|---|---|
| A | 6964 | 96 | 1.378518% |
| B | 6964 | 234 | 3.360138% |
| C | 6964 | 368 | 5.284319% |
| D | 6964 | 436 | 6.260770% |
Noise dominated data is calculated using 1-second bins in cleaned event files. If a bin has >2000 counts, and if more than 50% of those come from <1% of pixels, then it is considered to be noise-dominated and hence unusable.
| Quadrant | # 1 sec bins | Bins with >0 counts | Bins with >2000 counts | High rate bins dominated by noise | Noise dominated (total time) | Noise dominated (detector-on time) | Marked lightcurve |
|---|---|---|---|---|---|---|---|
| A | 8759 | 6966 | 0 | 0 | 0.00% | 0.00% | 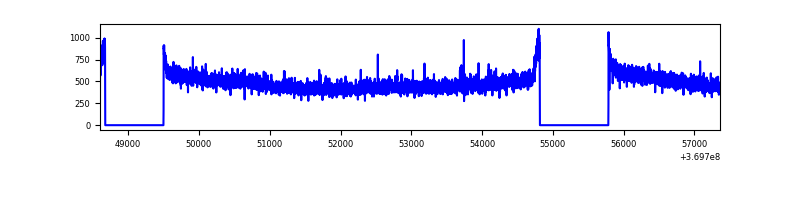 |
| B | 8759 | 6966 | 65 | 65 | 0.74% | 0.93% |  |
| C | 8759 | 6966 | 71 | 71 | 0.81% | 1.02% | 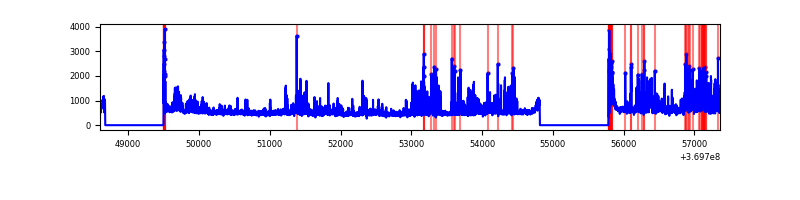 |
| D | 8759 | 6966 | 247 | 247 | 2.82% | 3.55% |  |
Top three noisy pixels from each quadrant. If the there are fewer than three noisy pixels in the level2.evt file, extra rows are filled as -1
| Pixel properties | Quadrant properties | ||||||
|---|---|---|---|---|---|---|---|
| Quadrant | DetID | PixID | Counts | Sigma | Mean | Median | Sigma |
| A | 13 | 6 | 22721 | 124.51 | 868 | 849 | 175.7 |
| A | 12 | 189 | 21703 | 118.71 | 868 | 849 | 175.7 |
| A | 13 | 254 | 14506 | 77.74 | 868 | 849 | 175.7 |
| B | 6 | 159 | 2068134 | 12765.28 | 843 | 821 | 161.9 |
| B | 5 | 172 | 212863 | 1309.32 | 843 | 821 | 161.9 |
| B | 0 | 190 | 166772 | 1024.72 | 843 | 821 | 161.9 |
| C | 0 | 10 | 827021 | 4380.95 | 809 | 817 | 188.6 |
| C | 3 | 233 | 246866 | 1304.68 | 809 | 817 | 188.6 |
| C | 14 | 238 | 147171 | 776.04 | 809 | 817 | 188.6 |
| D | 8 | 195 | 2951407 | 14647.87 | 833 | 808 | 201.4 |
| D | 13 | 249 | 254102 | 1257.45 | 833 | 808 | 201.4 |
| D | 12 | 233 | 167677 | 828.4 | 833 | 808 | 201.4 |
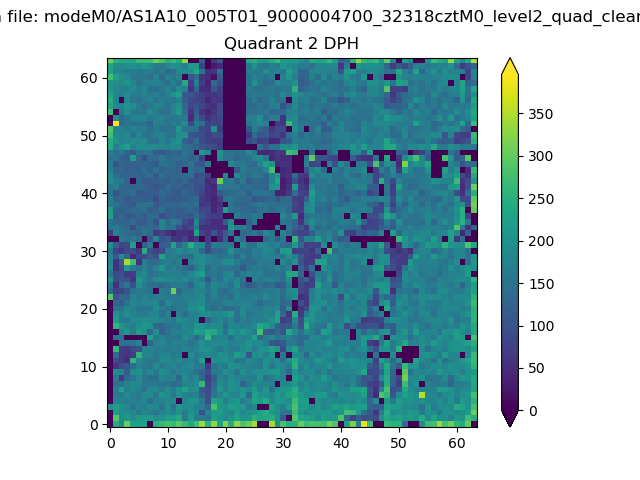
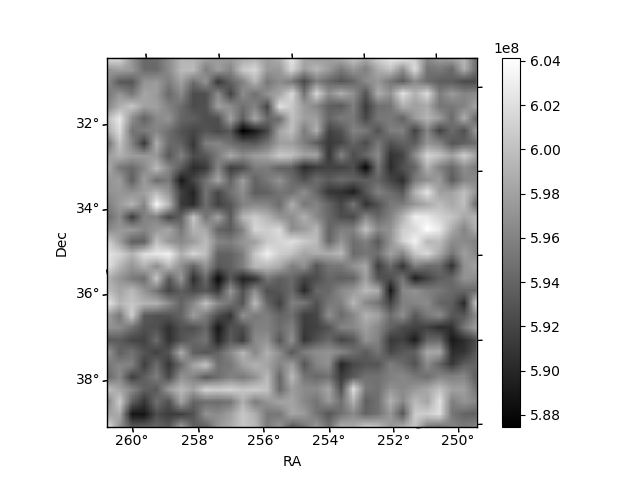
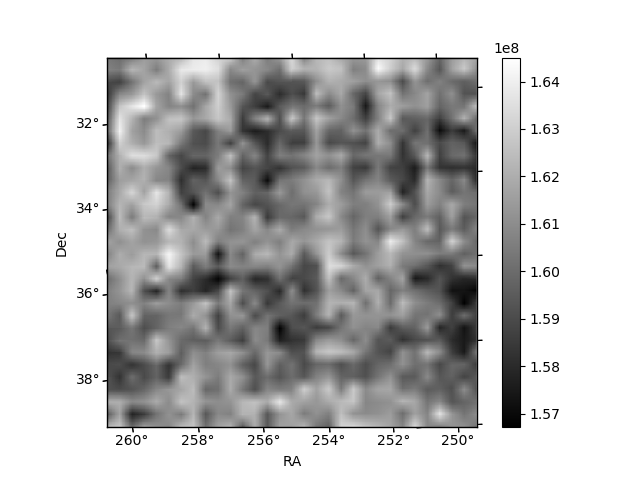
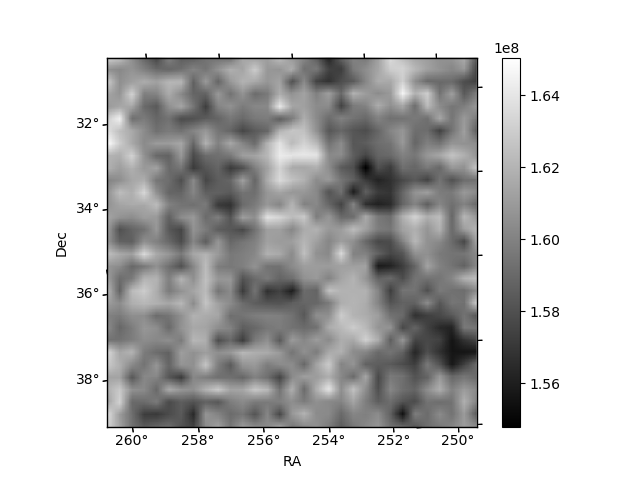
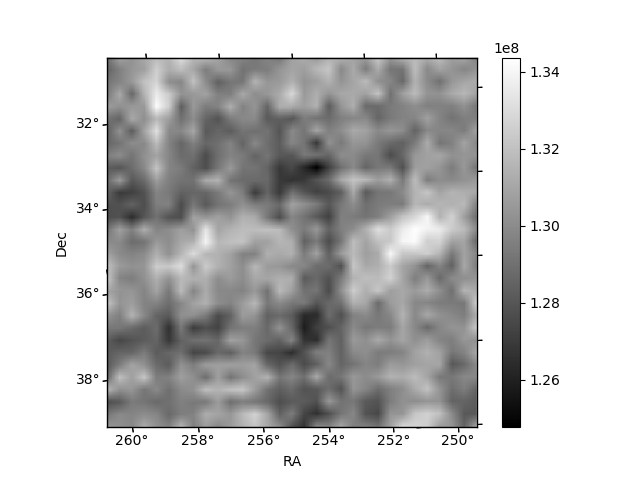
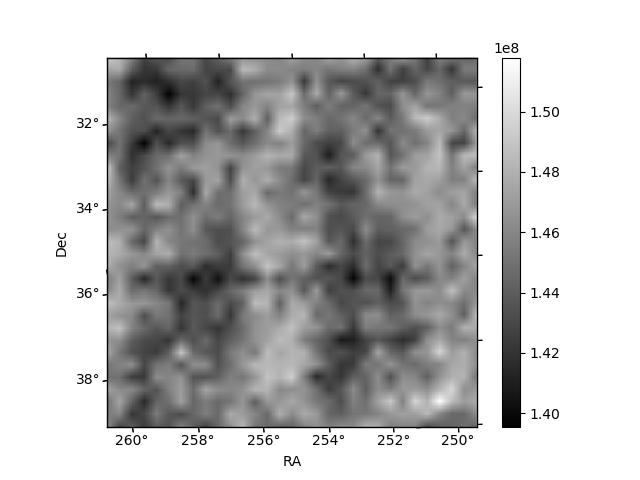
Histogram calculated using DETX and DETY for each event in the final _common_clean file
| Quadrant A |  |
 |
Quadrant B |
|---|---|---|---|
| Quadrant D | 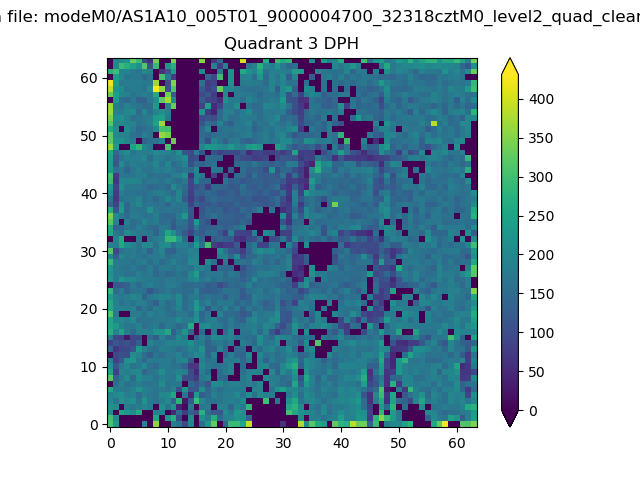 |
 |
Quadrant C |
| Plot type | Count rate plots | Images |
|---|---|---|
| Comparison with Poisson distribution Blue bars denote a histogram of data divided into 1 sec bins. Red curve is a Poisson curve with rate = median count rate of data. |
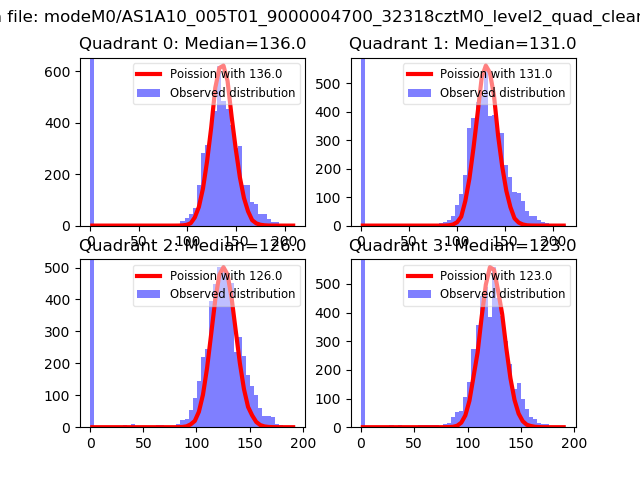 |
 |
| Quadrant-wise count rates Data is divided into 100 sec bins |
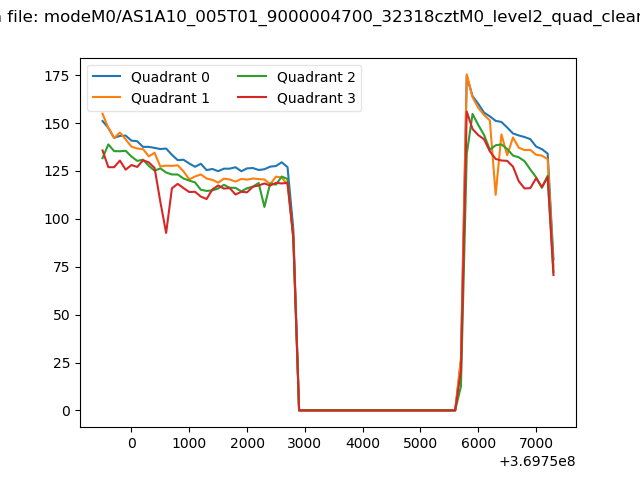 |
|
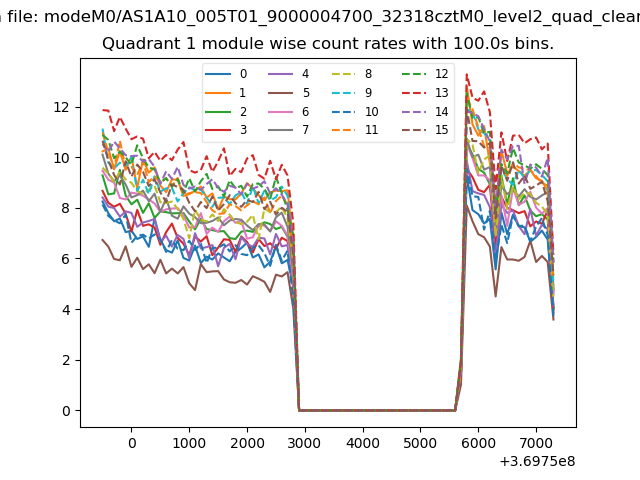
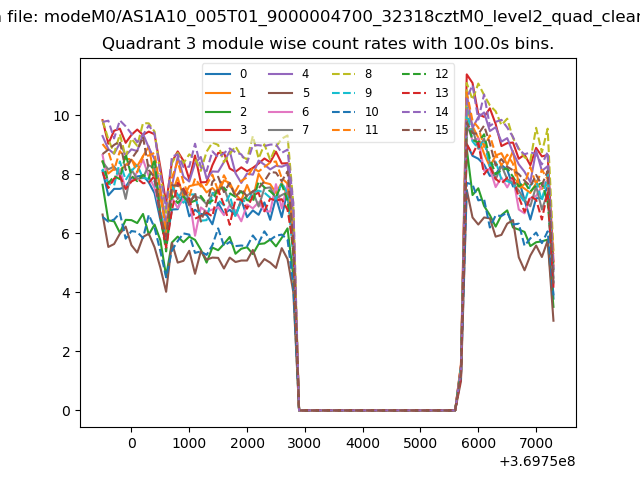
| Module-wise count rates for Quadrant A Data is divided into 100 sec bins |
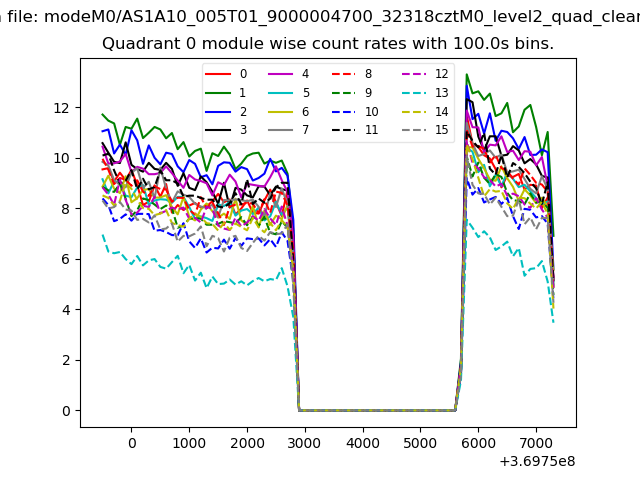 |
 |
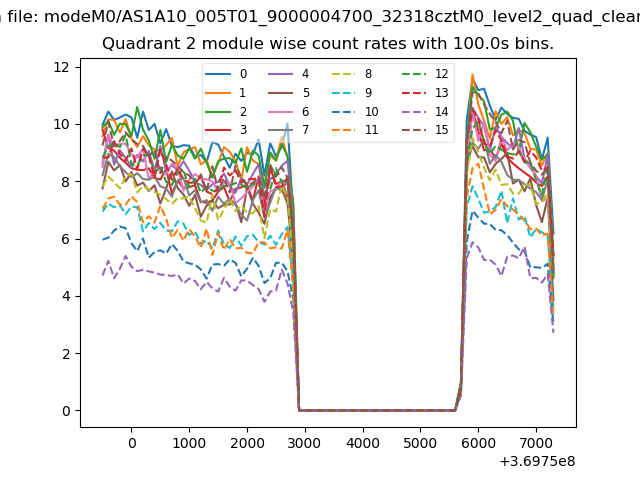
| Module-wise count rates for Quadrant B Data is divided into 100 sec bins |
 |
 |
| Module-wise count rates for Quadrant C Data is divided into 100 sec bins |
 |
 |
| Module-wise count rates for Quadrant D Data is divided into 100 sec bins |
 |
 |
| Parameter | Plot |
|---|---|
| CZT HV Monitor | 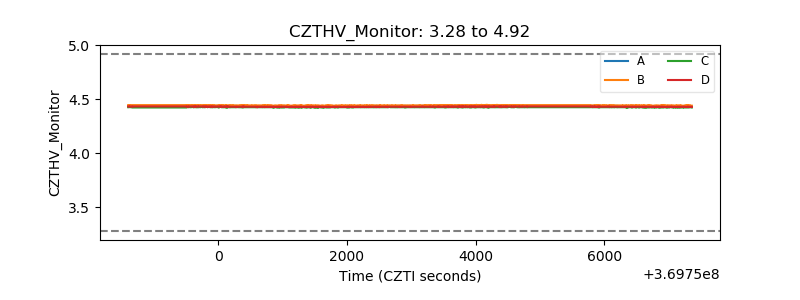 |
| D_VDD | 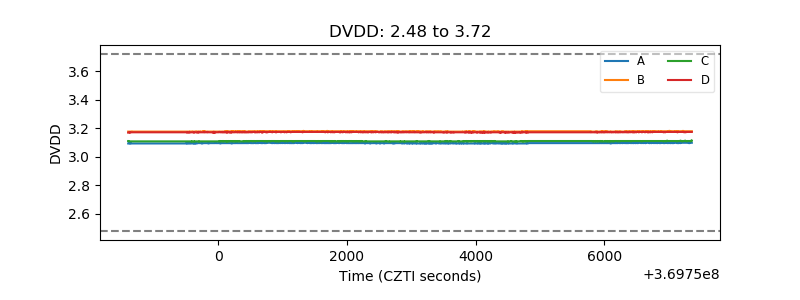 |
| Temperature 1 | 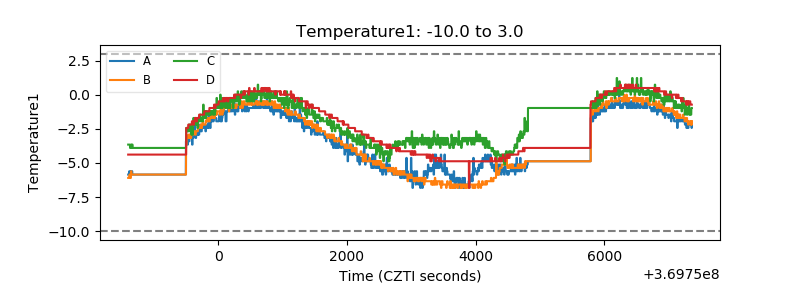 |
| Veto HV Monitor | 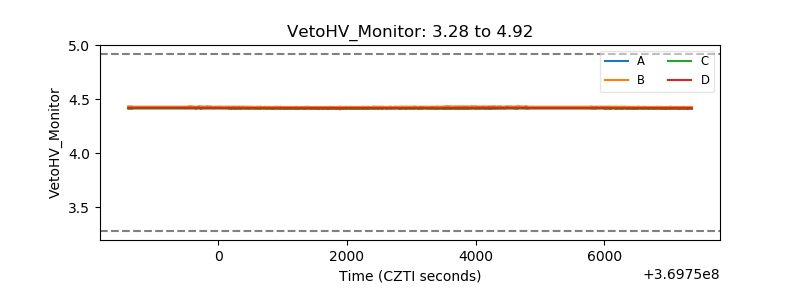 |
| Veto LLD | 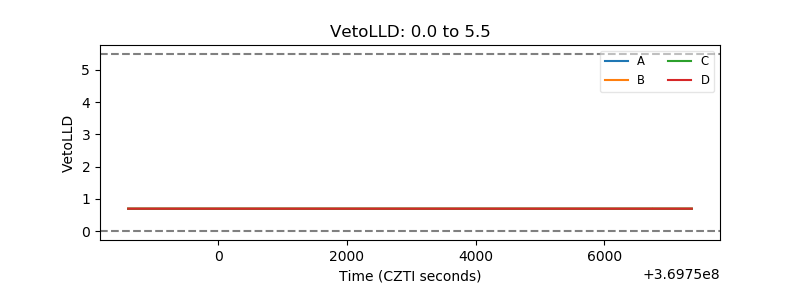 |
| Alpha Counter | 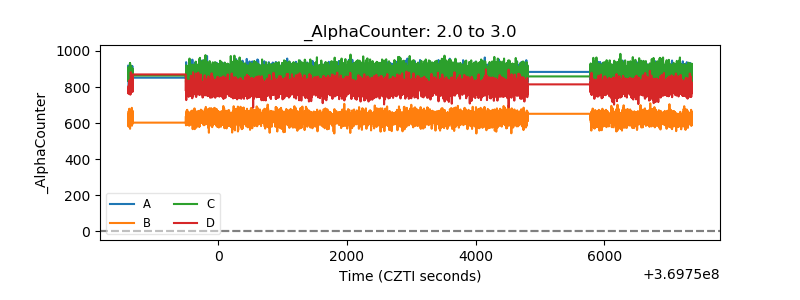 |
| _CPM_Rate | 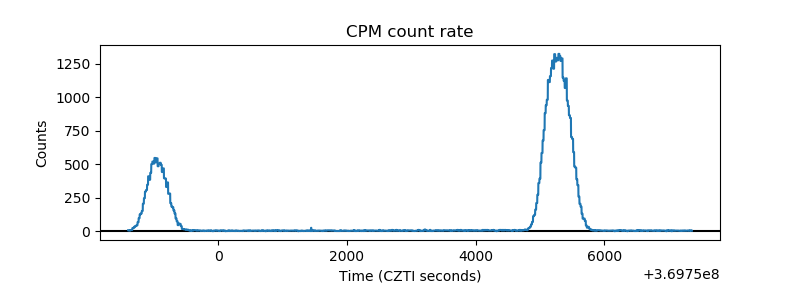 |
| CZT Counter | 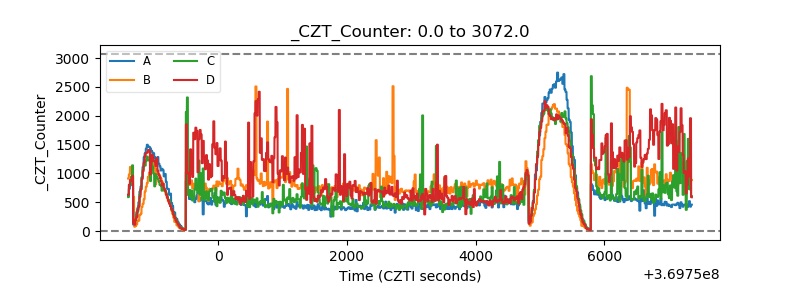 |
| +2.5 Volts monitor |  |
| +5 Volts monitor |  |
| _ROLL_ROT | 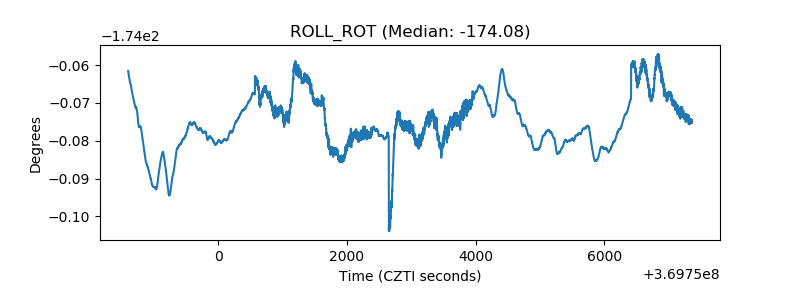 |
| _Roll_DEC | 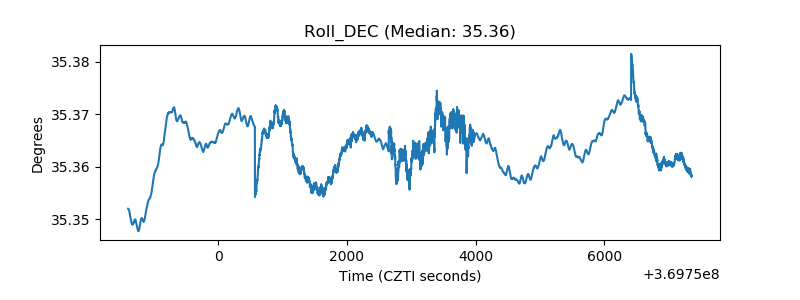 |
| _Roll_RA | 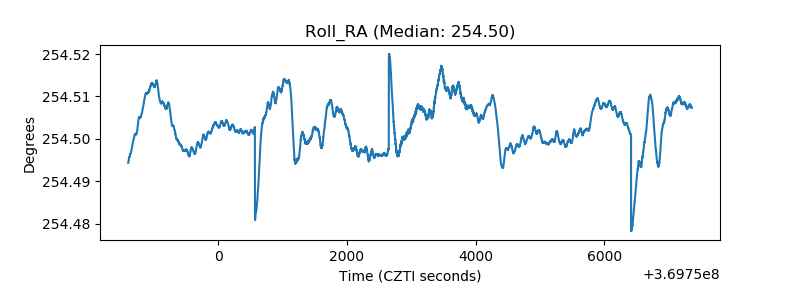 |
| Veto Counter | 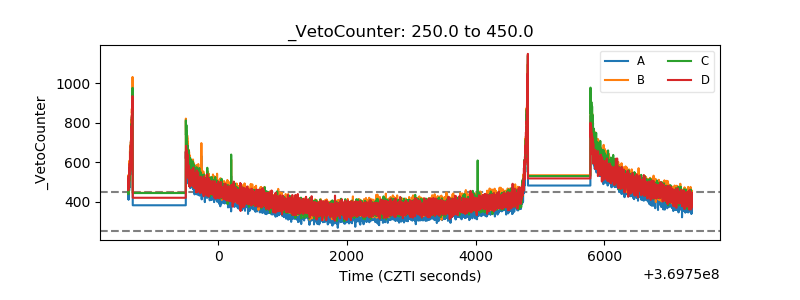 |