| Param | Original file | Final file |
|---|---|---|
| Filename | modeM0/AS1A10_005T01_9000004700_32322cztM0_level2.evt | modeM0/AS1A10_005T01_9000004700_32322cztM0_level2_quad_clean.evt |
| Size (bytes) | 795,384,000 | 96,289,920 |
| Size | 758.5 MB | 91.8 MB |
| Events in quadrant A | 3,218,701 | 673,527 |
| Events in quadrant B | 6,150,172 | 647,078 |
| Events in quadrant C | 7,804,793 | 579,042 |
| Events in quadrant D | 6,493,452 | 578,691 |
| Mode M0 | |||
|---|---|---|---|
| Quadrant | BADHDUFLAG | Total packets | Discarded packets |
| A | 0 | 13463 | 3 |
| B | 0 | 22658 | 2 |
| C | 0 | 27516 | 2 |
| D | 0 | 23392 | 2 |
| Mode M9 | |||
|---|---|---|---|
| Quadrant | BADHDUFLAG | Total packets | Discarded packets |
| A | 0 | 15 | 0 |
| B | 0 | 15 | 0 |
| C | 0 | 15 | 0 |
| D | 0 | 16 | 0 |
| Mode SS | |||
|---|---|---|---|
| Quadrant | BADHDUFLAG | Total packets | Discarded packets |
| A | 0 | 128 | 0 |
| B | 0 | 128 | 0 |
| C | 0 | 128 | 0 |
| D | 0 | 128 | 0 |
| Quadrant | Total seconds | Saturated seconds | Saturation percentage |
|---|---|---|---|
| A | 6257 | 17 | 0.271696% |
| B | 6257 | 435 | 6.952214% |
| C | 6257 | 1692 | 27.041713% |
| D | 6257 | 469 | 7.495605% |
Noise dominated data is calculated using 1-second bins in cleaned event files. If a bin has >2000 counts, and if more than 50% of those come from <1% of pixels, then it is considered to be noise-dominated and hence unusable.
| Quadrant | # 1 sec bins | Bins with >0 counts | Bins with >2000 counts | High rate bins dominated by noise | Noise dominated (total time) | Noise dominated (detector-on time) | Marked lightcurve |
|---|---|---|---|---|---|---|---|
| A | 7557 | 6258 | 0 | 0 | 0.00% | 0.00% | 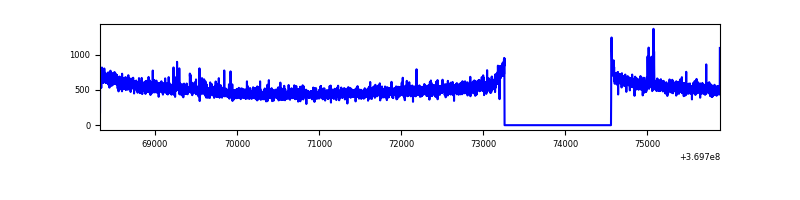 |
| B | 7557 | 6258 | 218 | 218 | 2.88% | 3.48% | 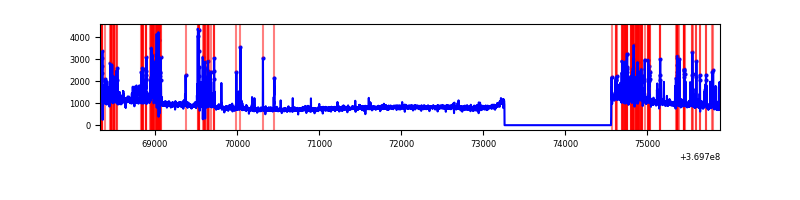 |
| C | 7557 | 6258 | 1006 | 1006 | 13.31% | 16.08% | 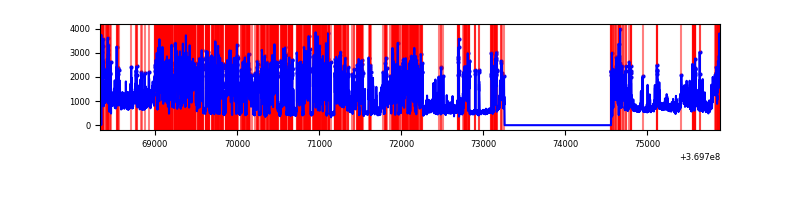 |
| D | 7557 | 6258 | 382 | 382 | 5.05% | 6.10% | 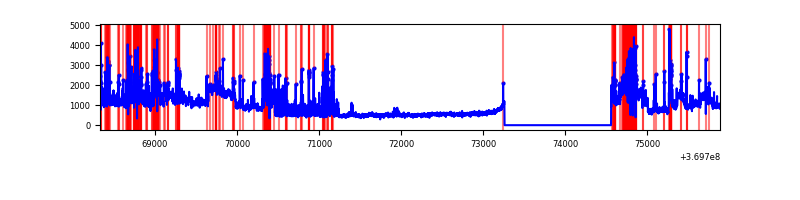 |
Top three noisy pixels from each quadrant. If the there are fewer than three noisy pixels in the level2.evt file, extra rows are filled as -1
| Pixel properties | Quadrant properties | ||||||
|---|---|---|---|---|---|---|---|
| Quadrant | DetID | PixID | Counts | Sigma | Mean | Median | Sigma |
| A | 0 | 6 | 29867 | 178.46 | 821 | 806 | 162.8 |
| A | 13 | 254 | 12640 | 72.67 | 821 | 806 | 162.8 |
| A | 13 | 6 | 11486 | 65.58 | 821 | 806 | 162.8 |
| B | 6 | 159 | 2059655 | 13782.05 | 805 | 787 | 149.4 |
| B | 5 | 172 | 767001 | 5129.03 | 805 | 787 | 149.4 |
| B | 0 | 190 | 63732 | 421.35 | 805 | 787 | 149.4 |
| C | 0 | 10 | 4042008 | 23811.28 | 732 | 738 | 169.7 |
| C | 3 | 233 | 649945 | 3825.14 | 732 | 738 | 169.7 |
| C | 14 | 238 | 117833 | 689.92 | 732 | 738 | 169.7 |
| D | 8 | 195 | 2420042 | 13274.35 | 772 | 755 | 182.3 |
| D | 13 | 249 | 368448 | 2017.49 | 772 | 755 | 182.3 |
| D | 12 | 6 | 344155 | 1884.2 | 772 | 755 | 182.3 |
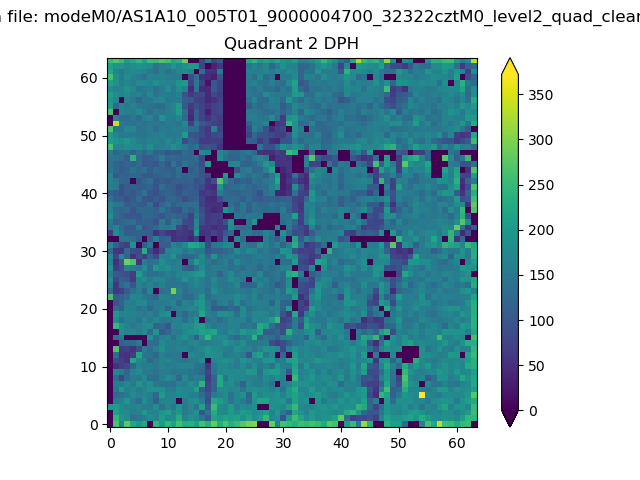
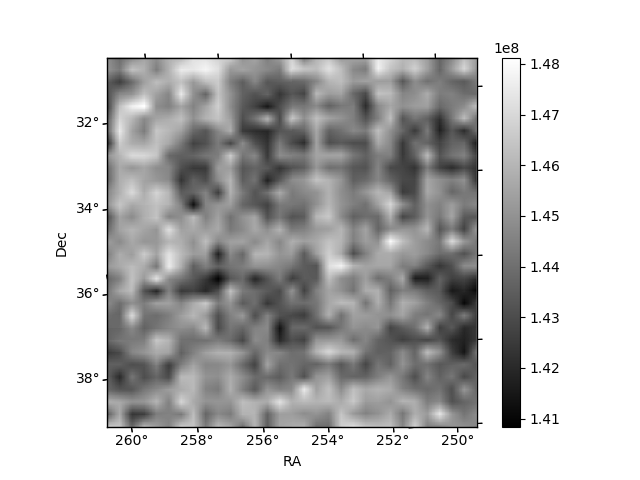
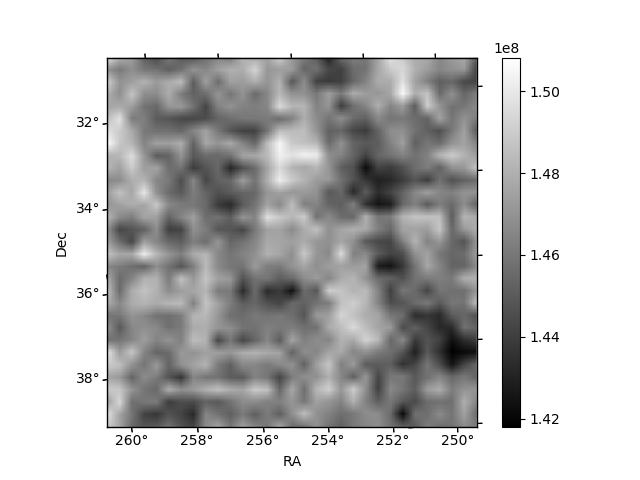
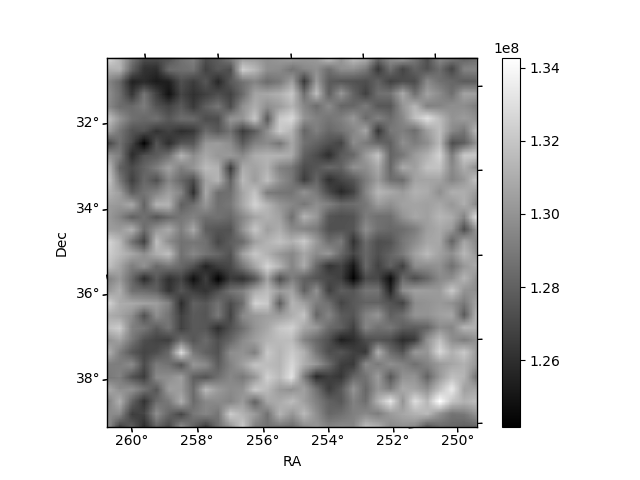
Histogram calculated using DETX and DETY for each event in the final _common_clean file
| Quadrant A | 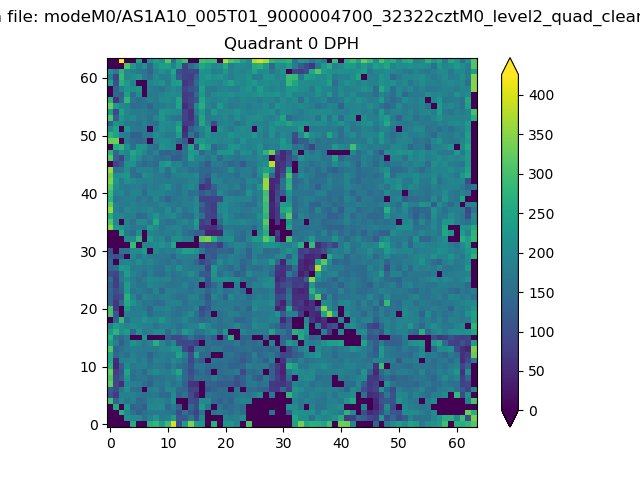 |
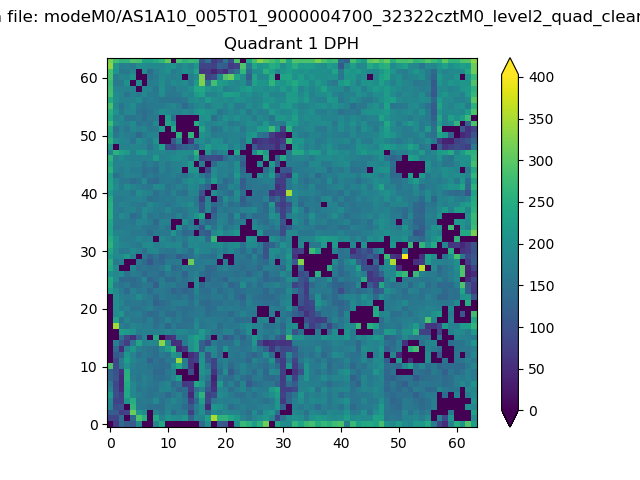 |
Quadrant B |
|---|---|---|---|
| Quadrant D | 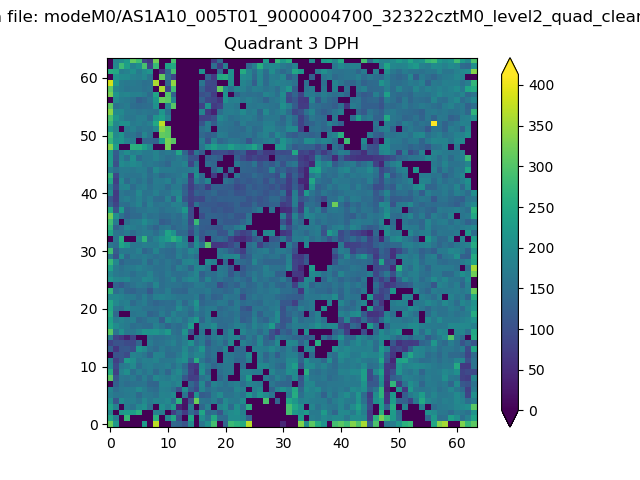 |
 |
Quadrant C |
| Plot type | Count rate plots | Images |
|---|---|---|
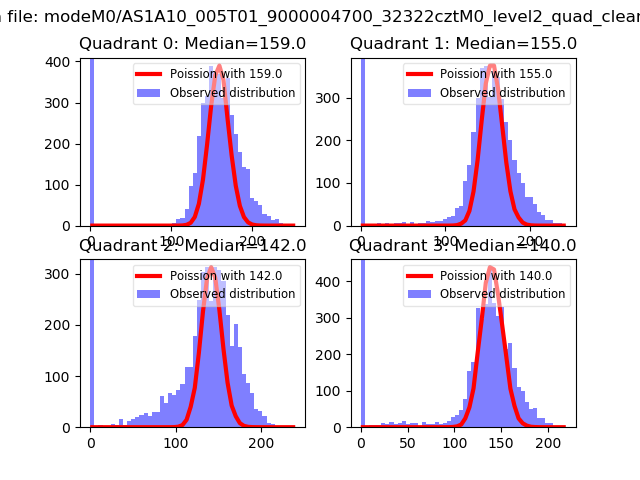
| Comparison with Poisson distribution Blue bars denote a histogram of data divided into 1 sec bins. Red curve is a Poisson curve with rate = median count rate of data. |
 |
 |
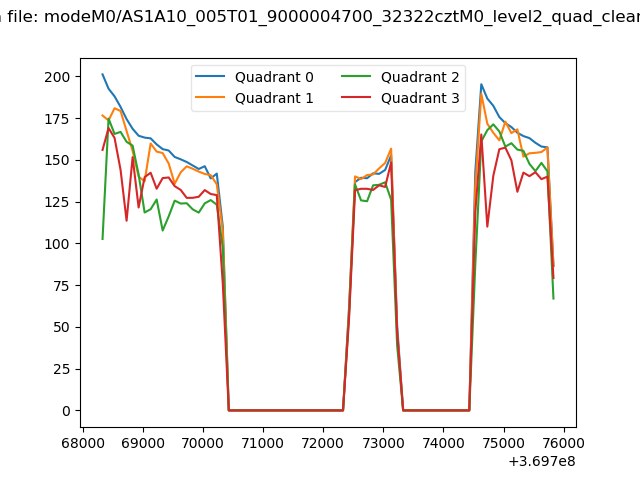
| Quadrant-wise count rates Data is divided into 100 sec bins |
 |
|
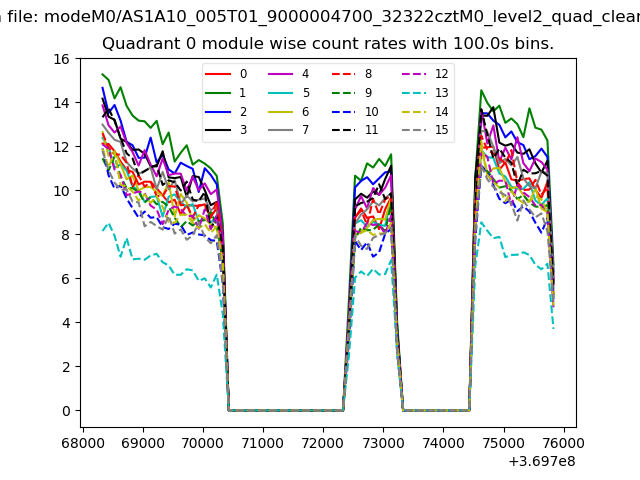
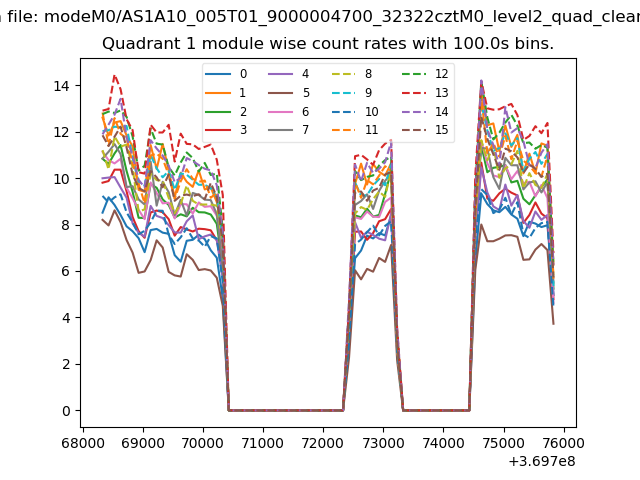
| Module-wise count rates for Quadrant A Data is divided into 100 sec bins |
 |
 |
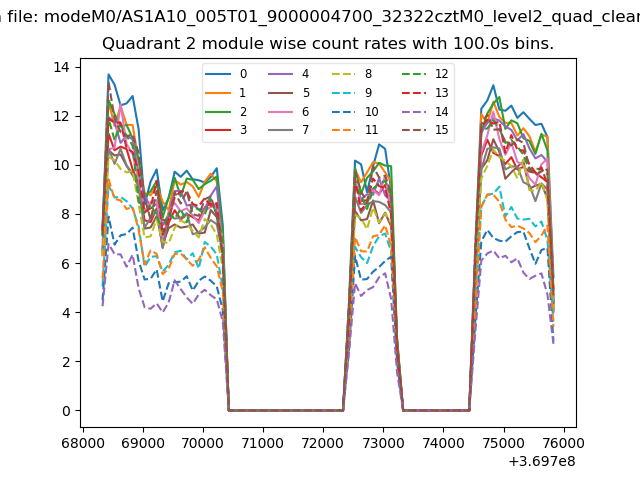
| Module-wise count rates for Quadrant B Data is divided into 100 sec bins |
 |
 |
| Module-wise count rates for Quadrant C Data is divided into 100 sec bins |
 |
 |
| Module-wise count rates for Quadrant D Data is divided into 100 sec bins |
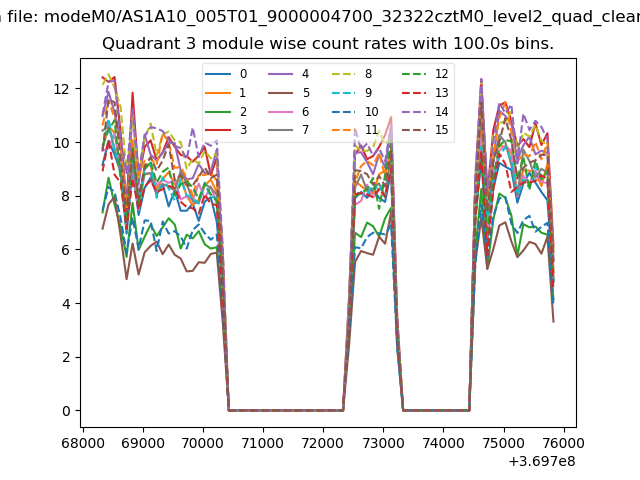 |
 |
| Parameter | Plot |
|---|---|
| CZT HV Monitor | 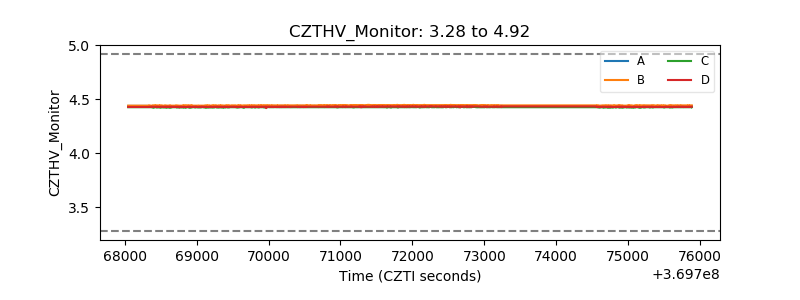 |
| D_VDD | 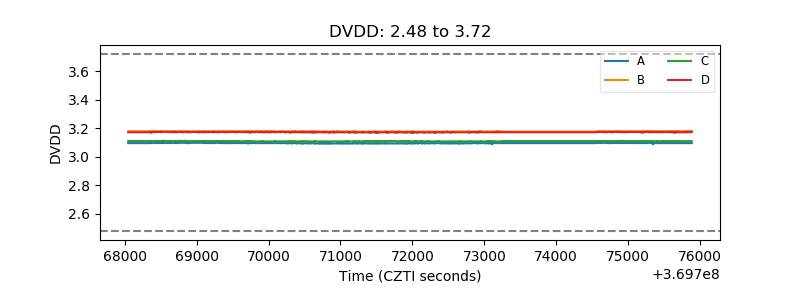 |
| Temperature 1 | 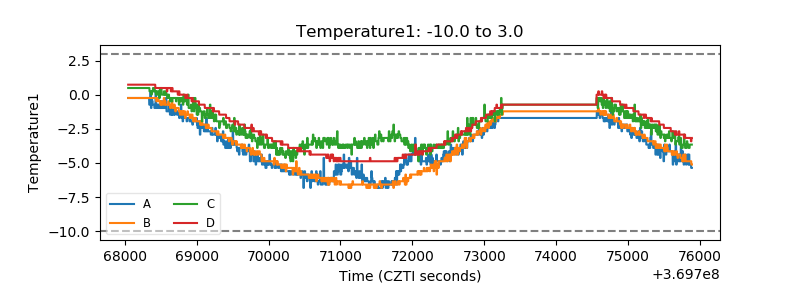 |
| Veto HV Monitor |  |
| Veto LLD | 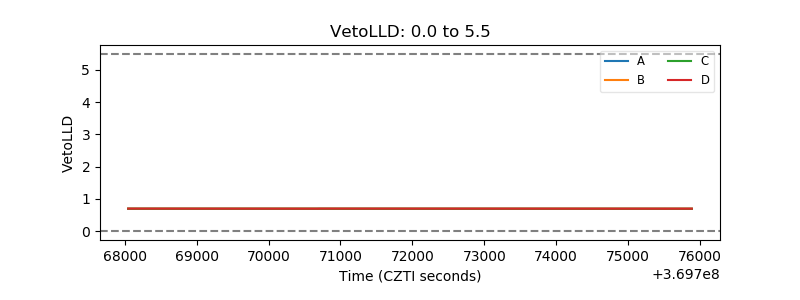 |
| Alpha Counter | 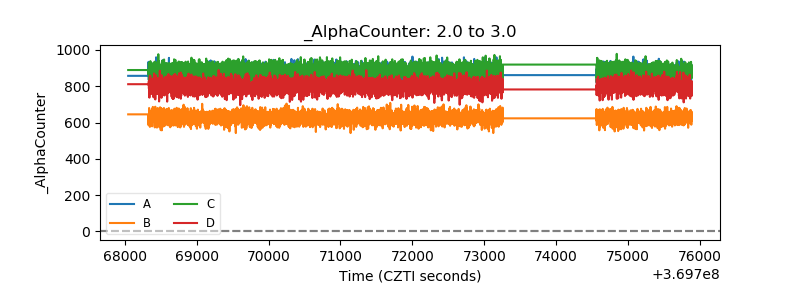 |
| _CPM_Rate | 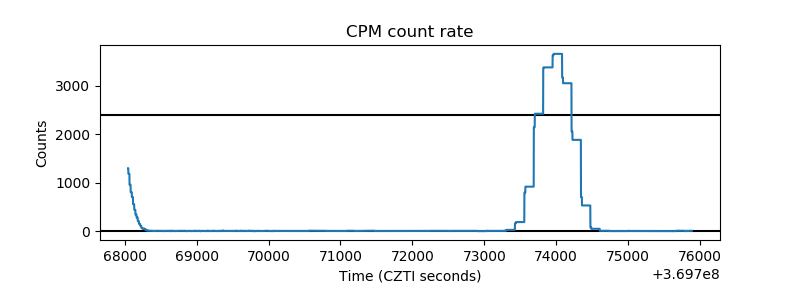 |
| CZT Counter | 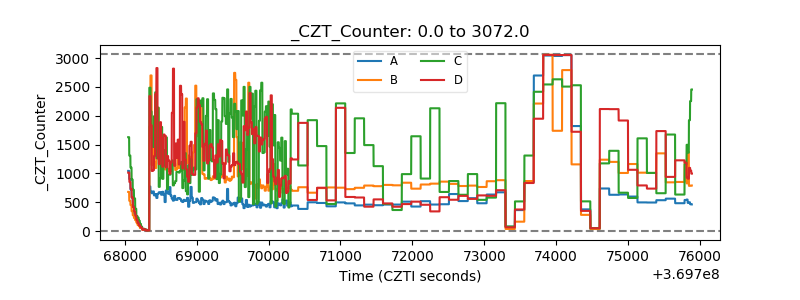 |
| +2.5 Volts monitor | 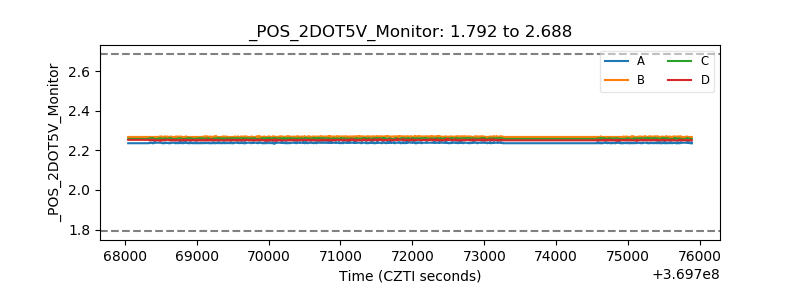 |
| +5 Volts monitor |  |
| _ROLL_ROT | 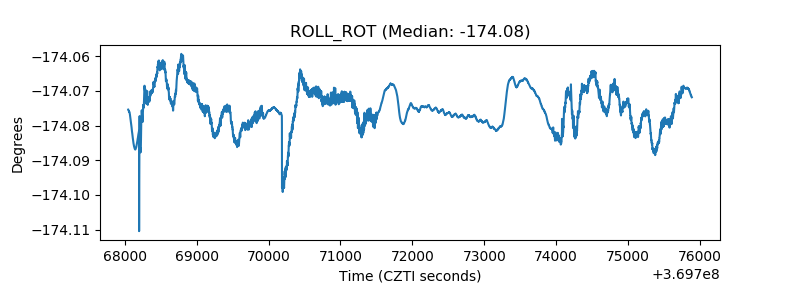 |
| _Roll_DEC | 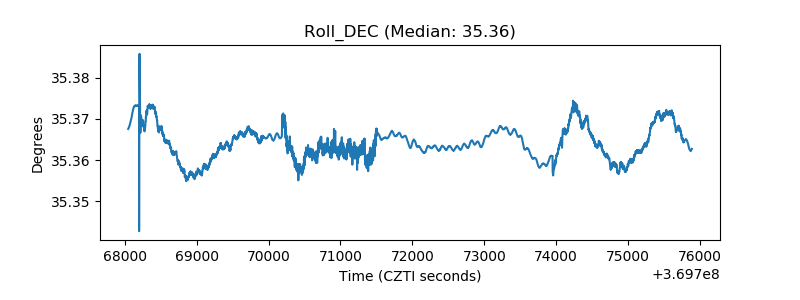 |
| _Roll_RA | 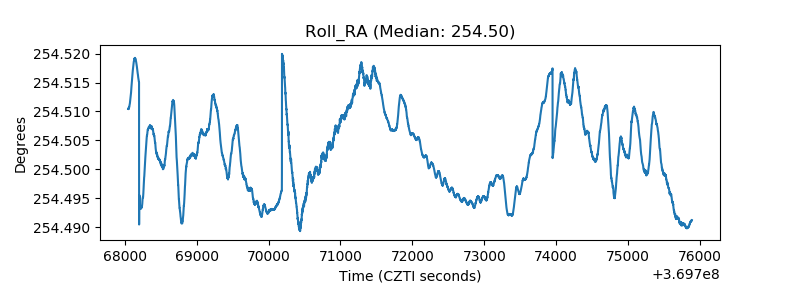 |
| Veto Counter | 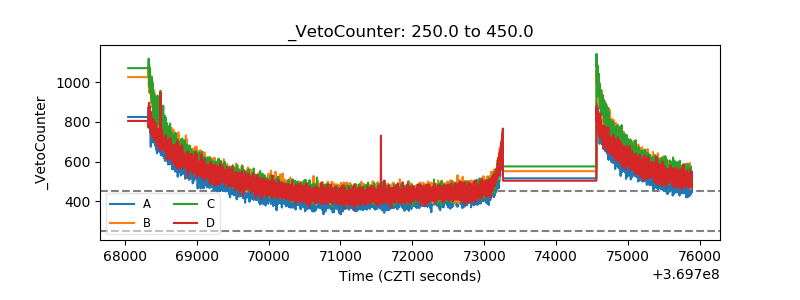 |