| Param | Original file | Final file |
|---|---|---|
| Filename | modeM0/AS1A10_005T01_9000004700_32324cztM0_level2.evt | modeM0/AS1A10_005T01_9000004700_32324cztM0_level2_quad_clean.evt |
| Size (bytes) | 761,636,160 | 84,435,840 |
| Size | 726.4 MB | 80.5 MB |
| Events in quadrant A | 3,197,838 | 579,277 |
| Events in quadrant B | 6,196,767 | 548,350 |
| Events in quadrant C | 5,452,084 | 513,387 |
| Events in quadrant D | 7,792,997 | 473,287 |
| Mode M0 | |||
|---|---|---|---|
| Quadrant | BADHDUFLAG | Total packets | Discarded packets |
| A | 0 | 13350 | 3 |
| B | 0 | 22785 | 2 |
| C | 0 | 20337 | 2 |
| D | 0 | 27495 | 2 |
| Mode M9 | |||
|---|---|---|---|
| Quadrant | BADHDUFLAG | Total packets | Discarded packets |
| A | 0 | 20 | 0 |
| B | 0 | 20 | 0 |
| C | 0 | 20 | 0 |
| D | 0 | 21 | 0 |
| Mode SS | |||
|---|---|---|---|
| Quadrant | BADHDUFLAG | Total packets | Discarded packets |
| A | 0 | 128 | 0 |
| B | 0 | 128 | 0 |
| C | 0 | 128 | 0 |
| D | 0 | 128 | 0 |
| Quadrant | Total seconds | Saturated seconds | Saturation percentage |
|---|---|---|---|
| A | 6333 | 22 | 0.347387% |
| B | 6333 | 519 | 8.195168% |
| C | 6333 | 846 | 13.358598% |
| D | 6333 | 1167 | 18.427286% |
Noise dominated data is calculated using 1-second bins in cleaned event files. If a bin has >2000 counts, and if more than 50% of those come from <1% of pixels, then it is considered to be noise-dominated and hence unusable.
| Quadrant | # 1 sec bins | Bins with >0 counts | Bins with >2000 counts | High rate bins dominated by noise | Noise dominated (total time) | Noise dominated (detector-on time) | Marked lightcurve |
|---|---|---|---|---|---|---|---|
| A | 7598 | 6334 | 0 | 0 | 0.00% | 0.00% | 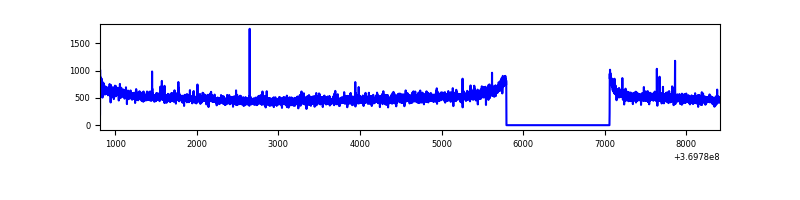 |
| B | 7598 | 6334 | 272 | 272 | 3.58% | 4.29% | 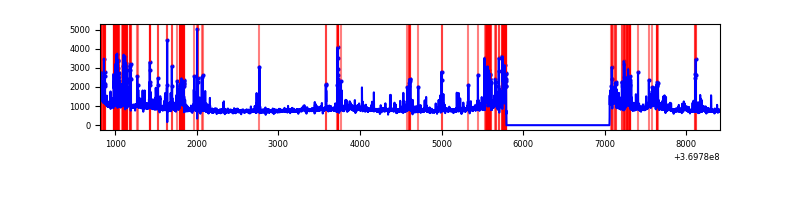 |
| C | 7598 | 6334 | 530 | 530 | 6.98% | 8.37% | 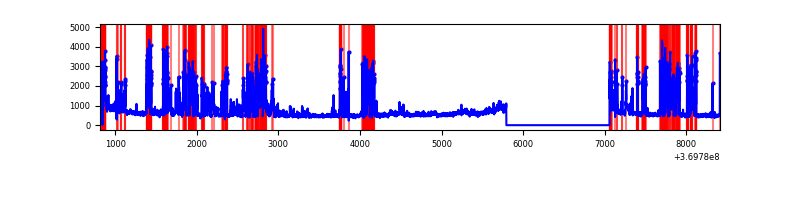 |
| D | 7598 | 6334 | 1032 | 1032 | 13.58% | 16.29% | 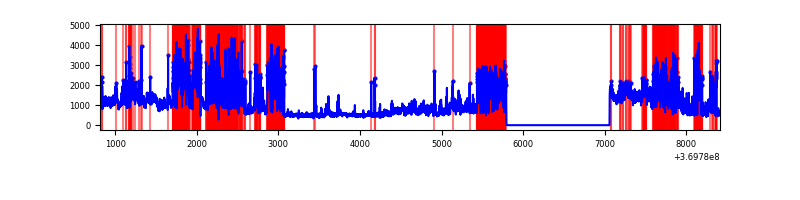 |
Top three noisy pixels from each quadrant. If the there are fewer than three noisy pixels in the level2.evt file, extra rows are filled as -1
| Pixel properties | Quadrant properties | ||||||
|---|---|---|---|---|---|---|---|
| Quadrant | DetID | PixID | Counts | Sigma | Mean | Median | Sigma |
| A | 13 | 6 | 27179 | 163.14 | 813 | 796 | 161.7 |
| A | 12 | 189 | 16877 | 99.44 | 813 | 796 | 161.7 |
| A | 13 | 254 | 12344 | 71.41 | 813 | 796 | 161.7 |
| B | 6 | 159 | 1861757 | 12684.98 | 786 | 767 | 146.7 |
| B | 5 | 172 | 646776 | 4403.36 | 786 | 767 | 146.7 |
| B | 10 | 245 | 367122 | 2497.17 | 786 | 767 | 146.7 |
| C | 0 | 10 | 2086246 | 11947.48 | 743 | 750 | 174.6 |
| C | 3 | 233 | 228047 | 1302.15 | 743 | 750 | 174.6 |
| C | 14 | 238 | 121188 | 689.97 | 743 | 750 | 174.6 |
| D | 13 | 174 | 2233397 | 12884.03 | 722 | 703 | 173.3 |
| D | 8 | 195 | 1494377 | 8619.43 | 722 | 703 | 173.3 |
| D | 13 | 249 | 1055227 | 6085.26 | 722 | 703 | 173.3 |
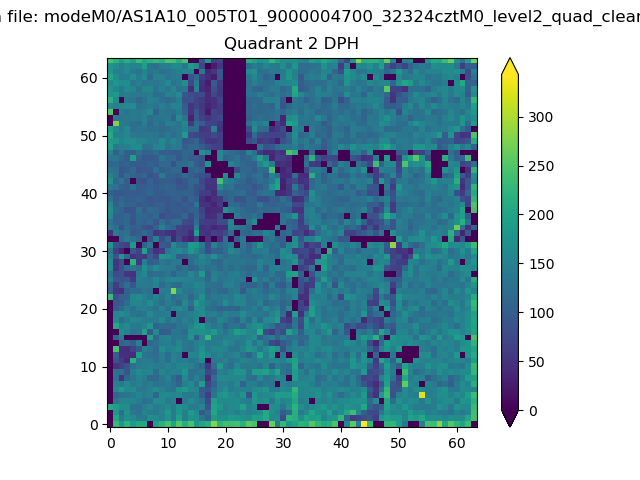
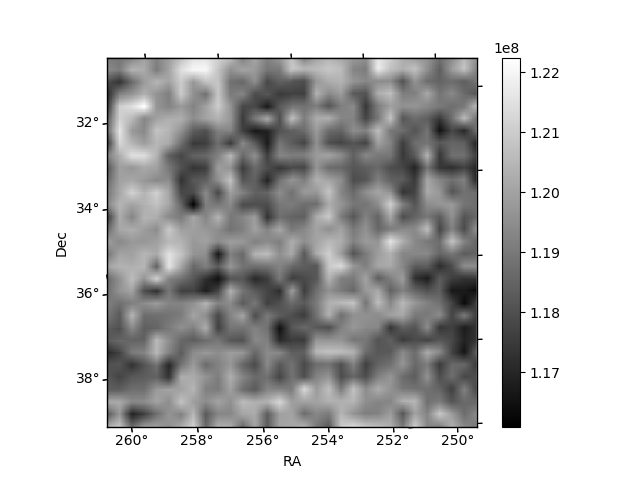
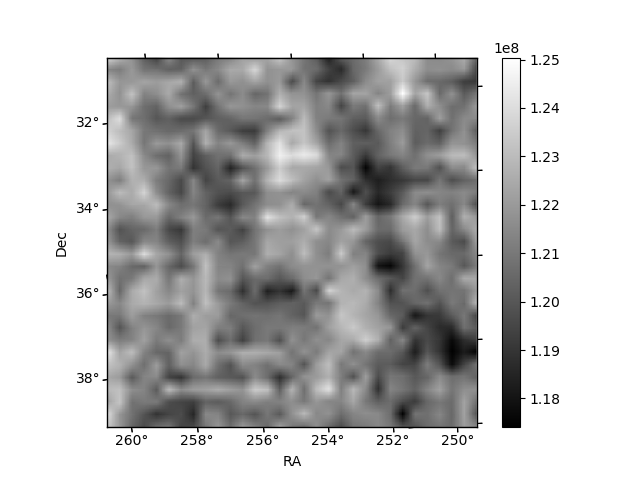
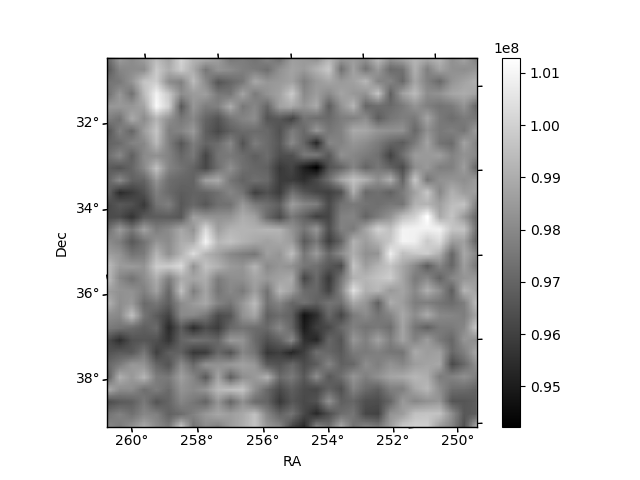
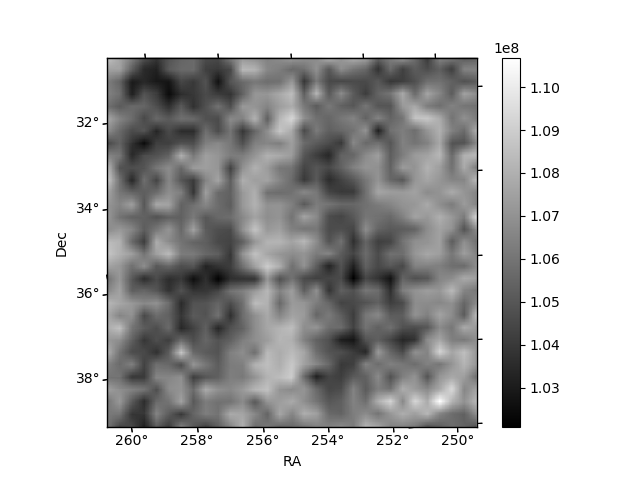
Histogram calculated using DETX and DETY for each event in the final _common_clean file
| Quadrant A | 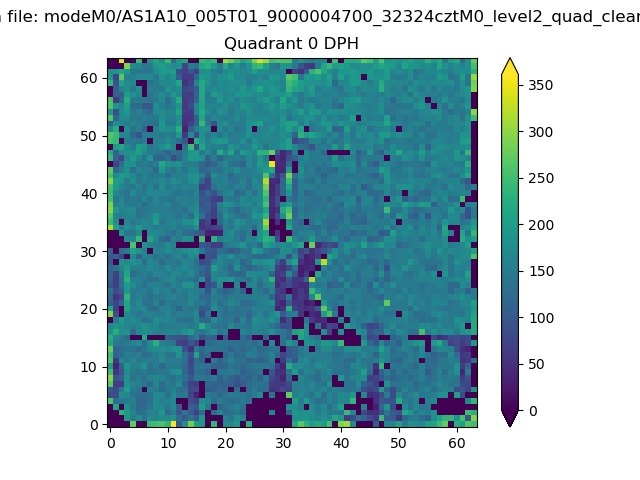 |
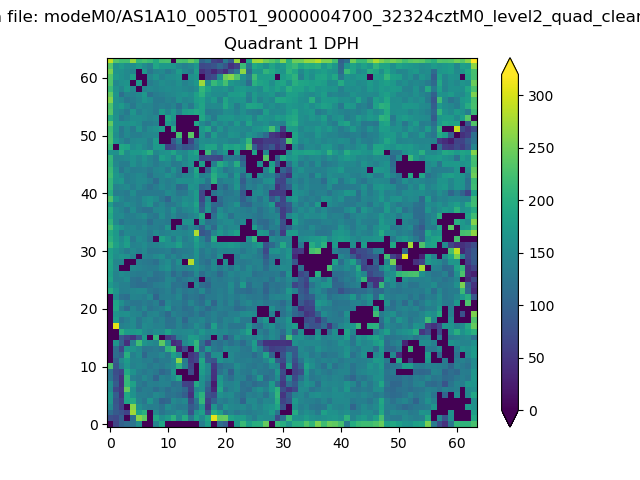 |
Quadrant B |
|---|---|---|---|
| Quadrant D | 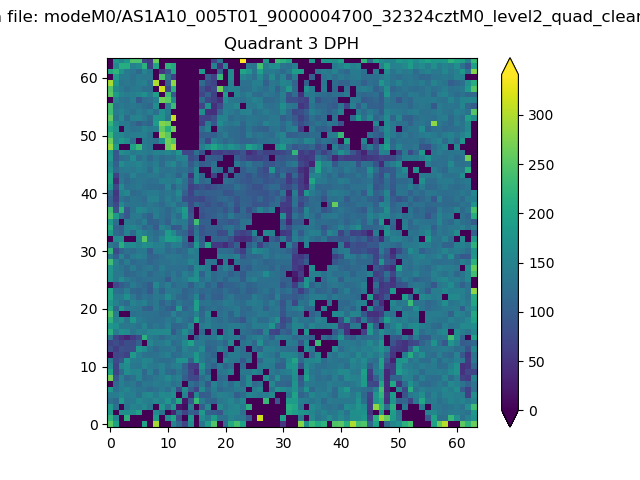 |
 |
Quadrant C |
| Plot type | Count rate plots | Images |
|---|---|---|
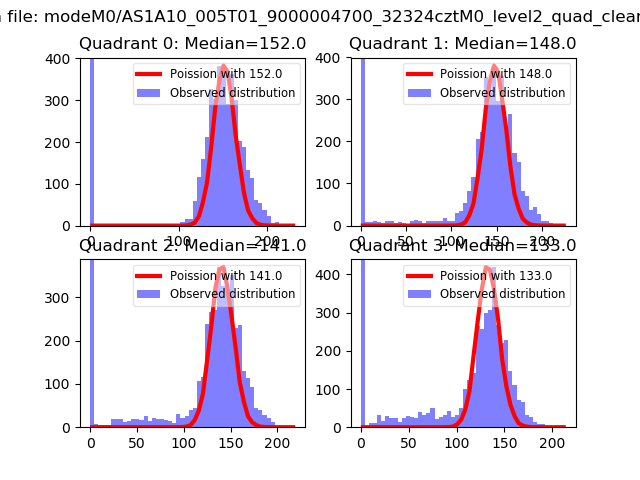
| Comparison with Poisson distribution Blue bars denote a histogram of data divided into 1 sec bins. Red curve is a Poisson curve with rate = median count rate of data. |
 |
 |
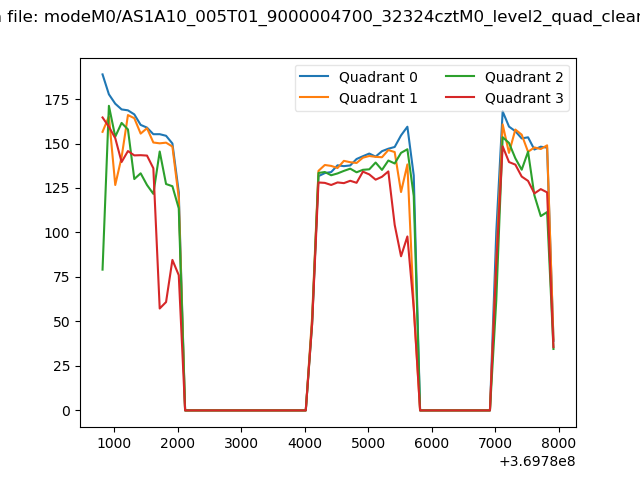
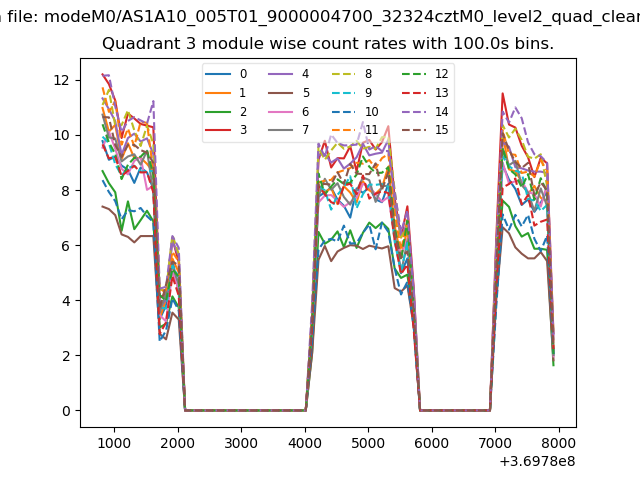
| Quadrant-wise count rates Data is divided into 100 sec bins |
 |
|
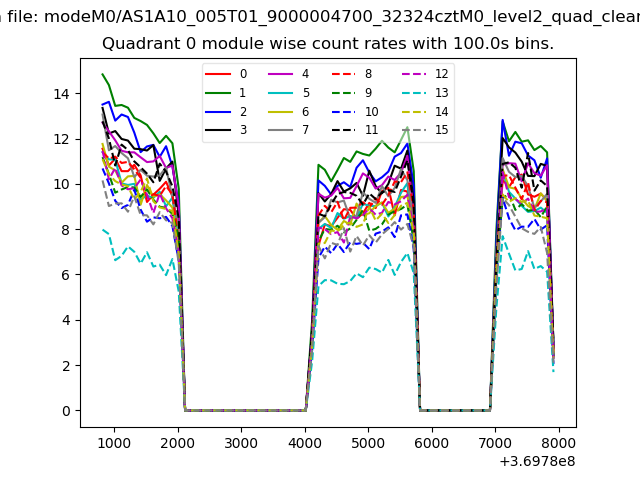
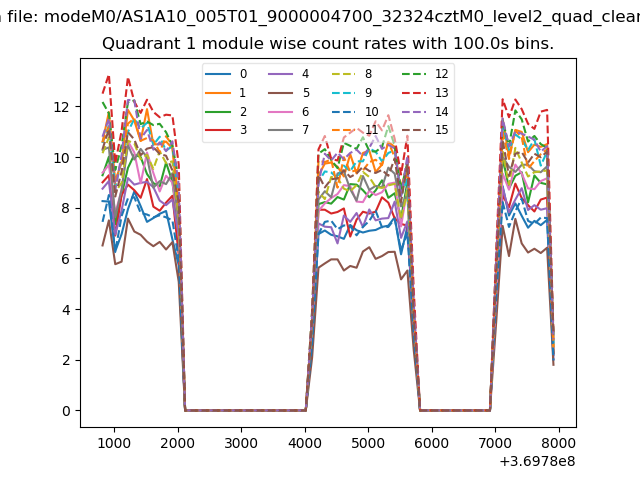
| Module-wise count rates for Quadrant A Data is divided into 100 sec bins |
 |
 |
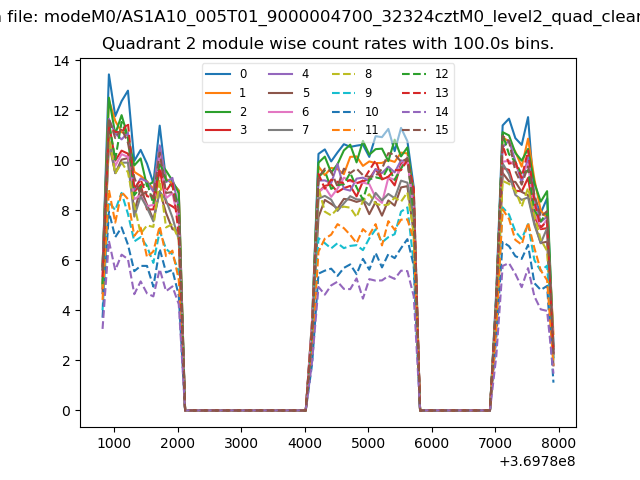
| Module-wise count rates for Quadrant B Data is divided into 100 sec bins |
 |
 |
| Module-wise count rates for Quadrant C Data is divided into 100 sec bins |
 |
 |
| Module-wise count rates for Quadrant D Data is divided into 100 sec bins |
 |
 |
| Parameter | Plot |
|---|---|
| CZT HV Monitor | 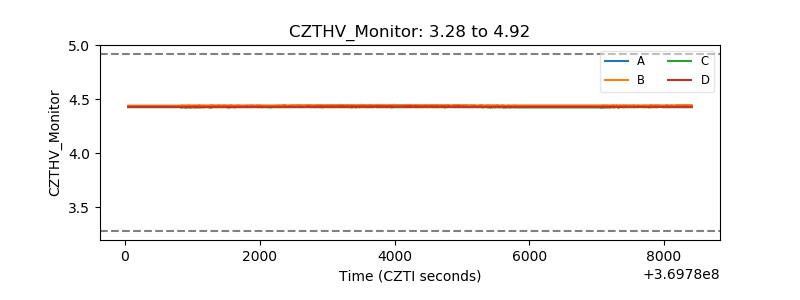 |
| D_VDD | 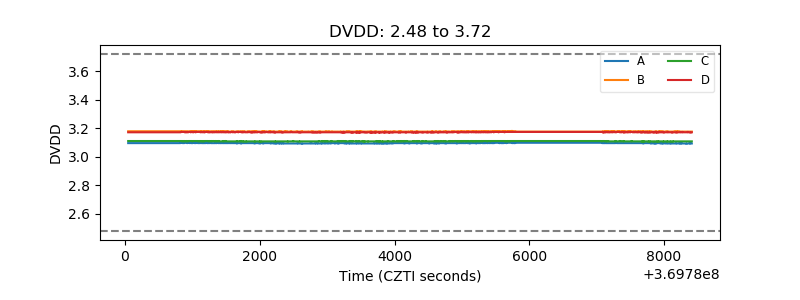 |
| Temperature 1 | 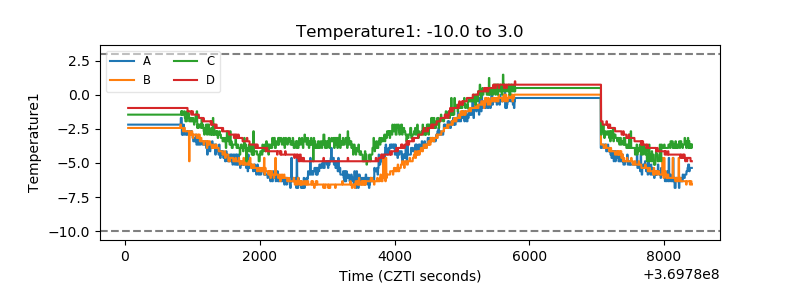 |
| Veto HV Monitor | 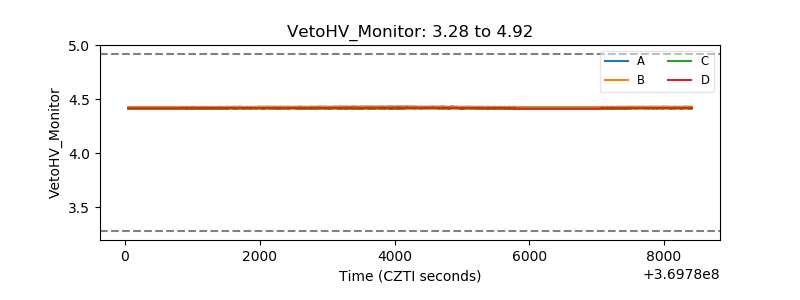 |
| Veto LLD |  |
| Alpha Counter | 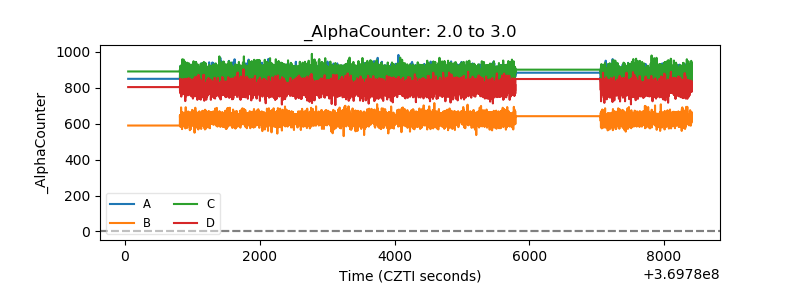 |
| _CPM_Rate | 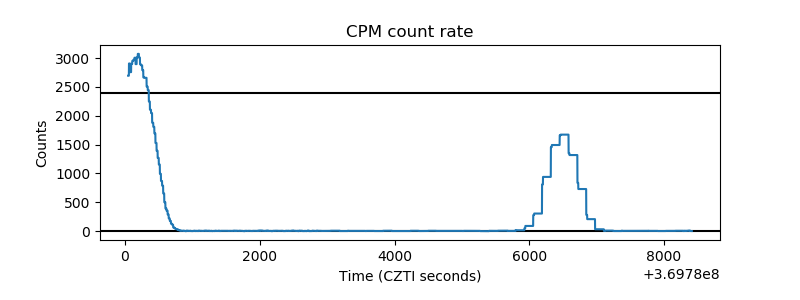 |
| CZT Counter | 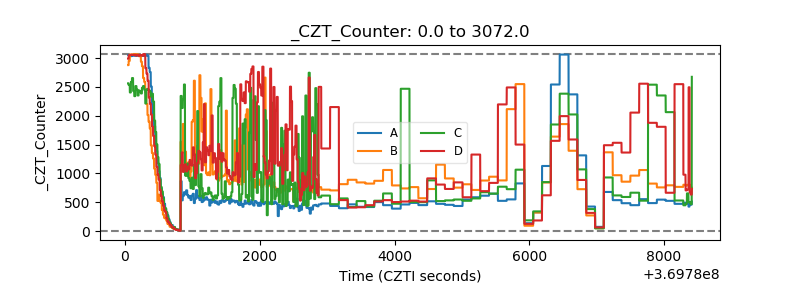 |
| +2.5 Volts monitor |  |
| +5 Volts monitor |  |
| _ROLL_ROT | 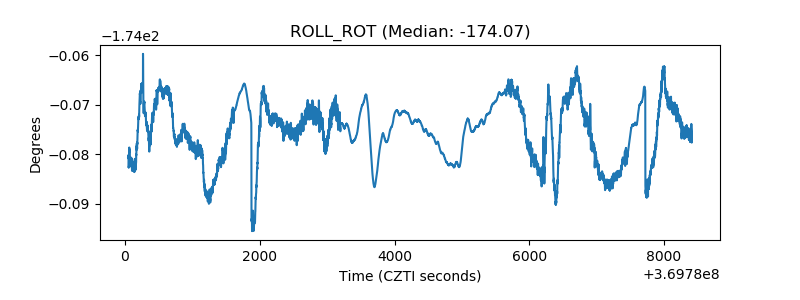 |
| _Roll_DEC | 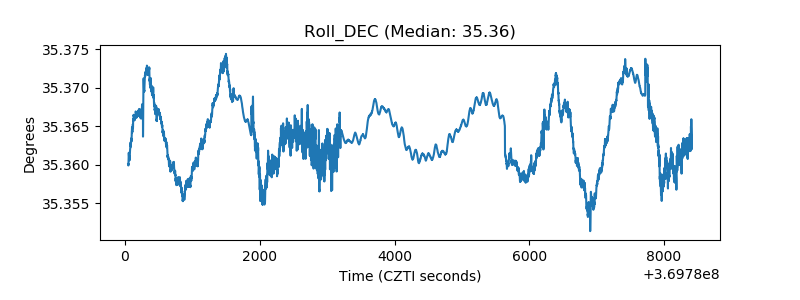 |
| _Roll_RA | 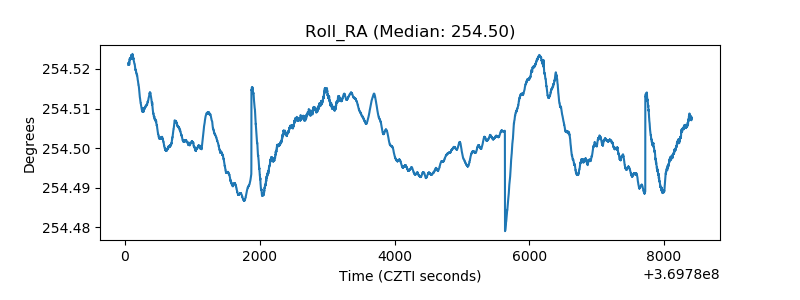 |
| Veto Counter | 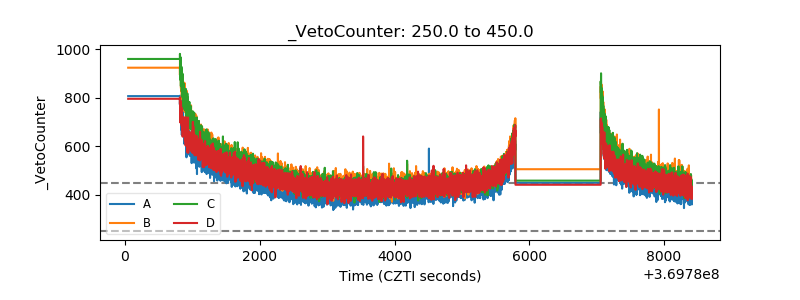 |