| Param | Original file | Final file |
|---|---|---|
| Filename | modeM0/AS1A10_005T01_9000004700_32325cztM0_level2.evt | modeM0/AS1A10_005T01_9000004700_32325cztM0_level2_quad_clean.evt |
| Size (bytes) | 799,485,120 | 78,534,720 |
| Size | 762.4 MB | 74.9 MB |
| Events in quadrant A | 3,318,227 | 521,077 |
| Events in quadrant B | 6,523,618 | 486,589 |
| Events in quadrant C | 6,890,309 | 445,602 |
| Events in quadrant D | 7,023,036 | 451,196 |
| Mode M0 | |||
|---|---|---|---|
| Quadrant | BADHDUFLAG | Total packets | Discarded packets |
| A | 0 | 14065 | 3 |
| B | 0 | 24271 | 2 |
| C | 0 | 24885 | 2 |
| D | 0 | 25499 | 2 |
| Mode M9 | |||
|---|---|---|---|
| Quadrant | BADHDUFLAG | Total packets | Discarded packets |
| A | 0 | 15 | 0 |
| B | 0 | 15 | 0 |
| C | 0 | 15 | 0 |
| D | 0 | 16 | 0 |
| Mode SS | |||
|---|---|---|---|
| Quadrant | BADHDUFLAG | Total packets | Discarded packets |
| A | 0 | 136 | 0 |
| B | 0 | 136 | 0 |
| C | 0 | 136 | 0 |
| D | 0 | 136 | 0 |
| Quadrant | Total seconds | Saturated seconds | Saturation percentage |
|---|---|---|---|
| A | 6790 | 31 | 0.456554% |
| B | 6790 | 602 | 8.865979% |
| C | 6790 | 1436 | 21.148748% |
| D | 6790 | 781 | 11.502209% |
Noise dominated data is calculated using 1-second bins in cleaned event files. If a bin has >2000 counts, and if more than 50% of those come from <1% of pixels, then it is considered to be noise-dominated and hence unusable.
| Quadrant | # 1 sec bins | Bins with >0 counts | Bins with >2000 counts | High rate bins dominated by noise | Noise dominated (total time) | Noise dominated (detector-on time) | Marked lightcurve |
|---|---|---|---|---|---|---|---|
| A | 7840 | 6791 | 0 | 0 | 0.00% | 0.00% | 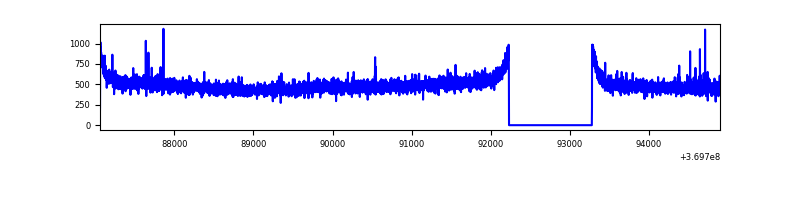 |
| B | 7840 | 6791 | 252 | 252 | 3.21% | 3.71% | 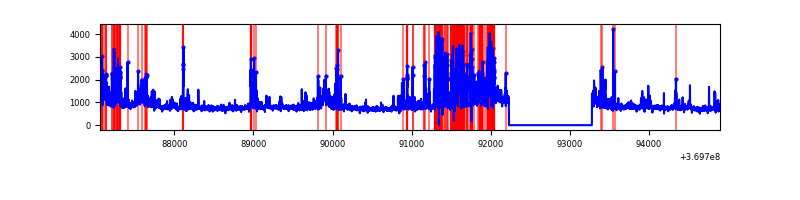 |
| C | 7840 | 6791 | 932 | 932 | 11.89% | 13.72% | 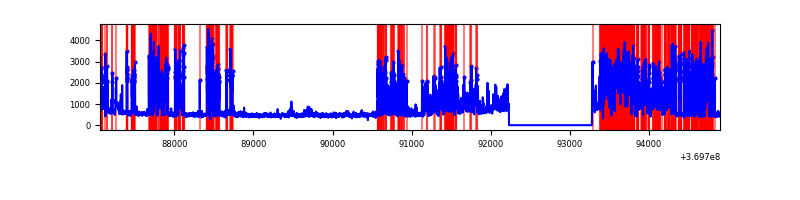 |
| D | 7840 | 6791 | 683 | 683 | 8.71% | 10.06% | 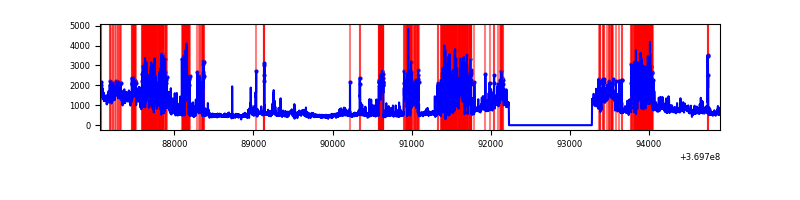 |
Top three noisy pixels from each quadrant. If the there are fewer than three noisy pixels in the level2.evt file, extra rows are filled as -1
| Pixel properties | Quadrant properties | ||||||
|---|---|---|---|---|---|---|---|
| Quadrant | DetID | PixID | Counts | Sigma | Mean | Median | Sigma |
| A | 13 | 6 | 22904 | 130.39 | 847 | 831 | 169.3 |
| A | 13 | 254 | 12865 | 71.09 | 847 | 831 | 169.3 |
| A | 12 | 96 | 10284 | 55.84 | 847 | 831 | 169.3 |
| B | 6 | 159 | 1909972 | 12314.92 | 821 | 801 | 155.0 |
| B | 5 | 172 | 637165 | 4104.8 | 821 | 801 | 155.0 |
| B | 10 | 245 | 525005 | 3381.33 | 821 | 801 | 155.0 |
| C | 0 | 10 | 3307529 | 18840.97 | 752 | 756 | 175.5 |
| C | 3 | 233 | 411654 | 2341.17 | 752 | 756 | 175.5 |
| C | 14 | 238 | 123432 | 698.97 | 752 | 756 | 175.5 |
| D | 13 | 174 | 1859000 | 9762.47 | 790 | 770 | 190.3 |
| D | 8 | 195 | 1286344 | 6753.94 | 790 | 770 | 190.3 |
| D | 11 | 176 | 394408 | 2068.03 | 790 | 770 | 190.3 |
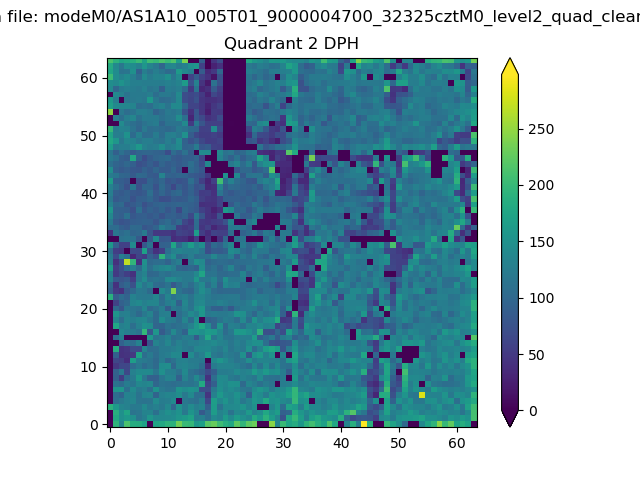
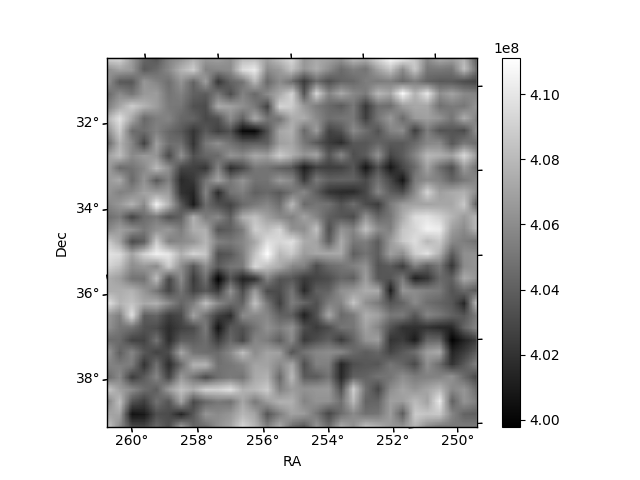
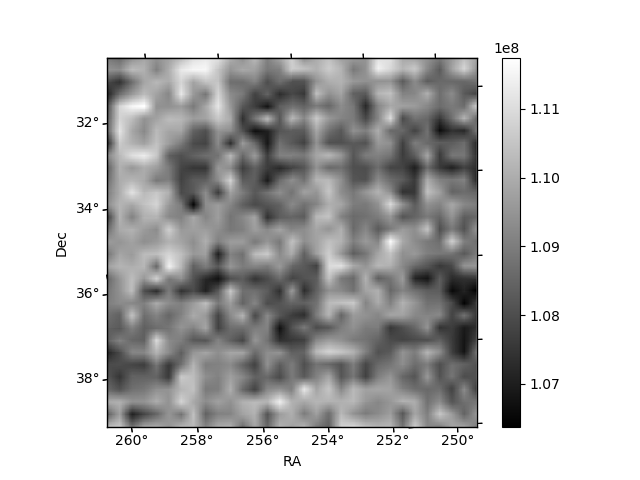
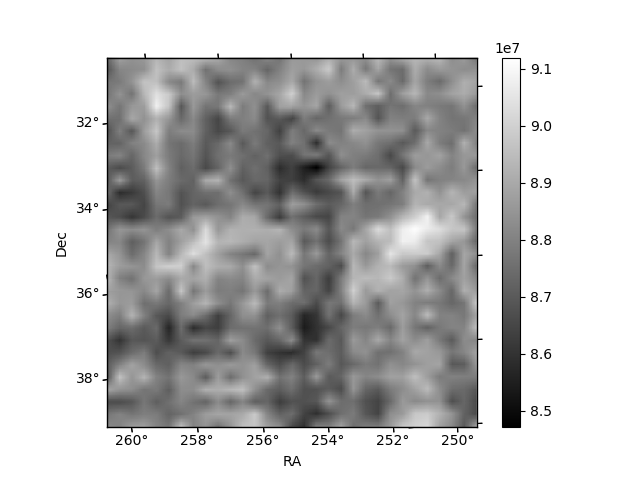
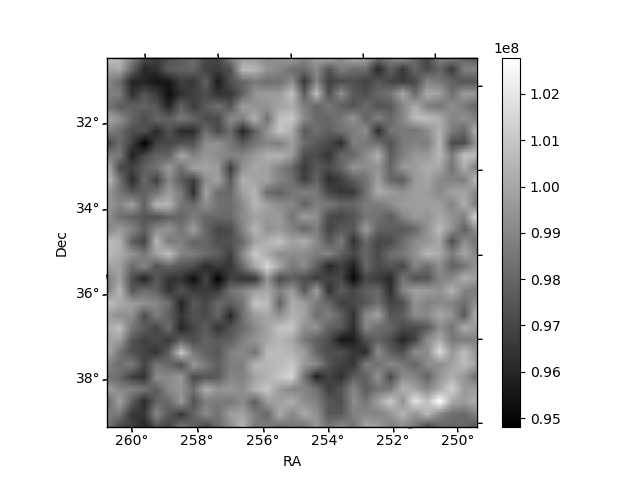
Histogram calculated using DETX and DETY for each event in the final _common_clean file
| Quadrant A | 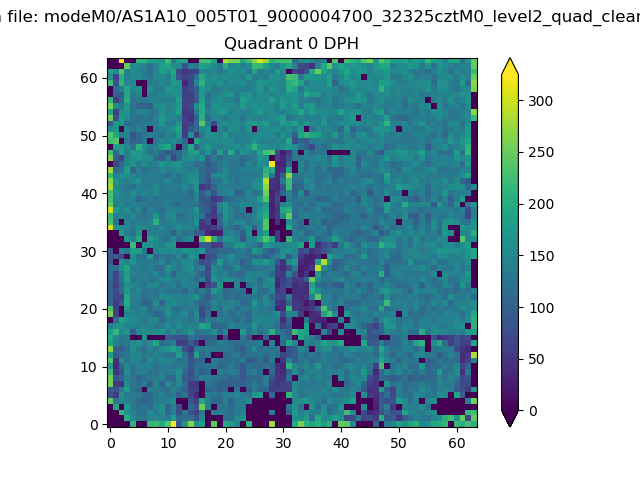 |
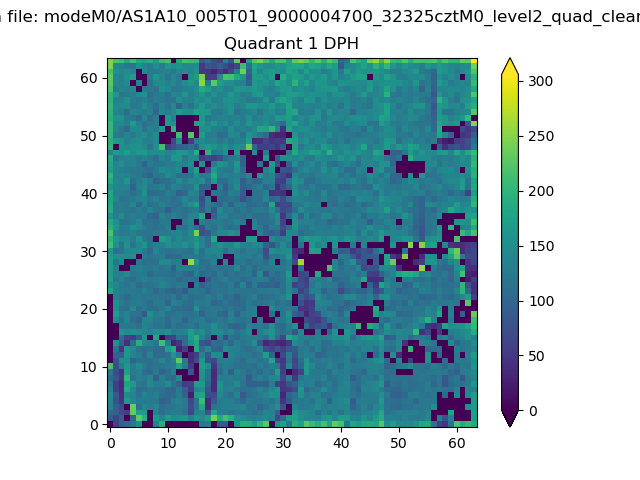 |
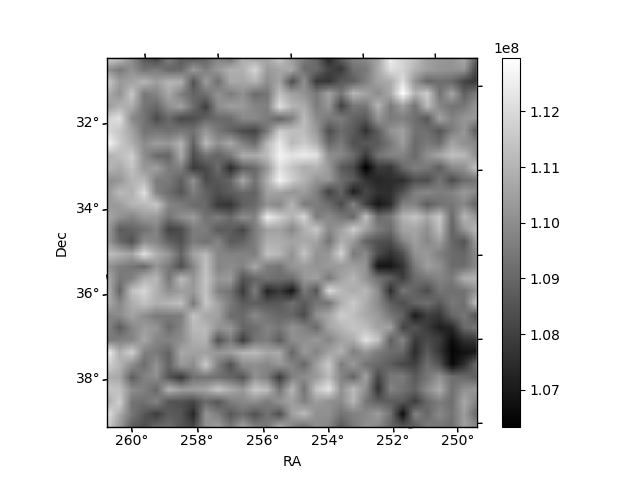
Quadrant B |
|---|---|---|---|
| Quadrant D | 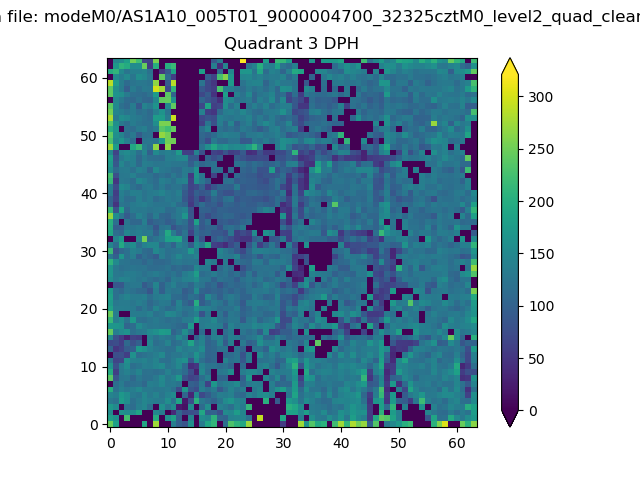 |
 |
Quadrant C |
| Plot type | Count rate plots | Images |
|---|---|---|
| Comparison with Poisson distribution Blue bars denote a histogram of data divided into 1 sec bins. Red curve is a Poisson curve with rate = median count rate of data. |
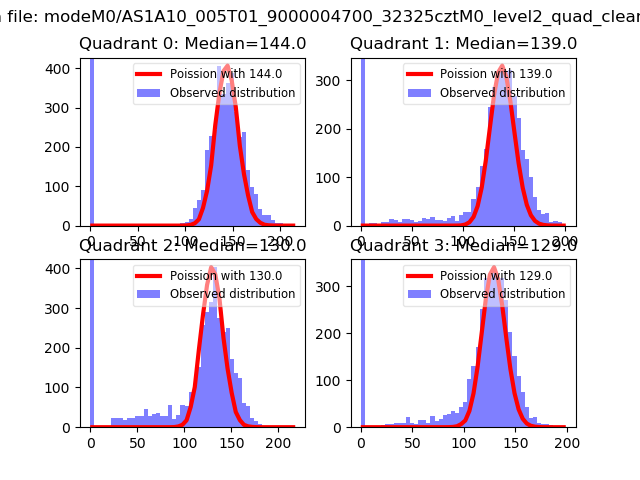 |
 |
| Quadrant-wise count rates Data is divided into 100 sec bins |
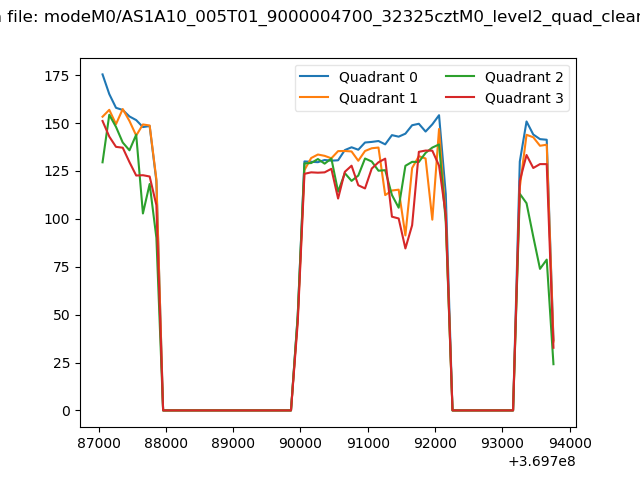 |
|
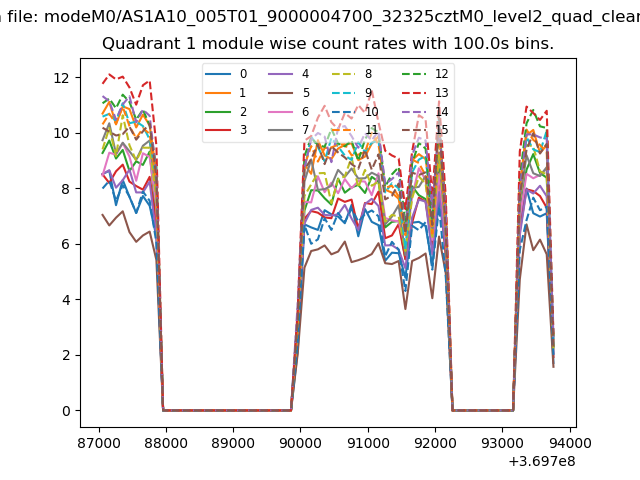
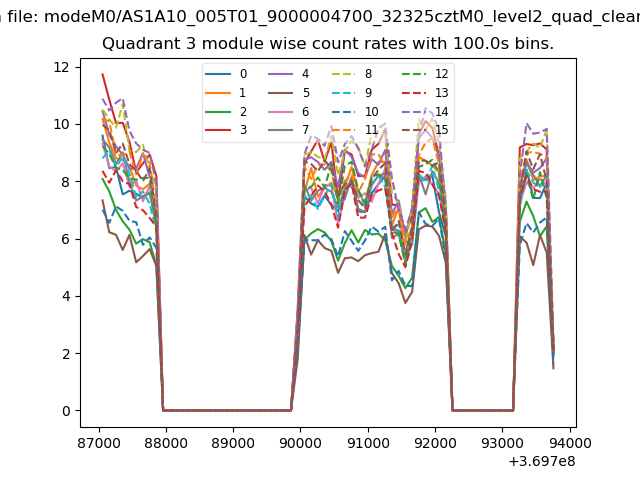
| Module-wise count rates for Quadrant A Data is divided into 100 sec bins |
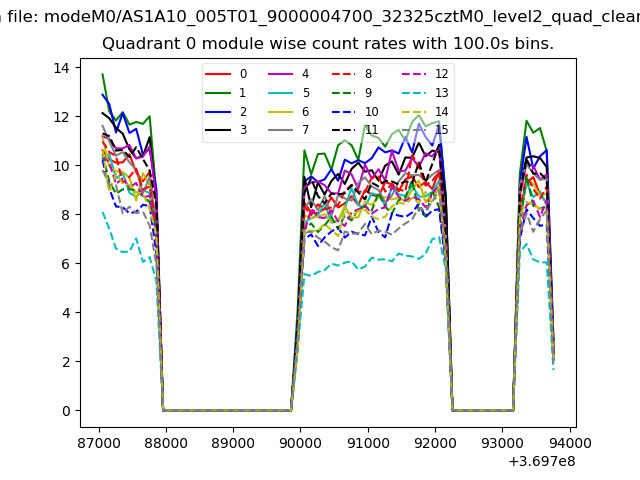 |
 |
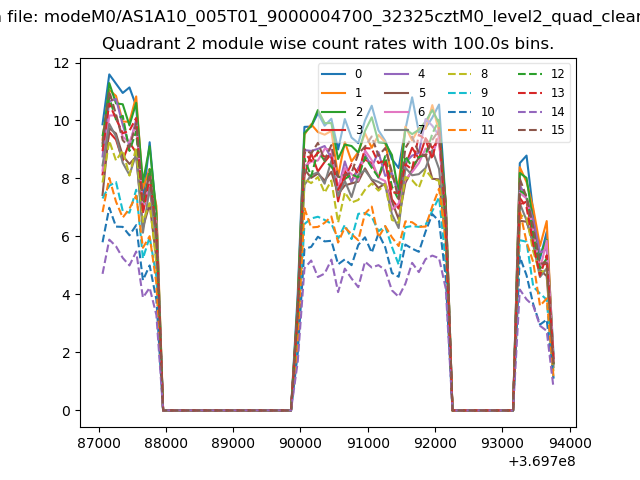
| Module-wise count rates for Quadrant B Data is divided into 100 sec bins |
 |
 |
| Module-wise count rates for Quadrant C Data is divided into 100 sec bins |
 |
 |
| Module-wise count rates for Quadrant D Data is divided into 100 sec bins |
 |
 |
| Parameter | Plot |
|---|---|
| CZT HV Monitor | 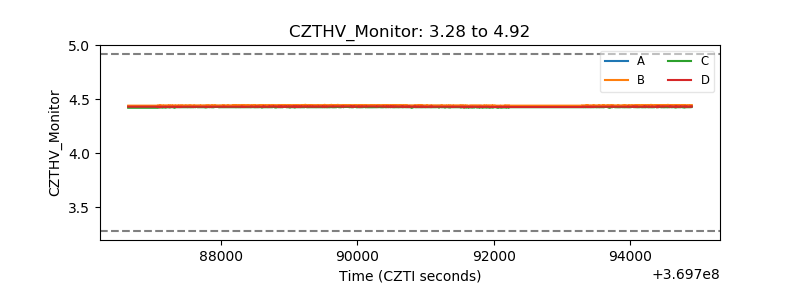 |
| D_VDD | 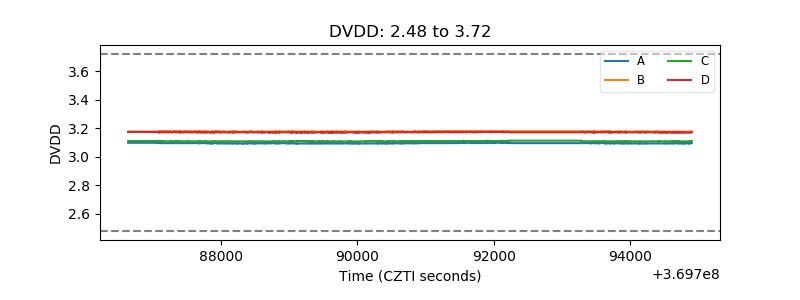 |
| Temperature 1 |  |
| Veto HV Monitor | 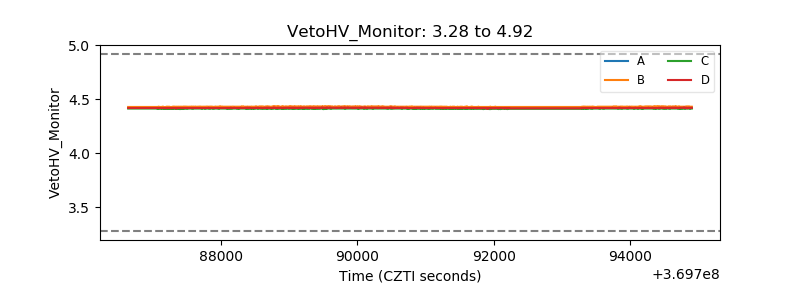 |
| Veto LLD | 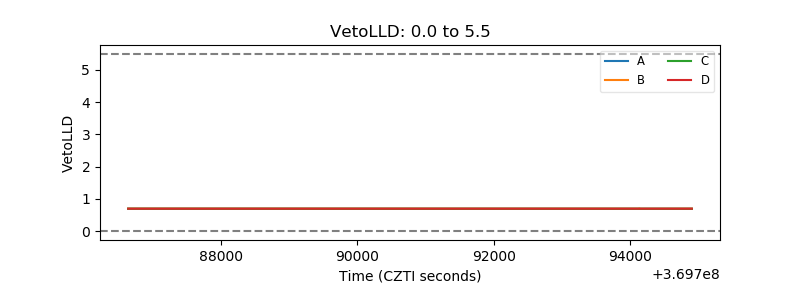 |
| Alpha Counter | 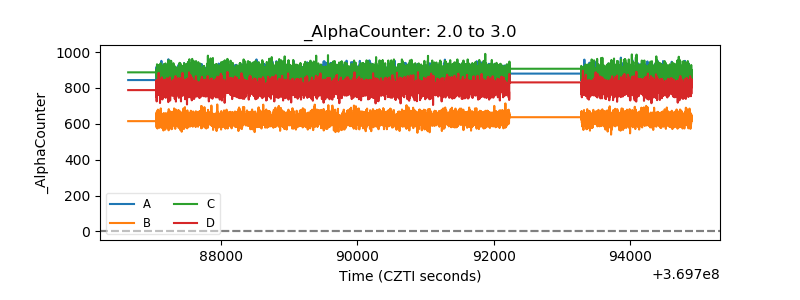 |
| _CPM_Rate | 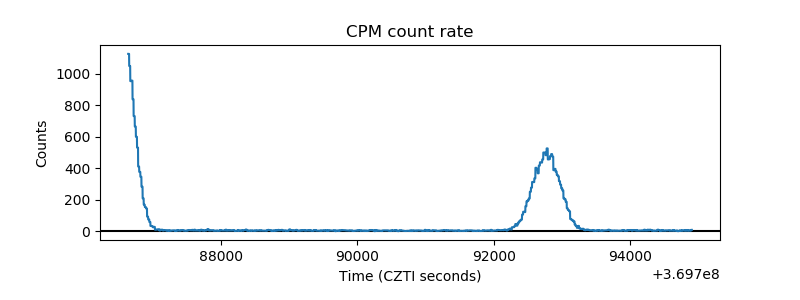 |
| CZT Counter | 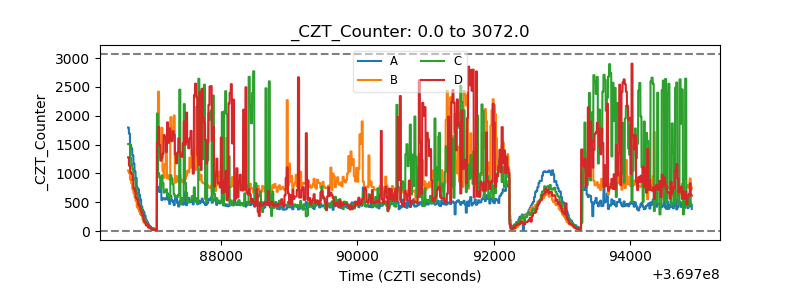 |
| +2.5 Volts monitor |  |
| +5 Volts monitor |  |
| _ROLL_ROT | 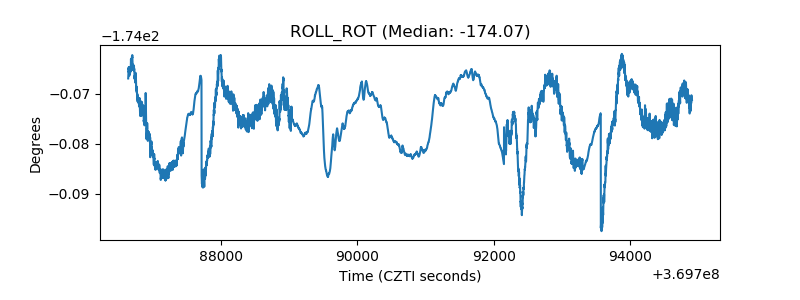 |
| _Roll_DEC | 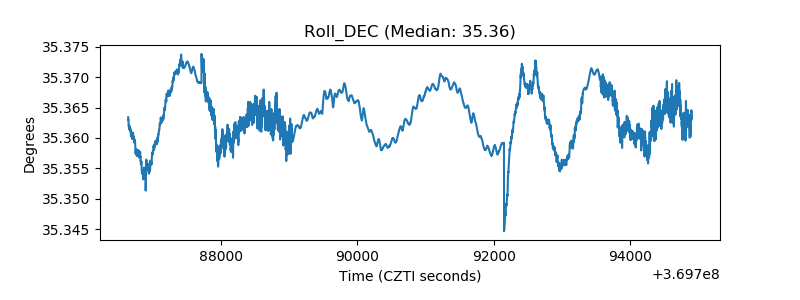 |
| _Roll_RA | 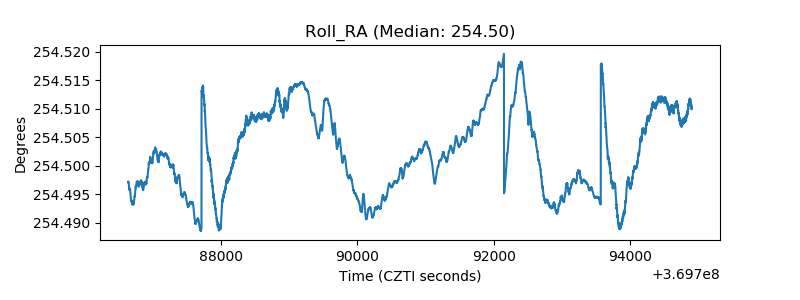 |
| Veto Counter | 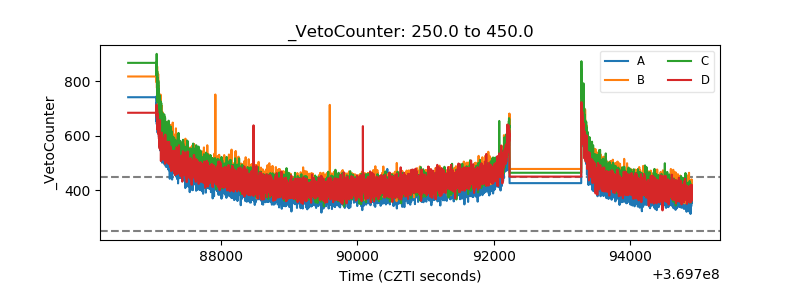 |