| Param | Original file | Final file |
|---|---|---|
| Filename | modeM0/AS1A10_005T01_9000004700_32327cztM0_level2.evt | modeM0/AS1A10_005T01_9000004700_32327cztM0_level2_quad_clean.evt |
| Size (bytes) | 773,138,880 | 75,939,840 |
| Size | 737.3 MB | 72.4 MB |
| Events in quadrant A | 3,366,013 | 486,910 |
| Events in quadrant B | 6,426,037 | 449,942 |
| Events in quadrant C | 7,535,381 | 425,603 |
| Events in quadrant D | 5,616,660 | 450,562 |
| Mode M0 | |||
|---|---|---|---|
| Quadrant | BADHDUFLAG | Total packets | Discarded packets |
| A | 0 | 14480 | 2 |
| B | 0 | 24194 | 1 |
| C | 0 | 27086 | 1 |
| D | 0 | 21798 | 1 |
| Mode M9 | |||
|---|---|---|---|
| Quadrant | BADHDUFLAG | Total packets | Discarded packets |
| A | 0 | 3 | 0 |
| B | 0 | 3 | 0 |
| C | 0 | 3 | 0 |
| D | 0 | 3 | 0 |
| Mode SS | |||
|---|---|---|---|
| Quadrant | BADHDUFLAG | Total packets | Discarded packets |
| A | 0 | 142 | 0 |
| B | 0 | 142 | 0 |
| C | 0 | 142 | 0 |
| D | 0 | 142 | 0 |
| Quadrant | Total seconds | Saturated seconds | Saturation percentage |
|---|---|---|---|
| A | 6974 | 104 | 1.491253% |
| B | 6974 | 611 | 8.761113% |
| C | 6974 | 1678 | 24.060797% |
| D | 6974 | 196 | 2.810439% |
Noise dominated data is calculated using 1-second bins in cleaned event files. If a bin has >2000 counts, and if more than 50% of those come from <1% of pixels, then it is considered to be noise-dominated and hence unusable.
| Quadrant | # 1 sec bins | Bins with >0 counts | Bins with >2000 counts | High rate bins dominated by noise | Noise dominated (total time) | Noise dominated (detector-on time) | Marked lightcurve |
|---|---|---|---|---|---|---|---|
| A | 7264 | 6976 | 2 | 2 | 0.03% | 0.03% | 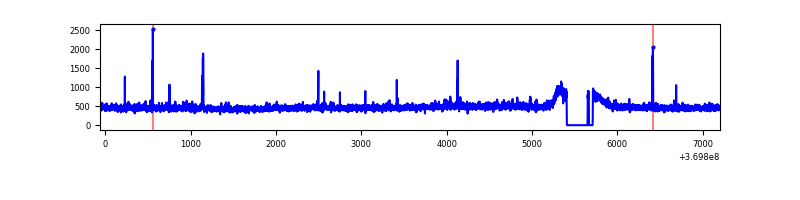 |
| B | 7264 | 6976 | 272 | 272 | 3.74% | 3.90% | 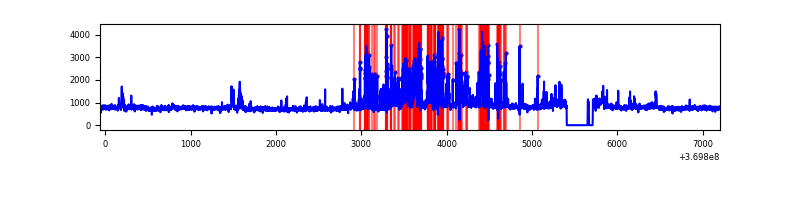 |
| C | 7264 | 6976 | 931 | 931 | 12.82% | 13.35% | 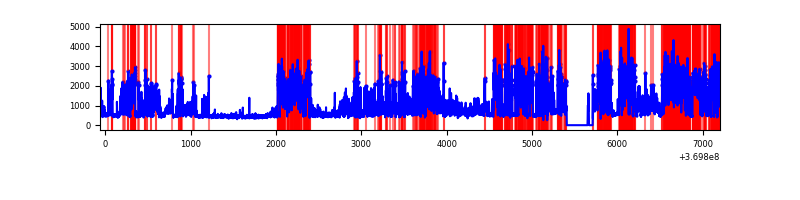 |
| D | 7264 | 6976 | 84 | 84 | 1.16% | 1.20% | 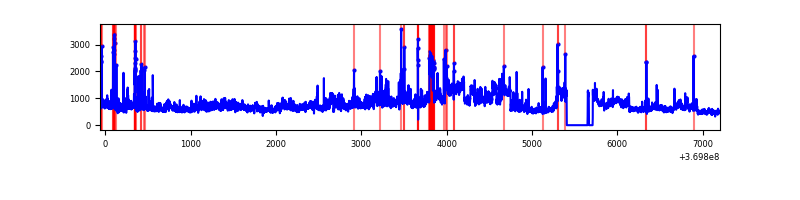 |
Top three noisy pixels from each quadrant. If the there are fewer than three noisy pixels in the level2.evt file, extra rows are filled as -1
| Pixel properties | Quadrant properties | ||||||
|---|---|---|---|---|---|---|---|
| Quadrant | DetID | PixID | Counts | Sigma | Mean | Median | Sigma |
| A | 12 | 96 | 47361 | 273.67 | 844 | 826 | 170.0 |
| A | 12 | 189 | 25322 | 144.06 | 844 | 826 | 170.0 |
| A | 15 | 174 | 21021 | 118.77 | 844 | 826 | 170.0 |
| B | 6 | 159 | 1966580 | 12537.05 | 814 | 794 | 156.8 |
| B | 5 | 172 | 981241 | 6252.92 | 814 | 794 | 156.8 |
| B | 10 | 245 | 95443 | 603.64 | 814 | 794 | 156.8 |
| C | 0 | 10 | 4323035 | 24552.28 | 745 | 751 | 176.0 |
| C | 14 | 238 | 120083 | 677.85 | 745 | 751 | 176.0 |
| C | 15 | 208 | 79339 | 446.41 | 745 | 751 | 176.0 |
| D | 8 | 195 | 2232369 | 11423.29 | 813 | 789 | 195.4 |
| D | 14 | 52 | 71540 | 362.17 | 813 | 789 | 195.4 |
| D | 13 | 249 | 64495 | 326.11 | 813 | 789 | 195.4 |
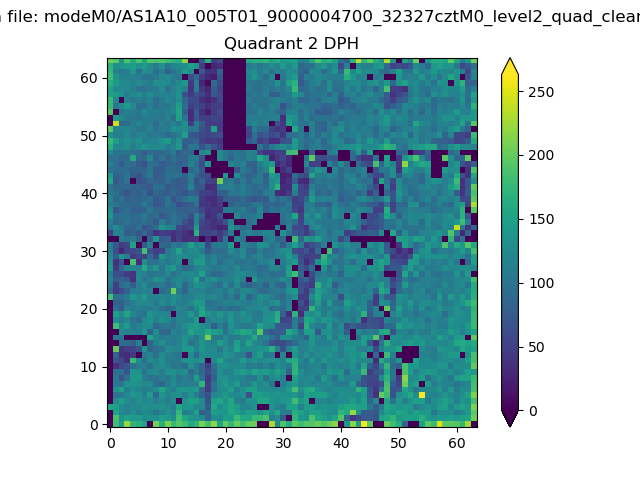
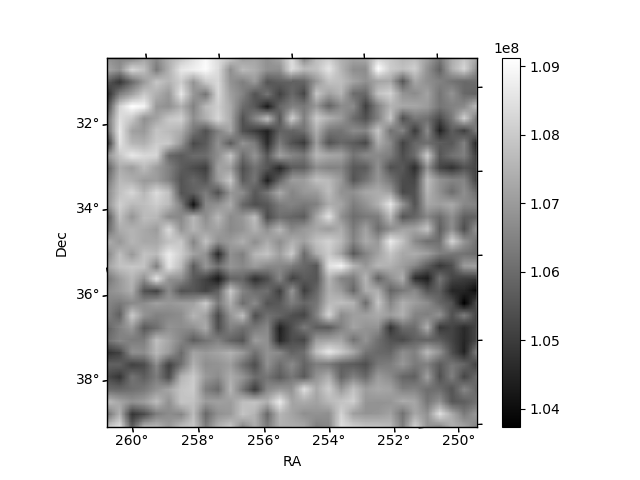
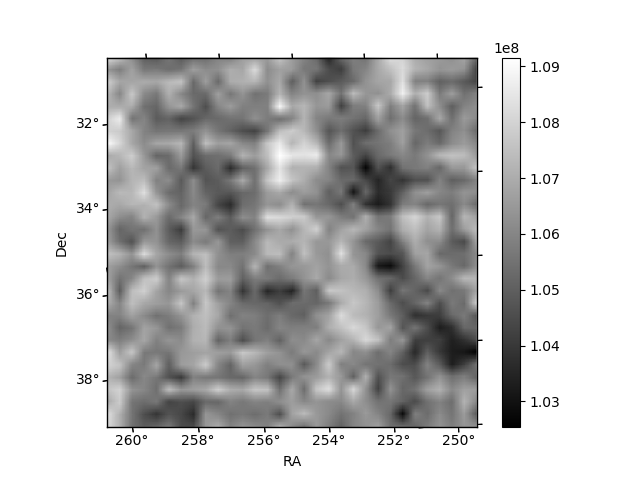
Histogram calculated using DETX and DETY for each event in the final _common_clean file
| Quadrant A | 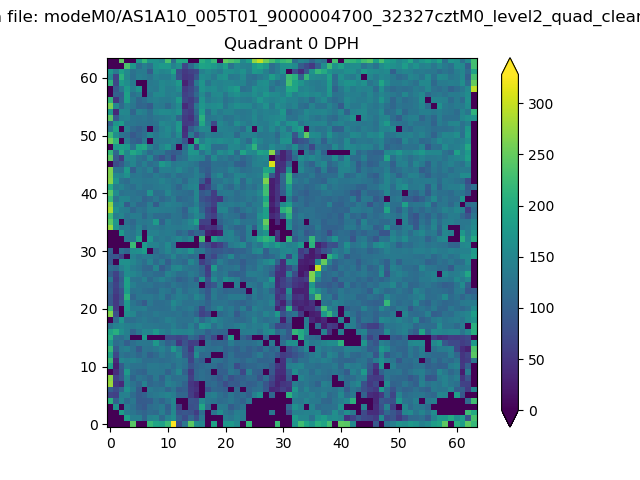 |
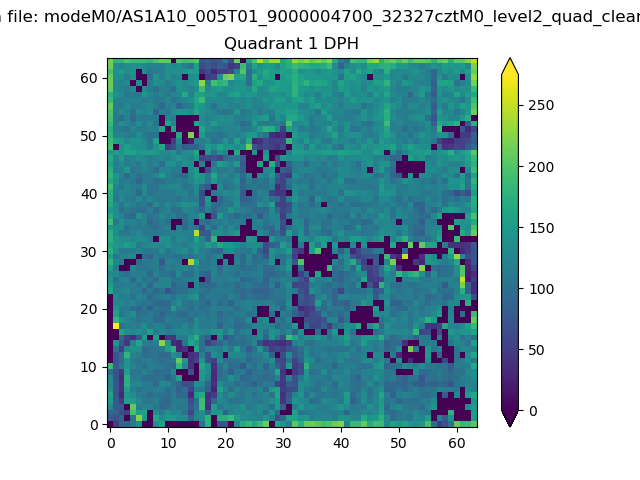 |
Quadrant B |
|---|---|---|---|
| Quadrant D | 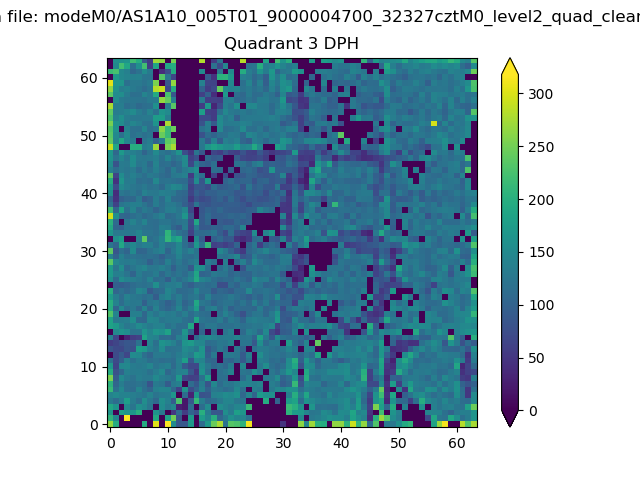 |
 |
Quadrant C |
| Plot type | Count rate plots | Images |
|---|---|---|
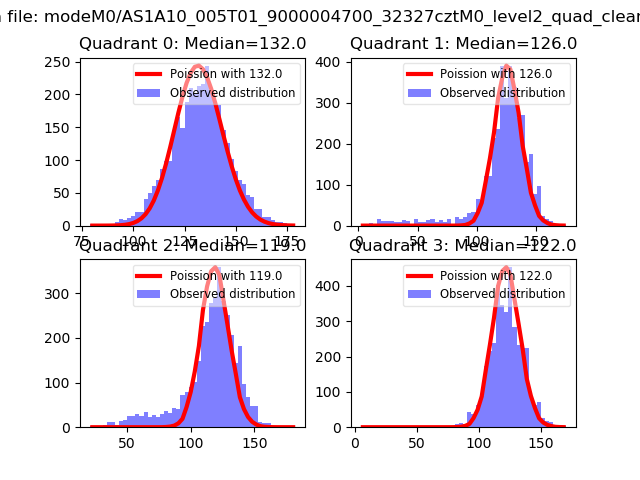
| Comparison with Poisson distribution Blue bars denote a histogram of data divided into 1 sec bins. Red curve is a Poisson curve with rate = median count rate of data. |
 |
 |
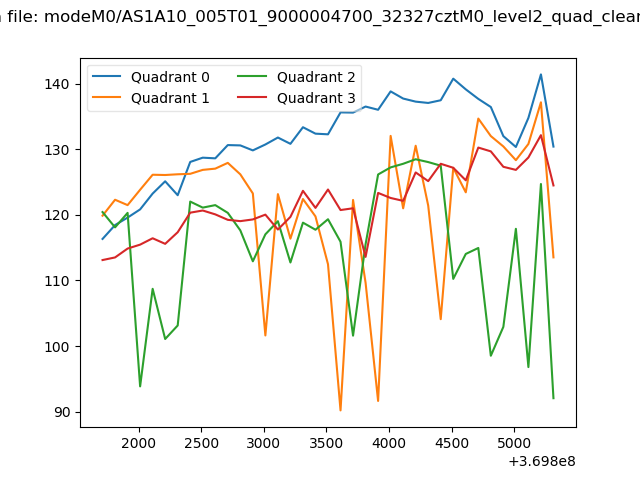
| Quadrant-wise count rates Data is divided into 100 sec bins |
 |
|
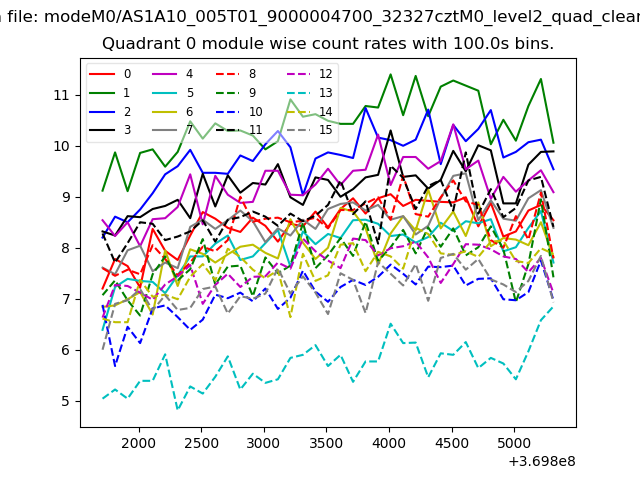
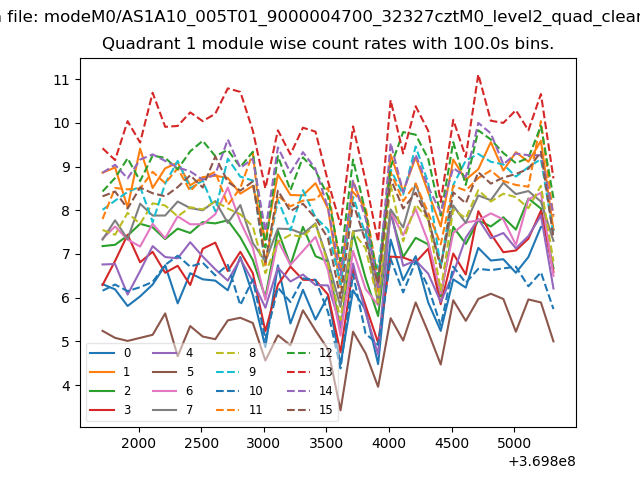
| Module-wise count rates for Quadrant A Data is divided into 100 sec bins |
 |
 |
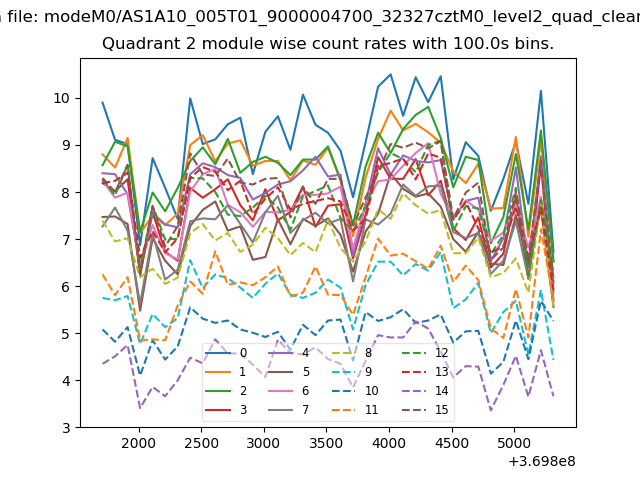
| Module-wise count rates for Quadrant B Data is divided into 100 sec bins |
 |
 |
| Module-wise count rates for Quadrant C Data is divided into 100 sec bins |
 |
 |
| Module-wise count rates for Quadrant D Data is divided into 100 sec bins |
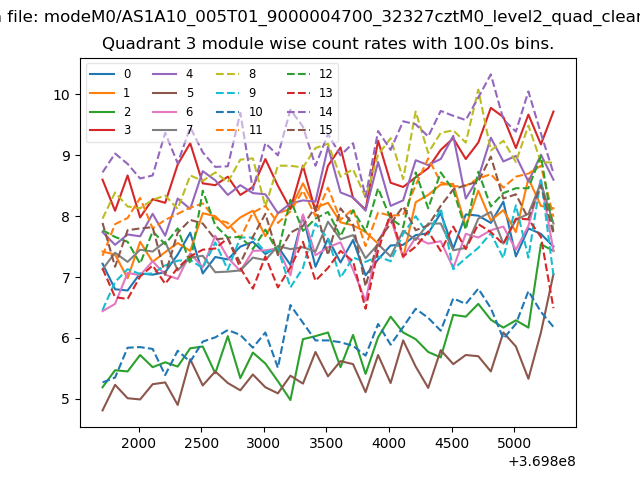 |
 |
| Parameter | Plot |
|---|---|
| CZT HV Monitor | 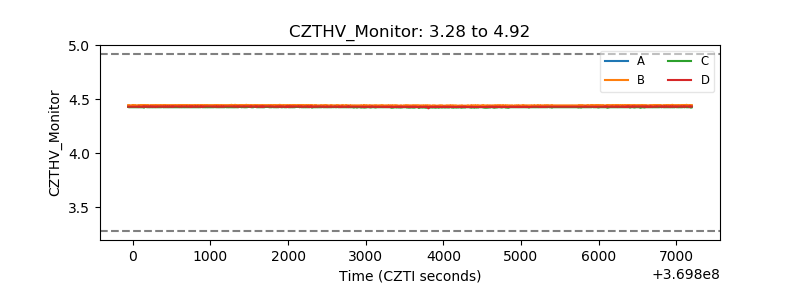 |
| D_VDD | 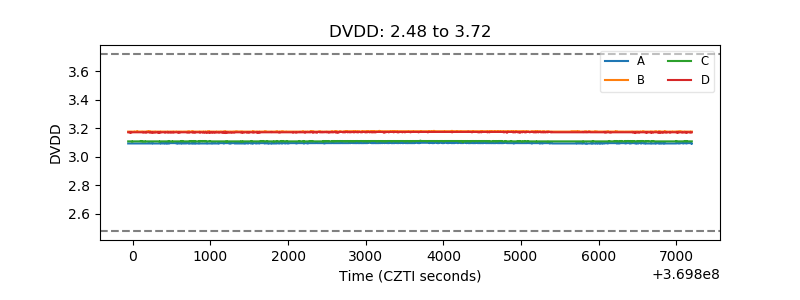 |
| Temperature 1 | 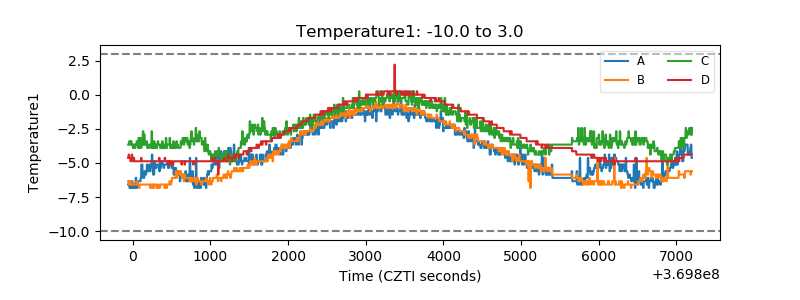 |
| Veto HV Monitor | 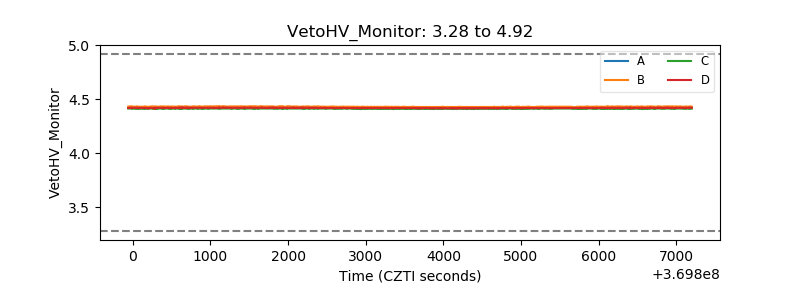 |
| Veto LLD | 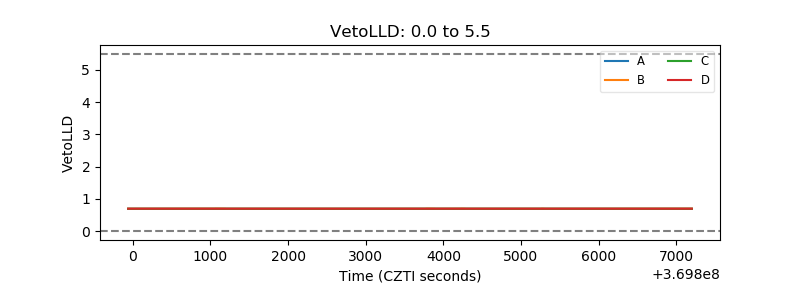 |
| Alpha Counter | 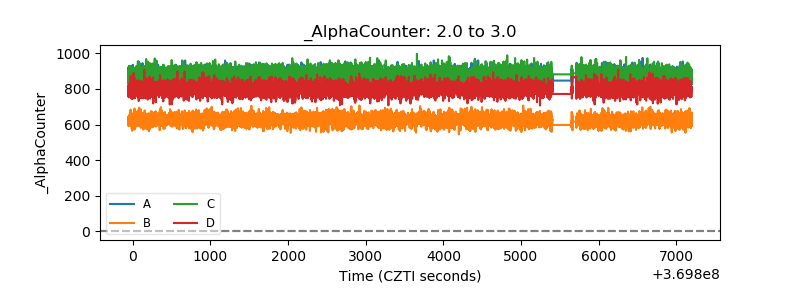 |
| _CPM_Rate | 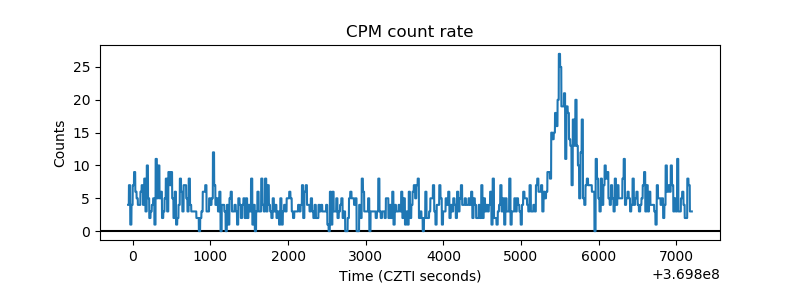 |
| CZT Counter | 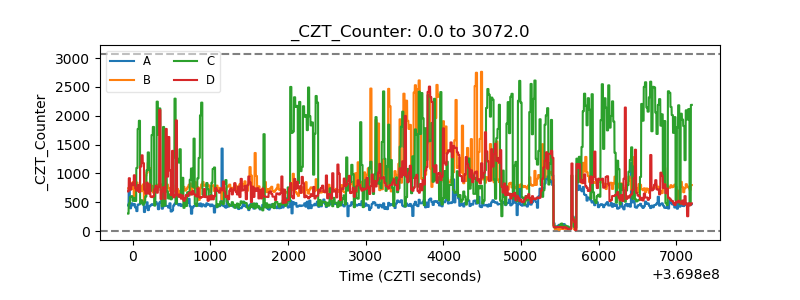 |
| +2.5 Volts monitor |  |
| +5 Volts monitor |  |
| _ROLL_ROT | 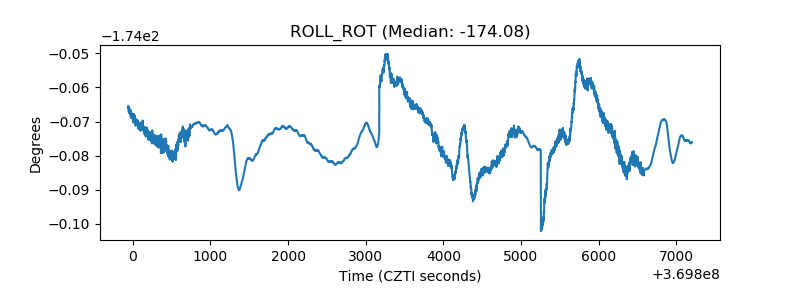 |
| _Roll_DEC | 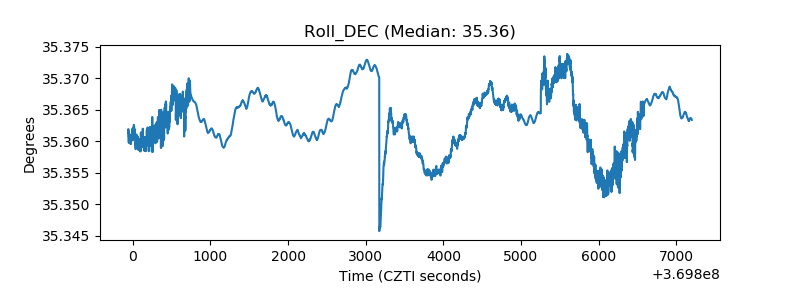 |
| _Roll_RA | 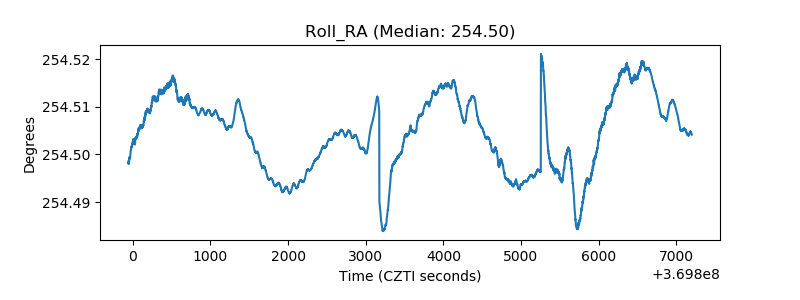 |
| Veto Counter | 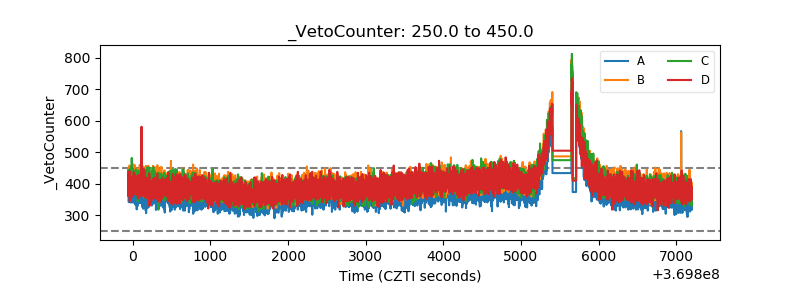 |