| Param | Original file | Final file |
|---|---|---|
| Filename | modeM0/AS1A10_005T01_9000004700_32328cztM0_level2.evt | modeM0/AS1A10_005T01_9000004700_32328cztM0_level2_quad_clean.evt |
| Size (bytes) | 830,050,560 | 79,174,080 |
| Size | 791.6 MB | 75.5 MB |
| Events in quadrant A | 3,657,168 | 511,378 |
| Events in quadrant B | 7,533,877 | 447,186 |
| Events in quadrant C | 8,340,236 | 456,146 |
| Events in quadrant D | 5,115,980 | 475,421 |
| Mode M0 | |||
|---|---|---|---|
| Quadrant | BADHDUFLAG | Total packets | Discarded packets |
| A | 0 | 15502 | 2 |
| B | 0 | 27674 | 1 |
| C | 0 | 29611 | 1 |
| D | 0 | 20138 | 1 |
| Mode M9 | |||
|---|---|---|---|
| Quadrant | BADHDUFLAG | Total packets | Discarded packets |
| A | 0 | 2 | 0 |
| B | 0 | 2 | 0 |
| C | 0 | 2 | 0 |
| D | 0 | 2 | 0 |
| Mode SS | |||
|---|---|---|---|
| Quadrant | BADHDUFLAG | Total packets | Discarded packets |
| A | 0 | 148 | 0 |
| B | 0 | 148 | 0 |
| C | 0 | 148 | 0 |
| D | 0 | 148 | 0 |
| Quadrant | Total seconds | Saturated seconds | Saturation percentage |
|---|---|---|---|
| A | 7271 | 135 | 1.856691% |
| B | 7271 | 1089 | 14.977307% |
| C | 7271 | 1867 | 25.677348% |
| D | 7271 | 284 | 3.905928% |
Noise dominated data is calculated using 1-second bins in cleaned event files. If a bin has >2000 counts, and if more than 50% of those come from <1% of pixels, then it is considered to be noise-dominated and hence unusable.
| Quadrant | # 1 sec bins | Bins with >0 counts | Bins with >2000 counts | High rate bins dominated by noise | Noise dominated (total time) | Noise dominated (detector-on time) | Marked lightcurve |
|---|---|---|---|---|---|---|---|
| A | 7511 | 7272 | 14 | 14 | 0.19% | 0.19% | 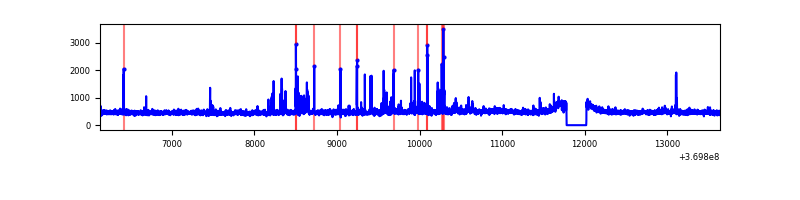 |
| B | 7511 | 7272 | 639 | 639 | 8.51% | 8.79% | 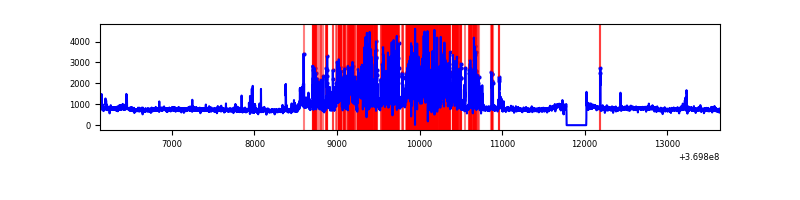 |
| C | 7511 | 7272 | 998 | 998 | 13.29% | 13.72% | 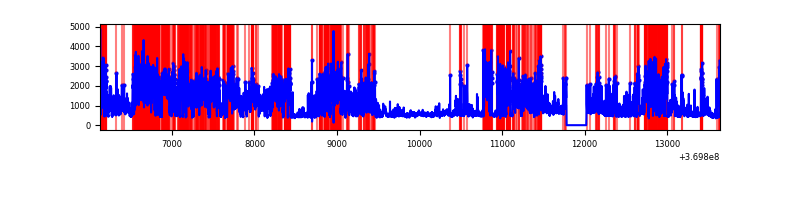 |
| D | 7511 | 7272 | 182 | 182 | 2.42% | 2.50% | 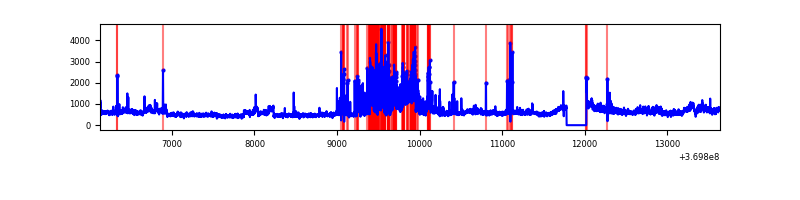 |
Top three noisy pixels from each quadrant. If the there are fewer than three noisy pixels in the level2.evt file, extra rows are filled as -1
| Pixel properties | Quadrant properties | ||||||
|---|---|---|---|---|---|---|---|
| Quadrant | DetID | PixID | Counts | Sigma | Mean | Median | Sigma |
| A | 12 | 96 | 216332 | 1231.13 | 872 | 851 | 175.0 |
| A | 12 | 189 | 42546 | 238.22 | 872 | 851 | 175.0 |
| A | 13 | 6 | 22240 | 122.2 | 872 | 851 | 175.0 |
| B | 6 | 159 | 1969724 | 12490.71 | 820 | 798 | 157.6 |
| B | 5 | 172 | 1890799 | 11990.02 | 820 | 798 | 157.6 |
| B | 4 | 80 | 194286 | 1227.47 | 820 | 798 | 157.6 |
| C | 0 | 10 | 4659631 | 25367.3 | 776 | 779 | 183.7 |
| C | 15 | 208 | 377051 | 2048.79 | 776 | 779 | 183.7 |
| C | 14 | 238 | 123608 | 668.8 | 776 | 779 | 183.7 |
| D | 8 | 195 | 1003318 | 4944.01 | 842 | 817 | 202.8 |
| D | 12 | 233 | 565976 | 2787.18 | 842 | 817 | 202.8 |
| D | 7 | 38 | 165917 | 814.22 | 842 | 817 | 202.8 |
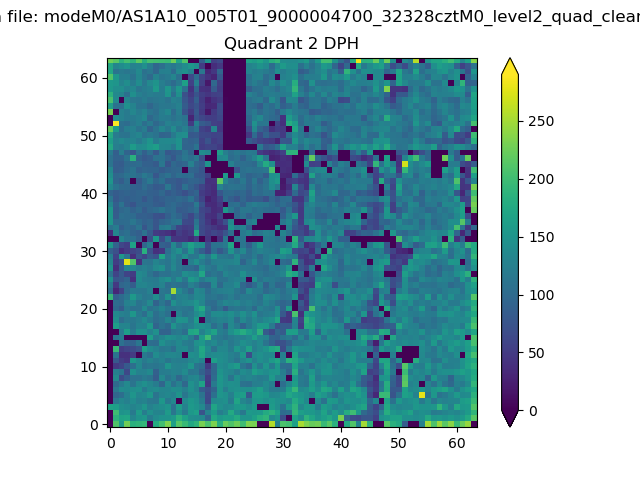
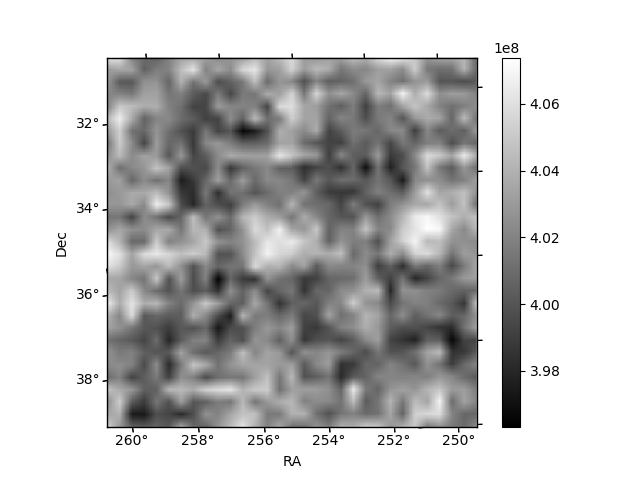
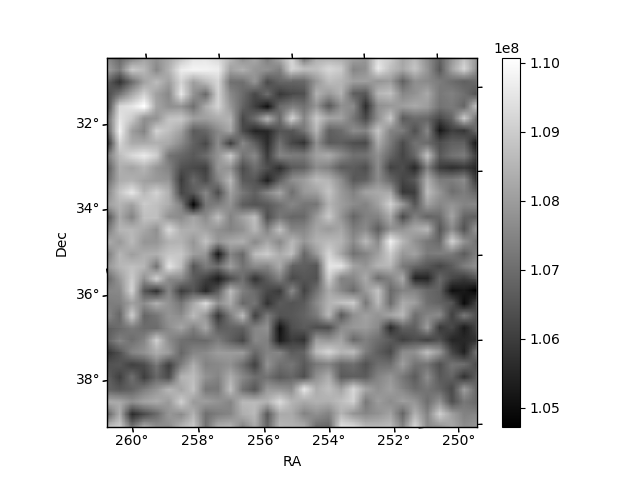
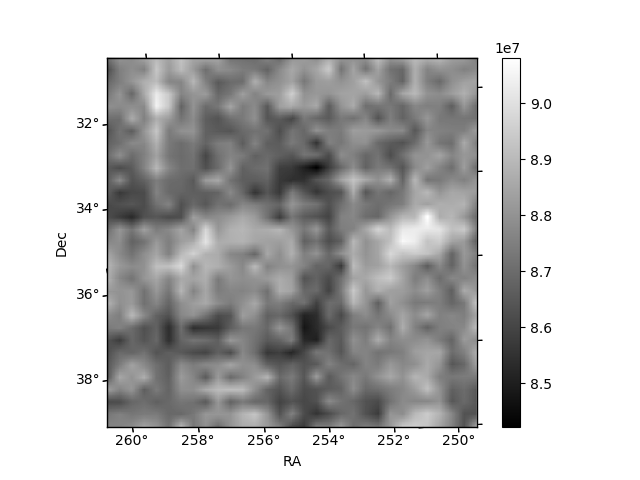
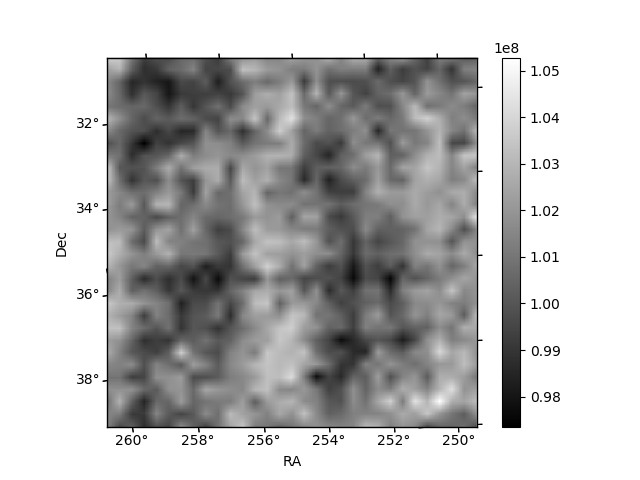
Histogram calculated using DETX and DETY for each event in the final _common_clean file
| Quadrant A | 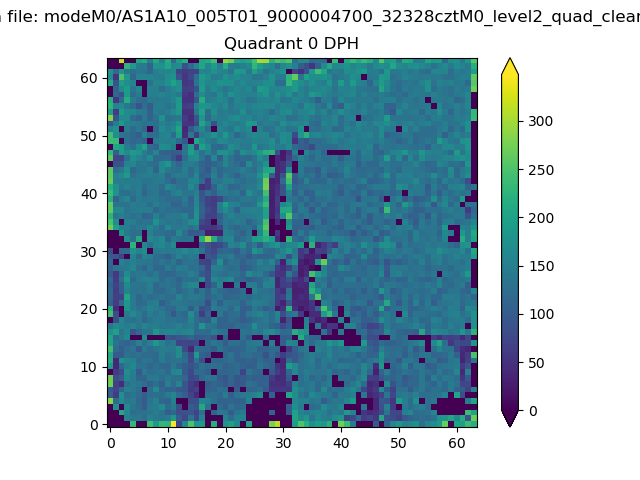 |
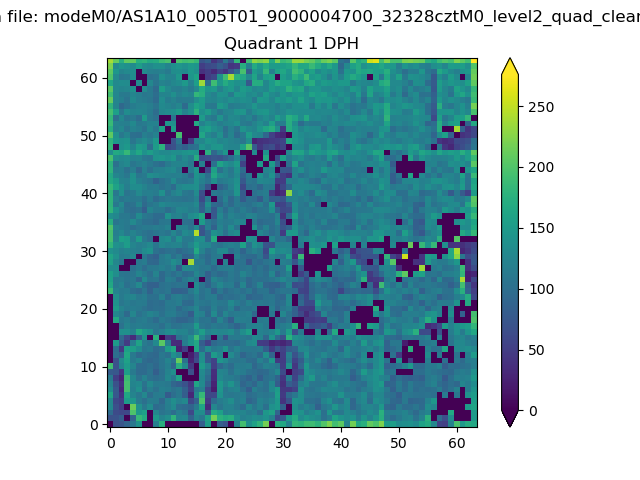 |
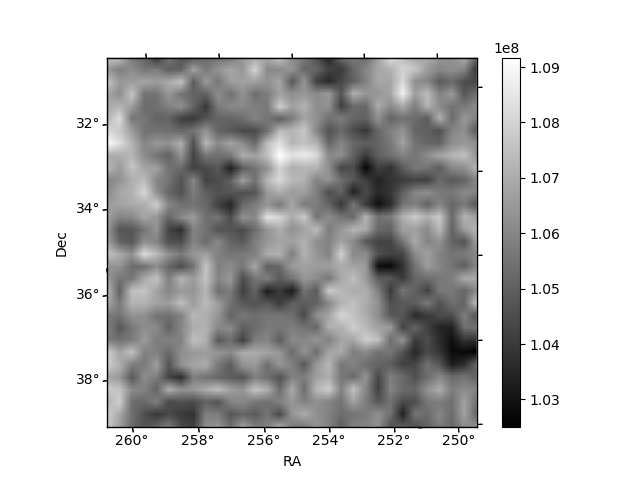
Quadrant B |
|---|---|---|---|
| Quadrant D | 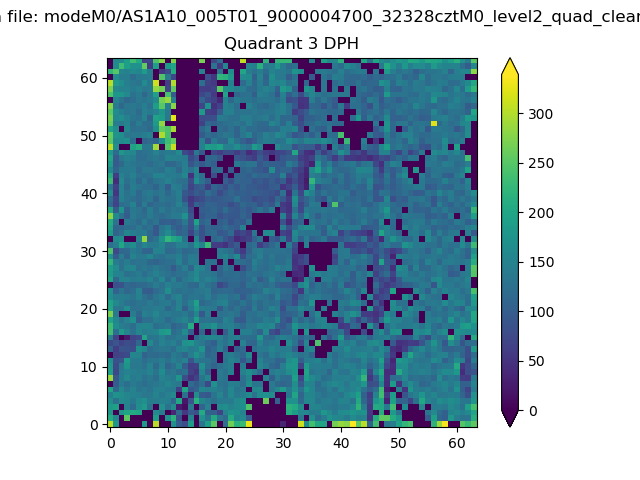 |
 |
Quadrant C |
| Plot type | Count rate plots | Images |
|---|---|---|
| Comparison with Poisson distribution Blue bars denote a histogram of data divided into 1 sec bins. Red curve is a Poisson curve with rate = median count rate of data. |
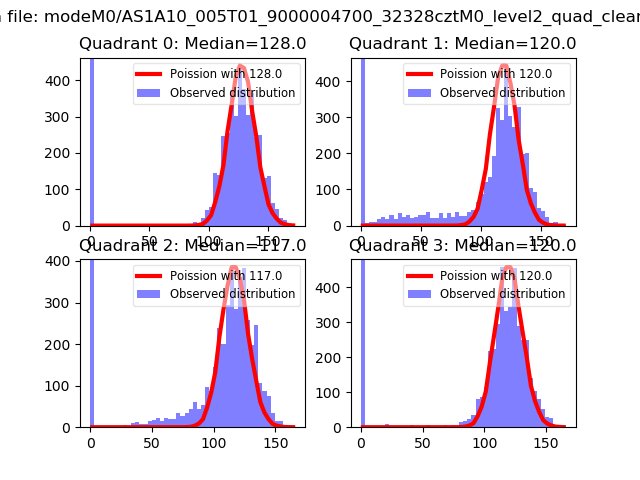 |
 |
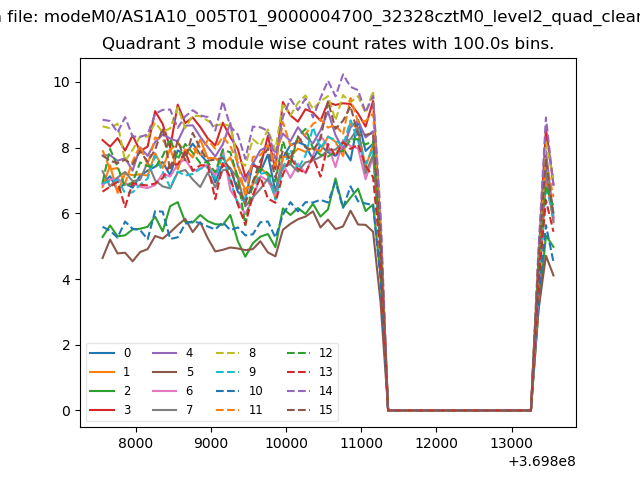
| Quadrant-wise count rates Data is divided into 100 sec bins |
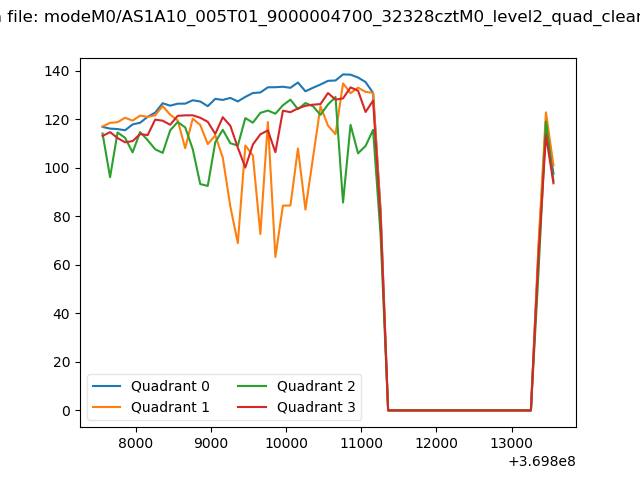 |
|
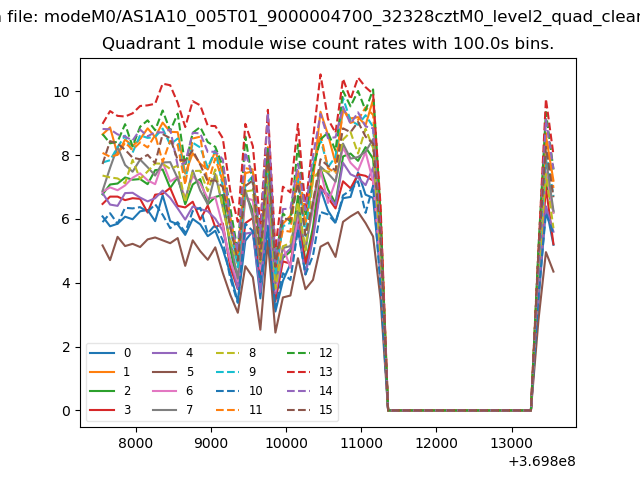
| Module-wise count rates for Quadrant A Data is divided into 100 sec bins |
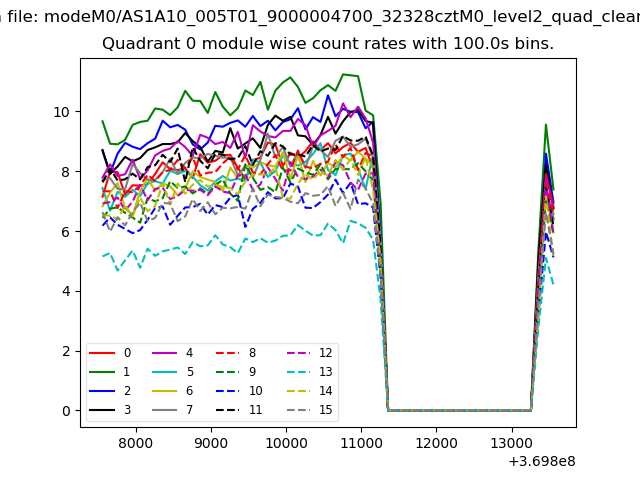 |
 |
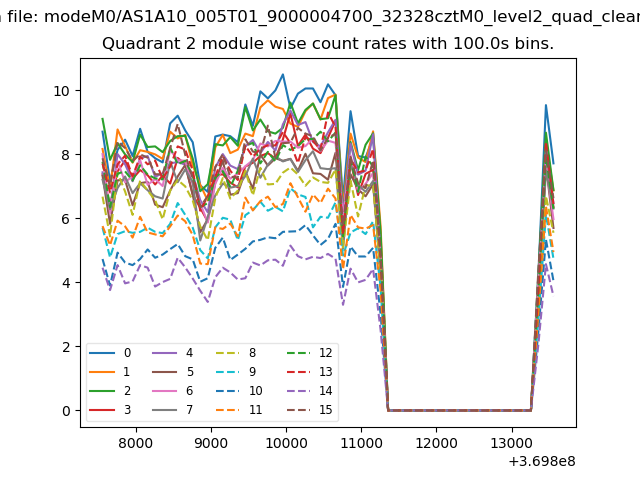
| Module-wise count rates for Quadrant B Data is divided into 100 sec bins |
 |
 |
| Module-wise count rates for Quadrant C Data is divided into 100 sec bins |
 |
 |
| Module-wise count rates for Quadrant D Data is divided into 100 sec bins |
 |
 |
| Parameter | Plot |
|---|---|
| CZT HV Monitor | 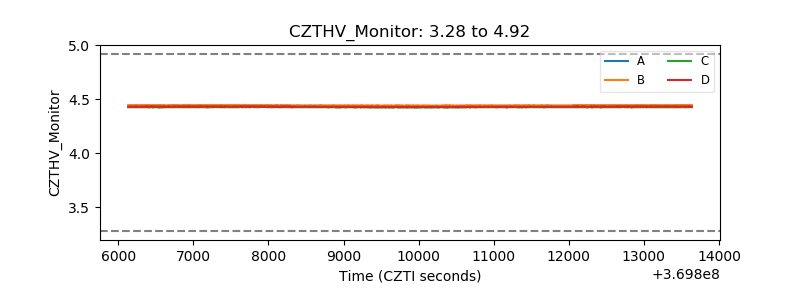 |
| D_VDD | 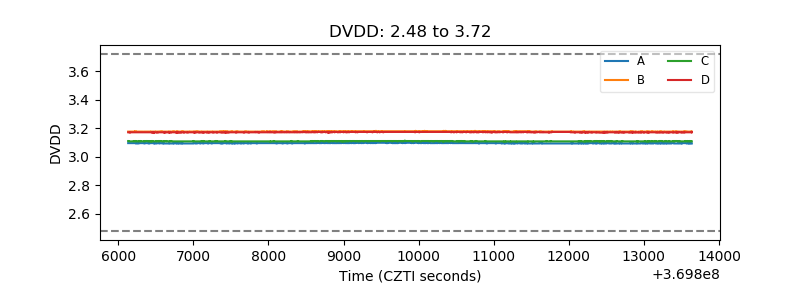 |
| Temperature 1 | 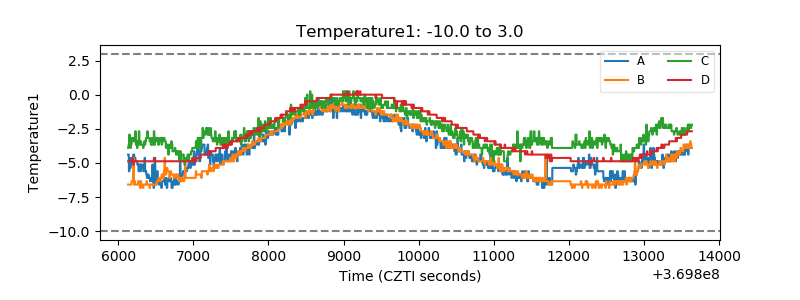 |
| Veto HV Monitor | 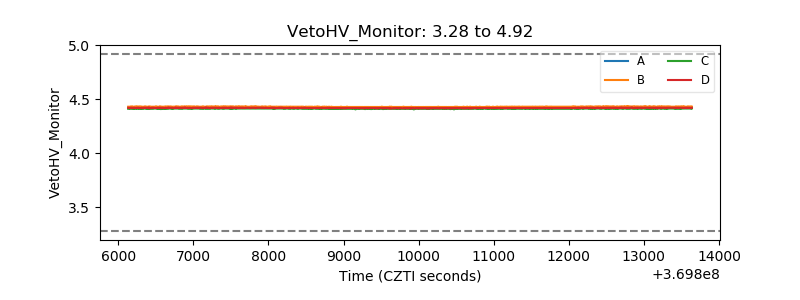 |
| Veto LLD | 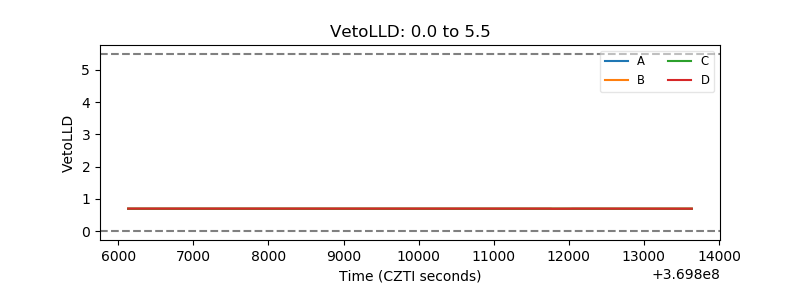 |
| Alpha Counter | 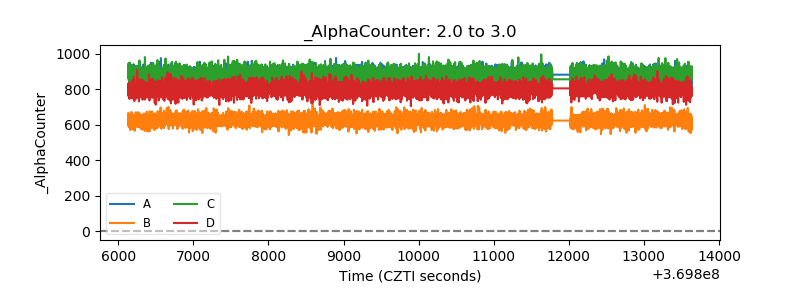 |
| _CPM_Rate | 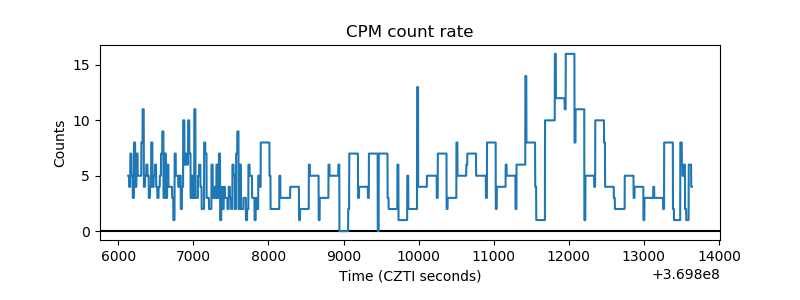 |
| CZT Counter | 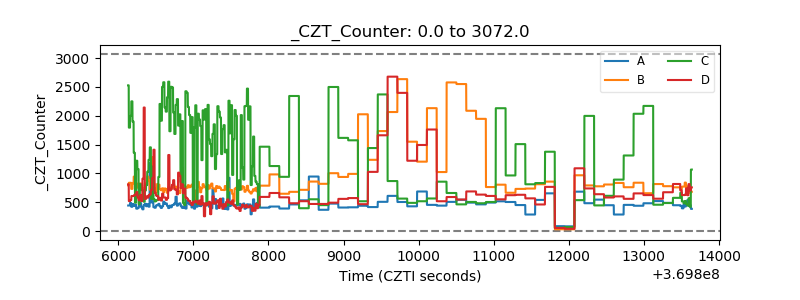 |
| +2.5 Volts monitor |  |
| +5 Volts monitor |  |
| _ROLL_ROT | 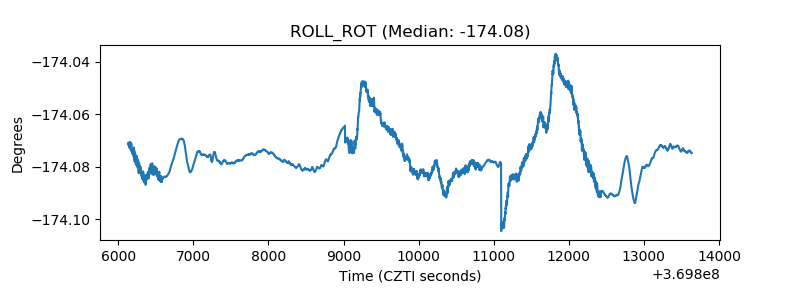 |
| _Roll_DEC | 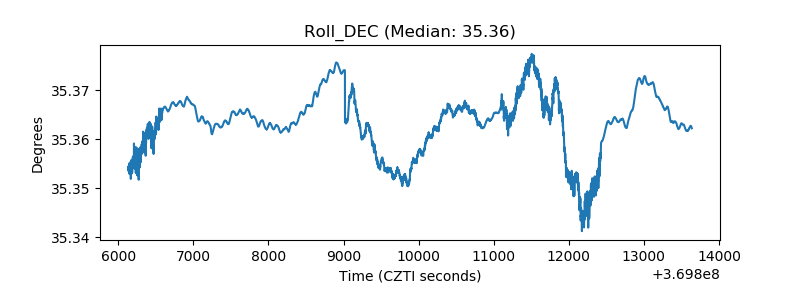 |
| _Roll_RA | 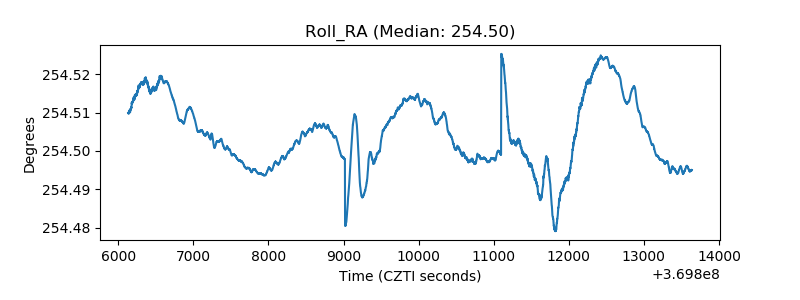 |
| Veto Counter | 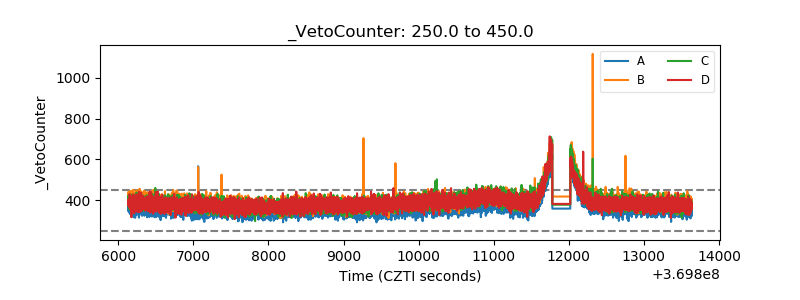 |