| Param | Original file | Final file |
|---|---|---|
| Filename | modeM0/AS1A10_005T01_9000004700_32331cztM0_level2.evt | modeM0/AS1A10_005T01_9000004700_32331cztM0_level2_quad_clean.evt |
| Size (bytes) | 1,185,840,000 | 143,663,040 |
| Size | 1.1 GB | 137.0 MB |
| Events in quadrant A | 5,414,703 | 951,117 |
| Events in quadrant B | 10,132,734 | 893,377 |
| Events in quadrant C | 9,531,963 | 853,620 |
| Events in quadrant D | 10,066,195 | 862,842 |
| Mode M0 | |||
|---|---|---|---|
| Quadrant | BADHDUFLAG | Total packets | Discarded packets |
| A | 0 | 23414 | 2 |
| B | 0 | 38509 | 1 |
| C | 0 | 35667 | 1 |
| D | 0 | 37643 | 1 |
| Mode M9 | |||
|---|---|---|---|
| Quadrant | BADHDUFLAG | Total packets | Discarded packets |
| A | 0 | 3 | 0 |
| B | 0 | 3 | 0 |
| C | 0 | 3 | 0 |
| D | 0 | 3 | 0 |
| Mode SS | |||
|---|---|---|---|
| Quadrant | BADHDUFLAG | Total packets | Discarded packets |
| A | 0 | 232 | 0 |
| B | 0 | 232 | 0 |
| C | 0 | 232 | 0 |
| D | 0 | 232 | 0 |
| Quadrant | Total seconds | Saturated seconds | Saturation percentage |
|---|---|---|---|
| A | 11399 | 152 | 1.333450% |
| B | 11399 | 827 | 7.255022% |
| C | 11399 | 1573 | 13.799456% |
| D | 11399 | 473 | 4.149487% |
Noise dominated data is calculated using 1-second bins in cleaned event files. If a bin has >2000 counts, and if more than 50% of those come from <1% of pixels, then it is considered to be noise-dominated and hence unusable.
| Quadrant | # 1 sec bins | Bins with >0 counts | Bins with >2000 counts | High rate bins dominated by noise | Noise dominated (total time) | Noise dominated (detector-on time) | Marked lightcurve |
|---|---|---|---|---|---|---|---|
| A | 11749 | 11400 | 5 | 5 | 0.04% | 0.04% | 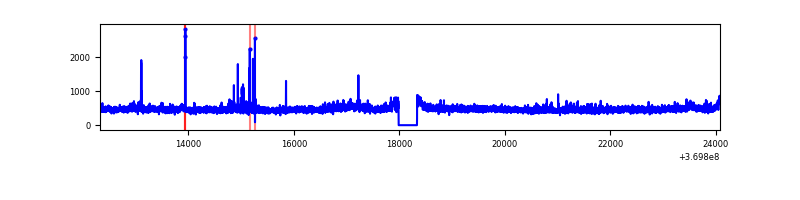 |
| B | 11749 | 11400 | 441 | 441 | 3.75% | 3.87% | 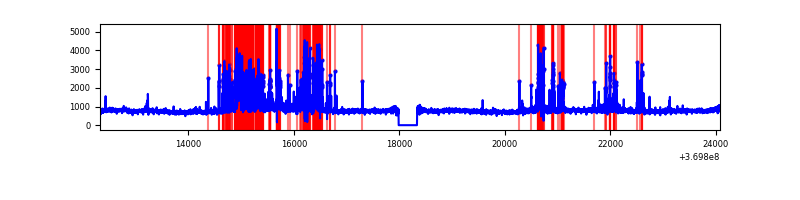 |
| C | 11749 | 11400 | 913 | 913 | 7.77% | 8.01% | 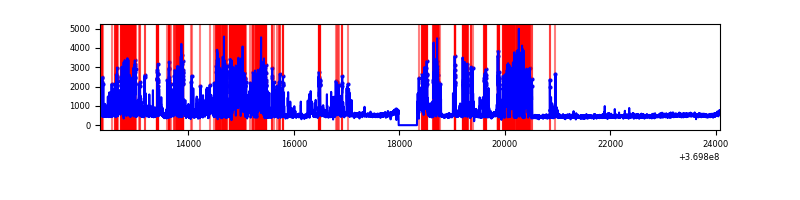 |
| D | 11749 | 11400 | 313 | 313 | 2.66% | 2.75% | 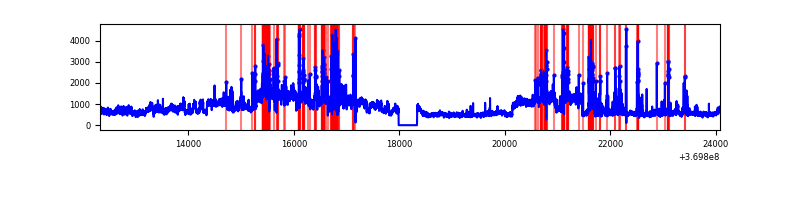 |
Top three noisy pixels from each quadrant. If the there are fewer than three noisy pixels in the level2.evt file, extra rows are filled as -1
| Pixel properties | Quadrant properties | ||||||
|---|---|---|---|---|---|---|---|
| Quadrant | DetID | PixID | Counts | Sigma | Mean | Median | Sigma |
| A | 12 | 189 | 95134 | 344.64 | 1353 | 1325 | 272.2 |
| A | 12 | 96 | 76072 | 274.61 | 1353 | 1325 | 272.2 |
| A | 13 | 6 | 24260 | 84.26 | 1353 | 1325 | 272.2 |
| B | 6 | 159 | 3147287 | 12642.3 | 1309 | 1275 | 248.8 |
| B | 5 | 172 | 1516839 | 6090.32 | 1309 | 1275 | 248.8 |
| B | 4 | 80 | 122315 | 486.4 | 1309 | 1275 | 248.8 |
| C | 0 | 10 | 4130269 | 14170.65 | 1243 | 1250 | 291.4 |
| C | 14 | 238 | 200650 | 684.33 | 1243 | 1250 | 291.4 |
| C | 15 | 208 | 200641 | 684.3 | 1243 | 1250 | 291.4 |
| D | 8 | 195 | 3930394 | 12713.74 | 1298 | 1264 | 309.0 |
| D | 7 | 38 | 329954 | 1063.56 | 1298 | 1264 | 309.0 |
| D | 12 | 233 | 306563 | 987.88 | 1298 | 1264 | 309.0 |
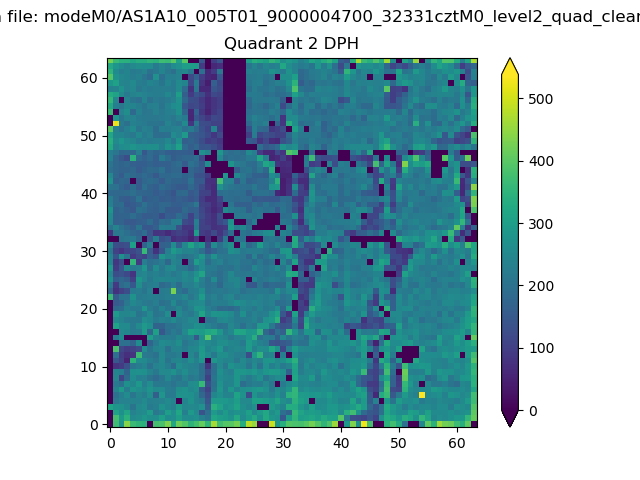
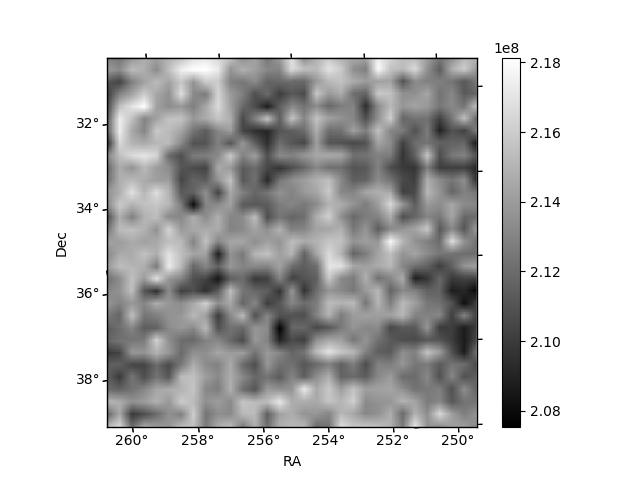
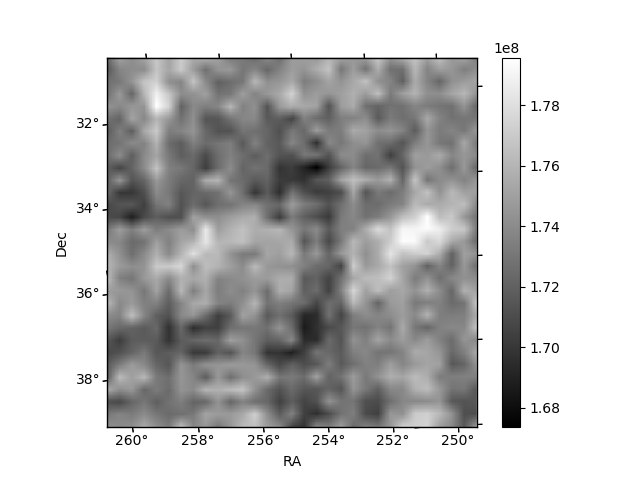
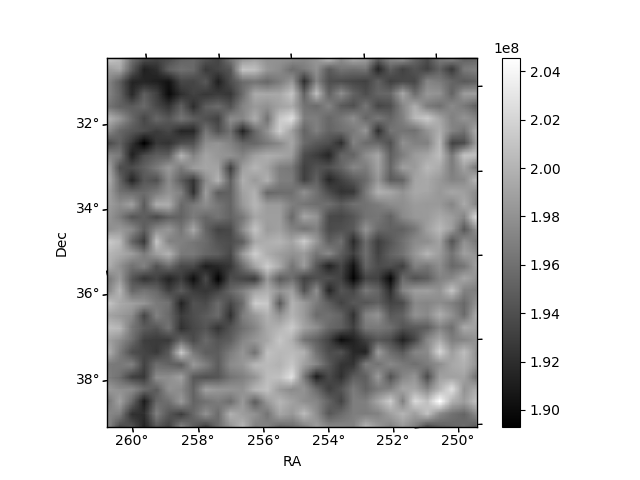
Histogram calculated using DETX and DETY for each event in the final _common_clean file
| Quadrant A | 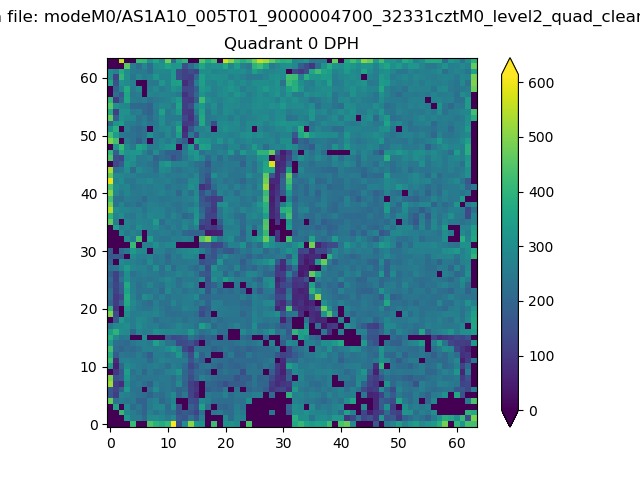 |
 |
Quadrant B |
|---|---|---|---|
| Quadrant D |  |
 |
Quadrant C |
| Plot type | Count rate plots | Images |
|---|---|---|
| Comparison with Poisson distribution Blue bars denote a histogram of data divided into 1 sec bins. Red curve is a Poisson curve with rate = median count rate of data. |
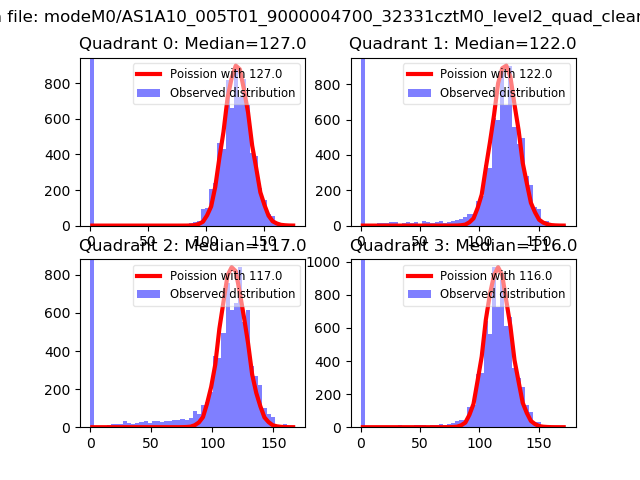 |
 |
| Quadrant-wise count rates Data is divided into 100 sec bins |
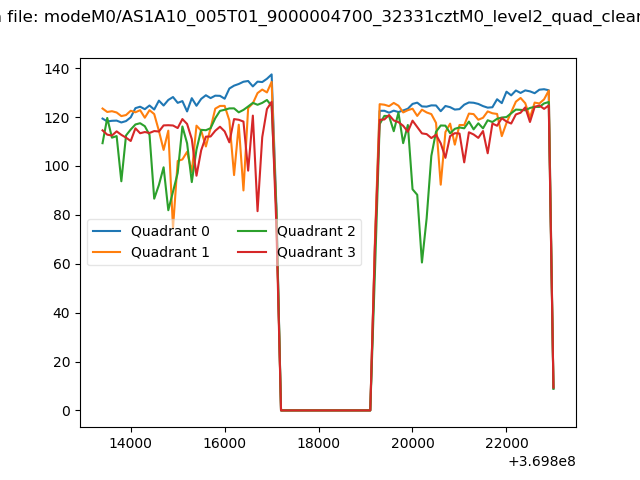 |
|
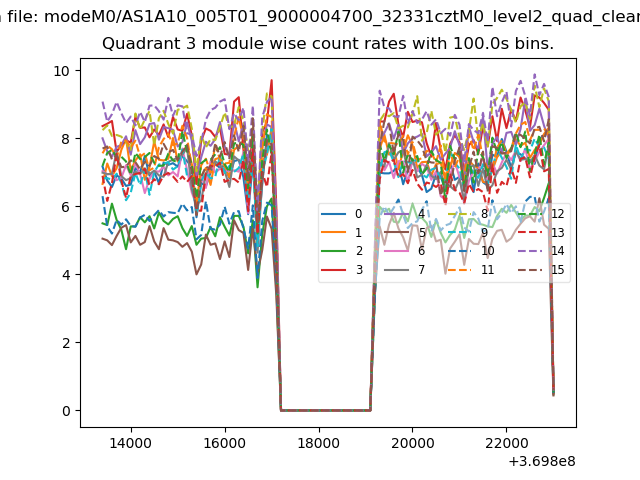
| Module-wise count rates for Quadrant A Data is divided into 100 sec bins |
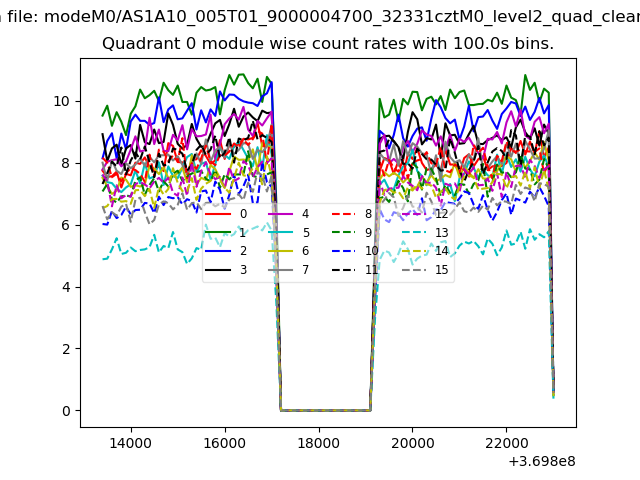 |
 |
| Module-wise count rates for Quadrant B Data is divided into 100 sec bins |
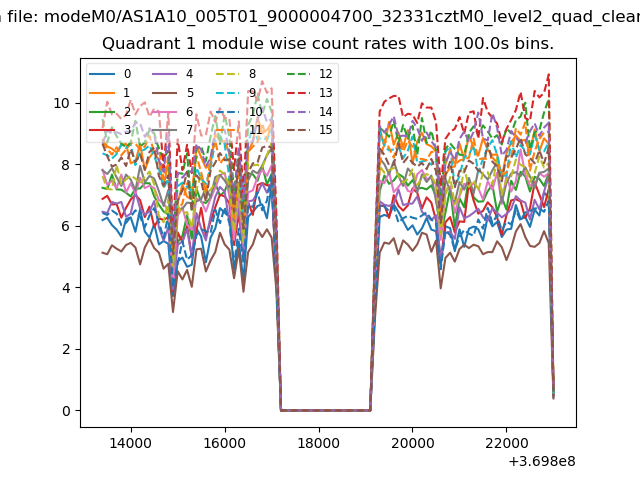 |
 |
| Module-wise count rates for Quadrant C Data is divided into 100 sec bins |
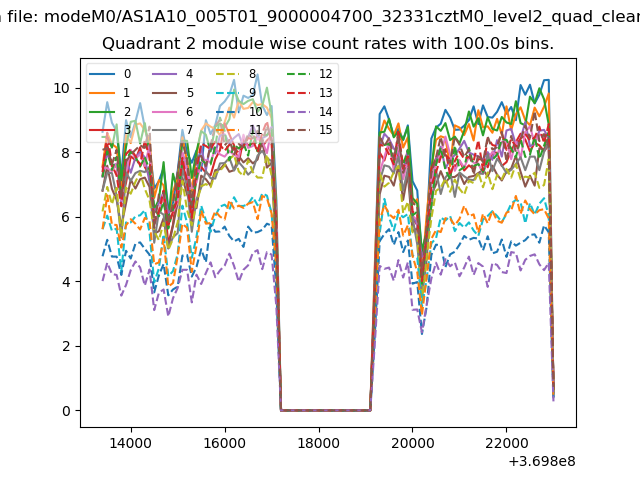 |
 |
| Module-wise count rates for Quadrant D Data is divided into 100 sec bins |
 |
 |
| Parameter | Plot |
|---|---|
| CZT HV Monitor | 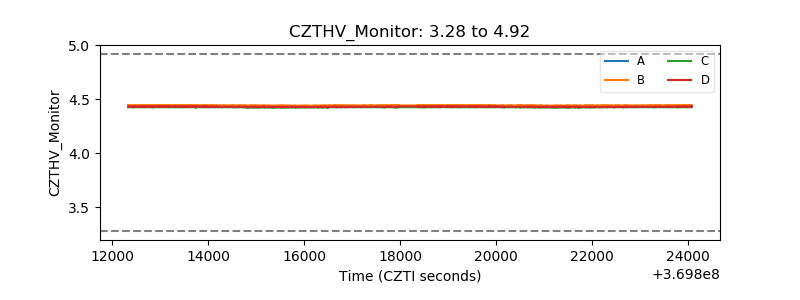 |
| D_VDD | 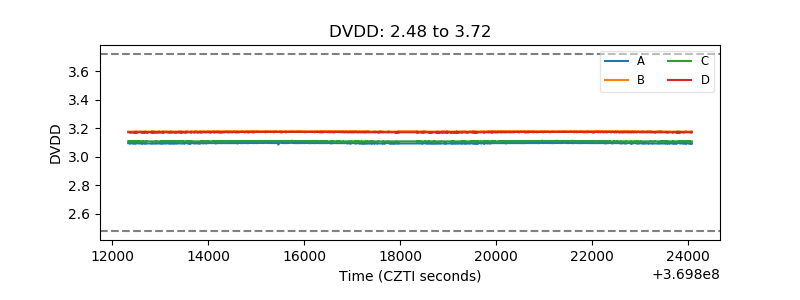 |
| Temperature 1 | 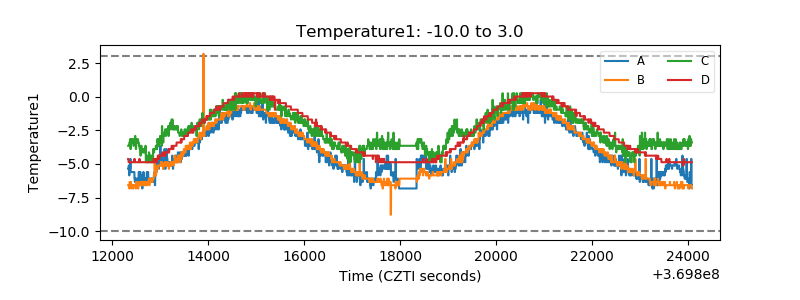 |
| Veto HV Monitor | 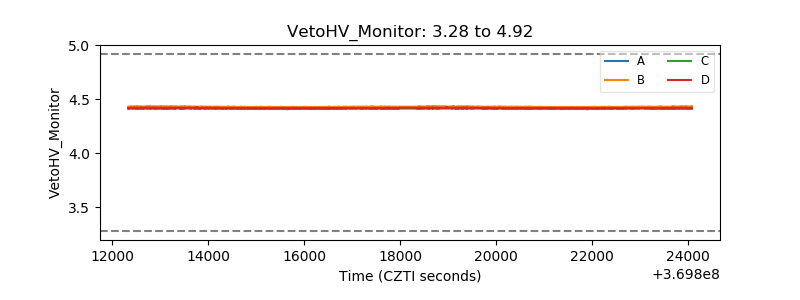 |
| Veto LLD | 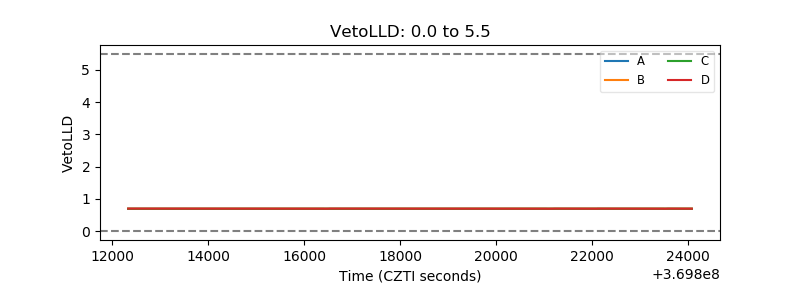 |
| Alpha Counter | 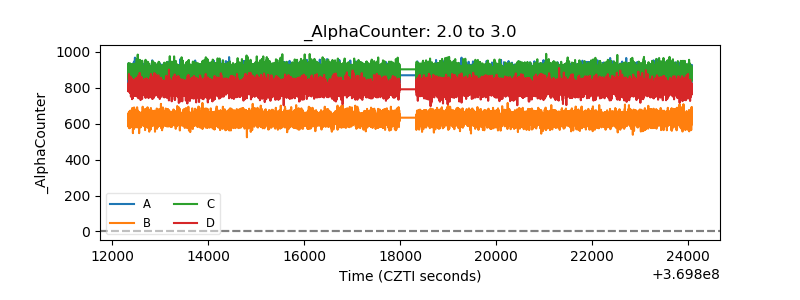 |
| _CPM_Rate | 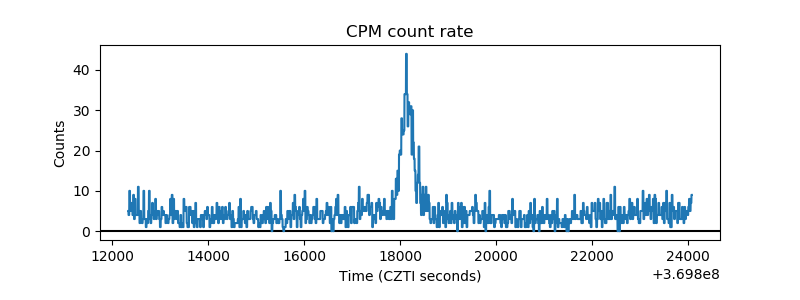 |
| CZT Counter | 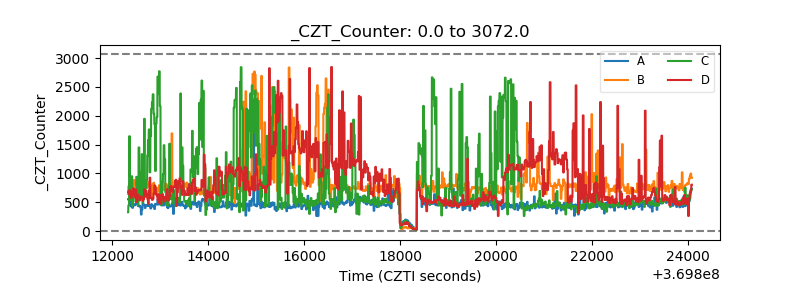 |
| +2.5 Volts monitor |  |
| +5 Volts monitor |  |
| _ROLL_ROT | 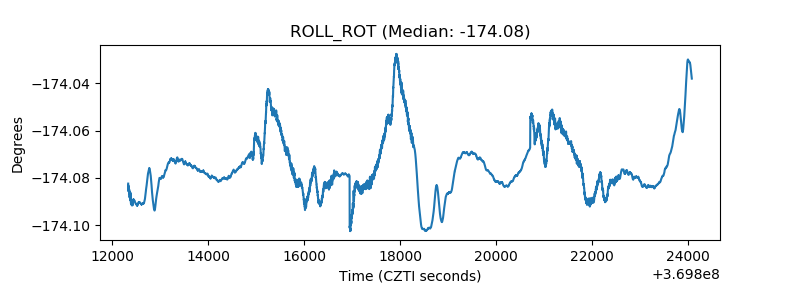 |
| _Roll_DEC | 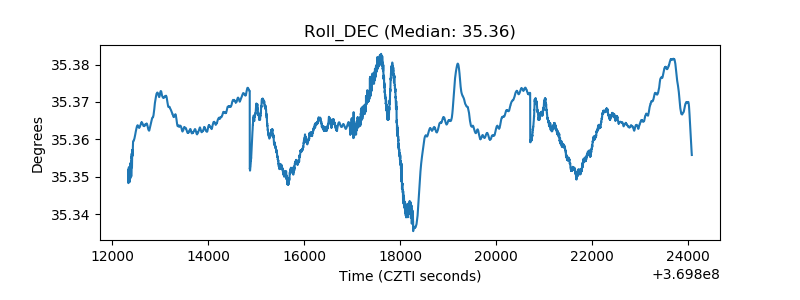 |
| _Roll_RA |  |
| Veto Counter | 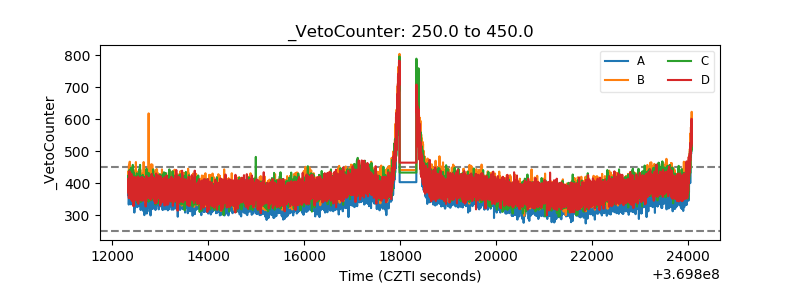 |