| Param | Original file | Final file |
|---|---|---|
| Filename | modeM0/AS1A10_005T01_9000004700_32332cztM0_level2.evt | modeM0/AS1A10_005T01_9000004700_32332cztM0_level2_quad_clean.evt |
| Size (bytes) | 1,307,211,840 | 177,050,880 |
| Size | 1.2 GB | 168.8 MB |
| Events in quadrant A | 6,700,658 | 1,189,378 |
| Events in quadrant B | 12,500,415 | 1,097,588 |
| Events in quadrant C | 7,301,773 | 1,106,096 |
| Events in quadrant D | 12,193,188 | 1,051,758 |
| Mode M0 | |||
|---|---|---|---|
| Quadrant | BADHDUFLAG | Total packets | Discarded packets |
| A | 0 | 28189 | 4 |
| B | 0 | 46500 | 3 |
| C | 0 | 29852 | 3 |
| D | 0 | 45544 | 3 |
| Mode M9 | |||
|---|---|---|---|
| Quadrant | BADHDUFLAG | Total packets | Discarded packets |
| A | 0 | 23 | 0 |
| B | 0 | 23 | 0 |
| C | 0 | 23 | 0 |
| D | 0 | 23 | 0 |
| Mode SS | |||
|---|---|---|---|
| Quadrant | BADHDUFLAG | Total packets | Discarded packets |
| A | 0 | 270 | 0 |
| B | 0 | 270 | 0 |
| C | 0 | 270 | 0 |
| D | 0 | 270 | 0 |
| Quadrant | Total seconds | Saturated seconds | Saturation percentage |
|---|---|---|---|
| A | 13272 | 157 | 1.182942% |
| B | 13272 | 1192 | 8.981314% |
| C | 13272 | 505 | 3.805003% |
| D | 13272 | 1024 | 7.715491% |
Noise dominated data is calculated using 1-second bins in cleaned event files. If a bin has >2000 counts, and if more than 50% of those come from <1% of pixels, then it is considered to be noise-dominated and hence unusable.
| Quadrant | # 1 sec bins | Bins with >0 counts | Bins with >2000 counts | High rate bins dominated by noise | Noise dominated (total time) | Noise dominated (detector-on time) | Marked lightcurve |
|---|---|---|---|---|---|---|---|
| A | 15477 | 13275 | 1 | 1 | 0.01% | 0.01% | 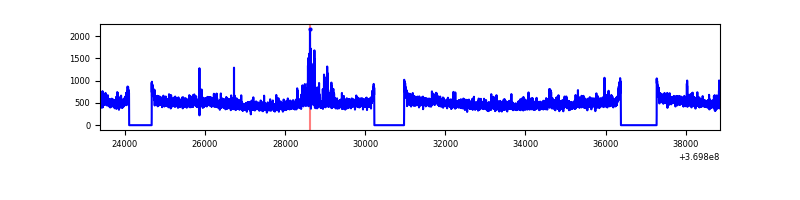 |
| B | 15477 | 13275 | 646 | 646 | 4.17% | 4.87% | 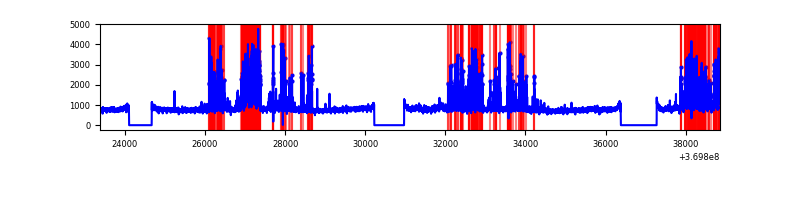 |
| C | 15477 | 13275 | 238 | 238 | 1.54% | 1.79% |  |
| D | 15477 | 13275 | 675 | 675 | 4.36% | 5.08% | 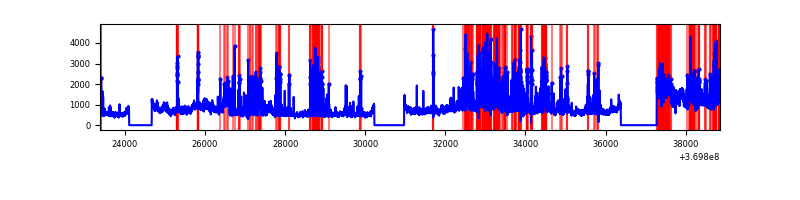 |
Top three noisy pixels from each quadrant. If the there are fewer than three noisy pixels in the level2.evt file, extra rows are filled as -1
| Pixel properties | Quadrant properties | ||||||
|---|---|---|---|---|---|---|---|
| Quadrant | DetID | PixID | Counts | Sigma | Mean | Median | Sigma |
| A | 12 | 189 | 395228 | 1207.72 | 1622 | 1588 | 325.9 |
| A | 13 | 254 | 27639 | 79.93 | 1622 | 1588 | 325.9 |
| A | 13 | 6 | 26727 | 77.13 | 1622 | 1588 | 325.9 |
| B | 6 | 159 | 3728843 | 12676.34 | 1551 | 1512 | 294.0 |
| B | 5 | 172 | 2175758 | 7394.43 | 1551 | 1512 | 294.0 |
| B | 0 | 190 | 204725 | 691.11 | 1551 | 1512 | 294.0 |
| C | 0 | 10 | 860194 | 2393.28 | 1534 | 1544 | 358.8 |
| C | 14 | 238 | 244778 | 677.95 | 1534 | 1544 | 358.8 |
| C | 4 | 175 | 82688 | 226.17 | 1534 | 1544 | 358.8 |
| D | 8 | 195 | 3206101 | 8809.81 | 1540 | 1501 | 363.8 |
| D | 13 | 174 | 760361 | 2086.19 | 1540 | 1501 | 363.8 |
| D | 13 | 249 | 673922 | 1848.56 | 1540 | 1501 | 363.8 |
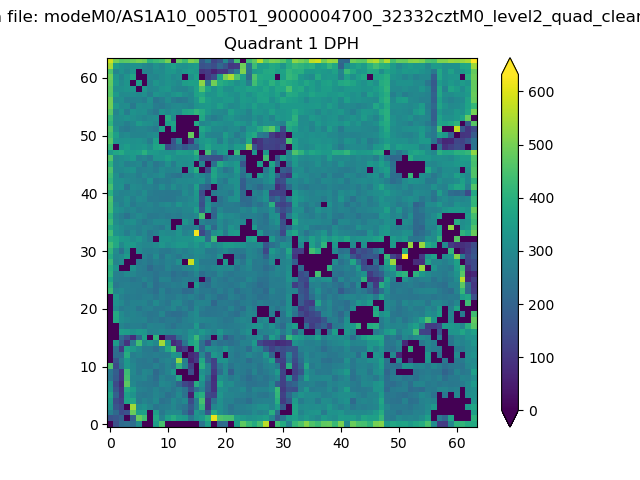
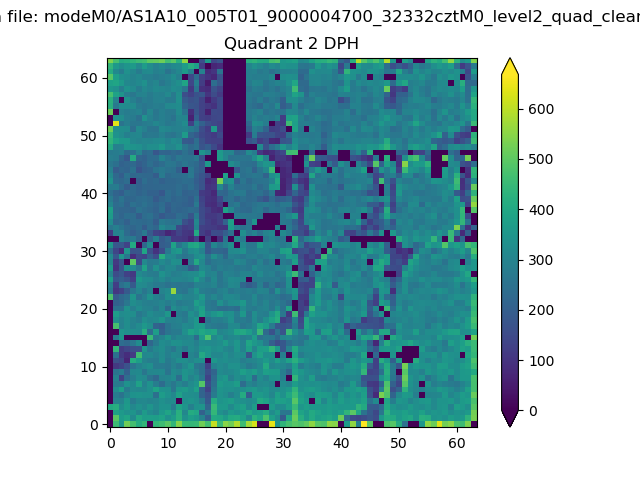
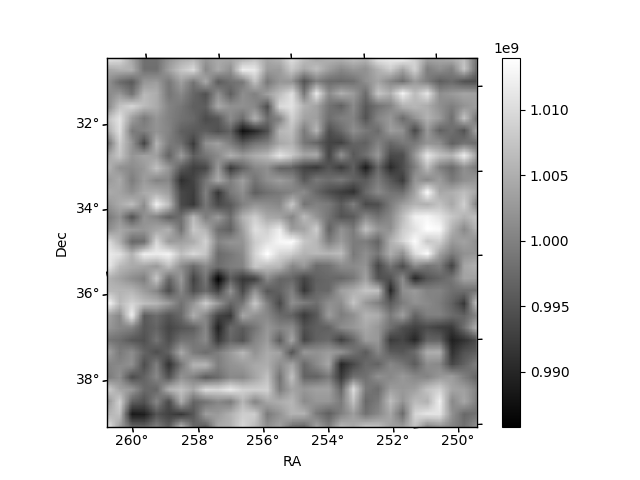
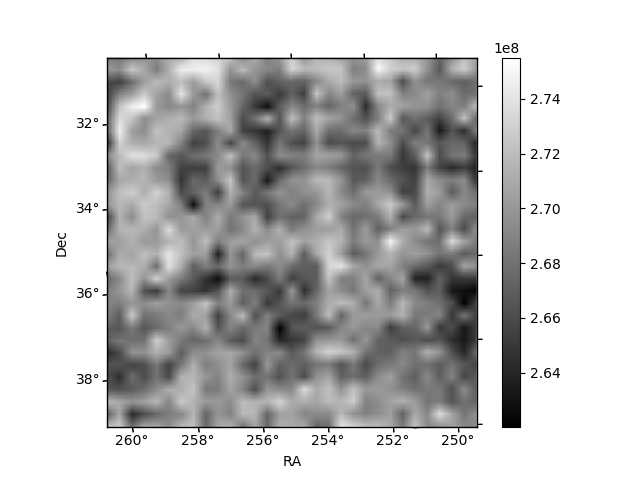
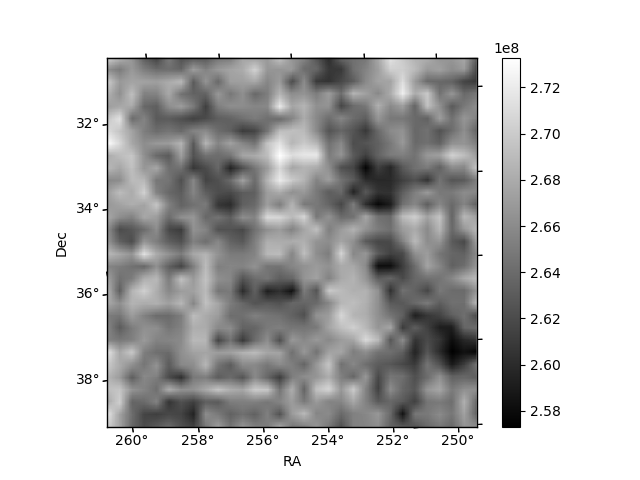
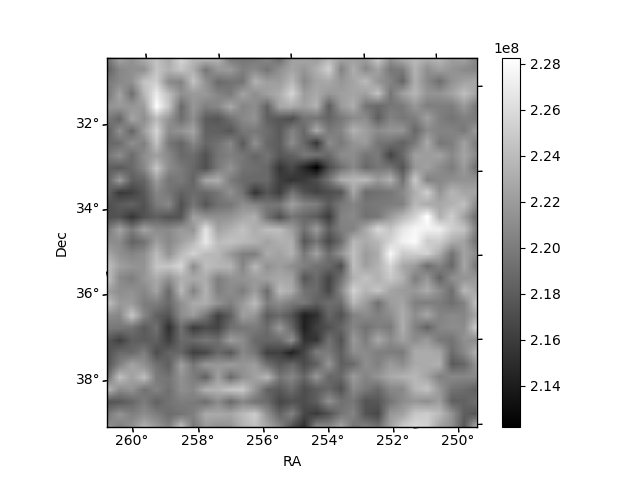
Histogram calculated using DETX and DETY for each event in the final _common_clean file
| Quadrant A | 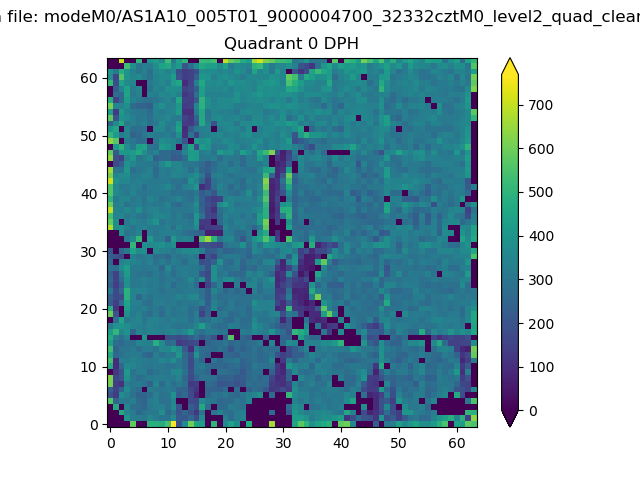 |
 |
Quadrant B |
|---|---|---|---|
| Quadrant D | 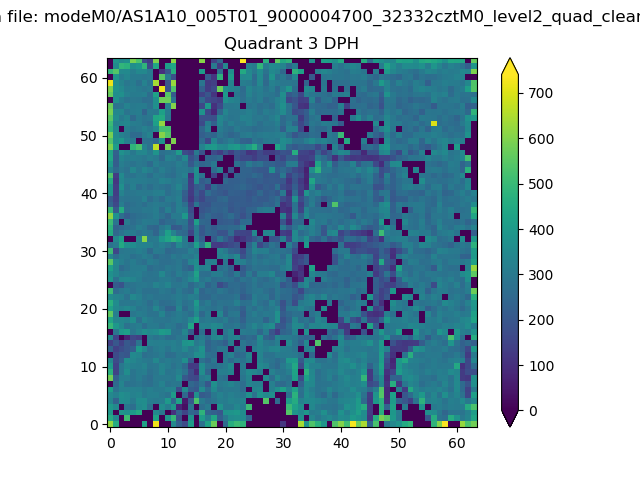 |
 |
Quadrant C |
| Plot type | Count rate plots | Images |
|---|---|---|
| Comparison with Poisson distribution Blue bars denote a histogram of data divided into 1 sec bins. Red curve is a Poisson curve with rate = median count rate of data. |
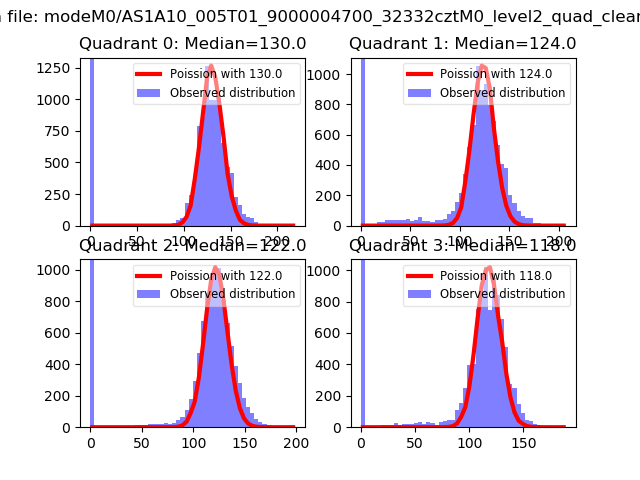 |
 |
| Quadrant-wise count rates Data is divided into 100 sec bins |
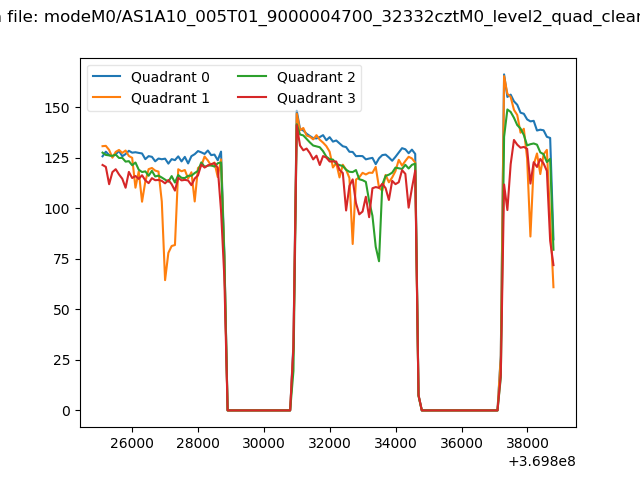 |
|
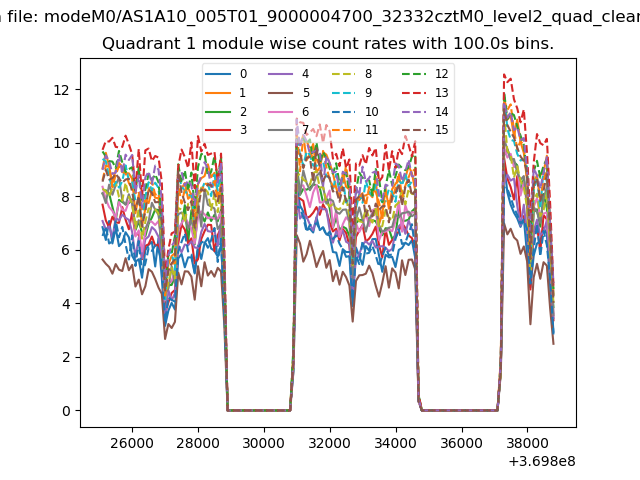
| Module-wise count rates for Quadrant A Data is divided into 100 sec bins |
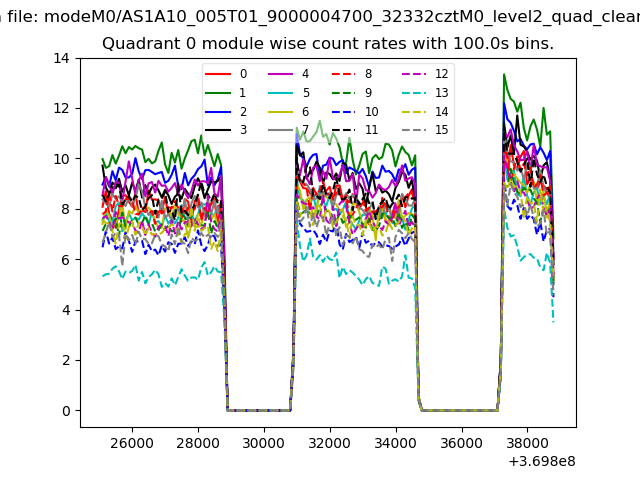 |
 |
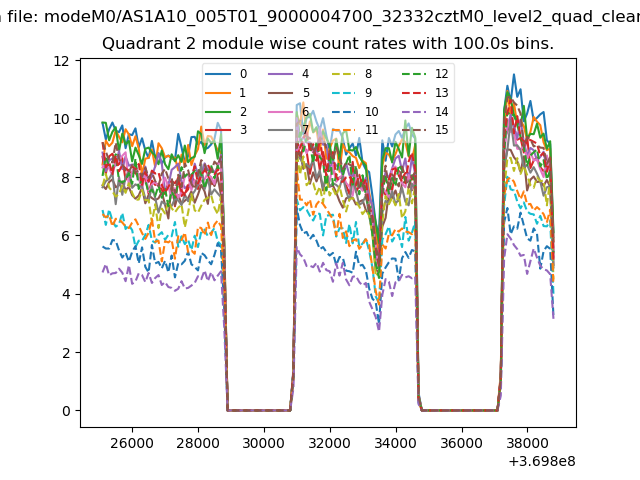
| Module-wise count rates for Quadrant B Data is divided into 100 sec bins |
 |
 |
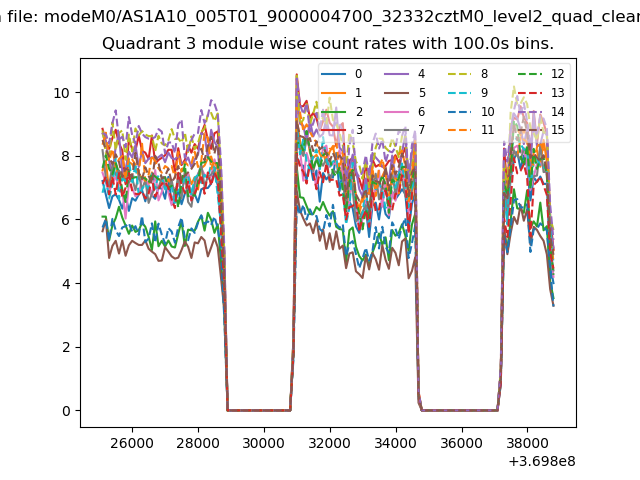
| Module-wise count rates for Quadrant C Data is divided into 100 sec bins |
 |
 |
| Module-wise count rates for Quadrant D Data is divided into 100 sec bins |
 |
 |
| Parameter | Plot |
|---|---|
| CZT HV Monitor | 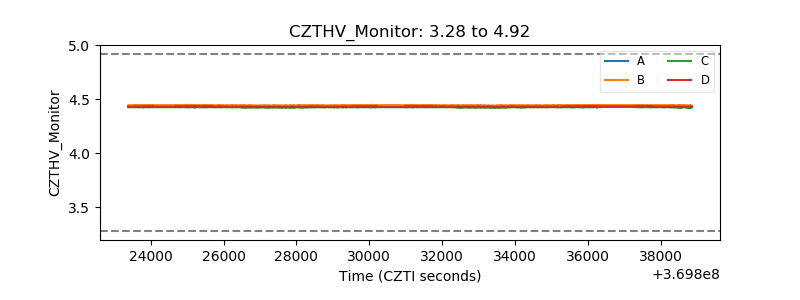 |
| D_VDD | 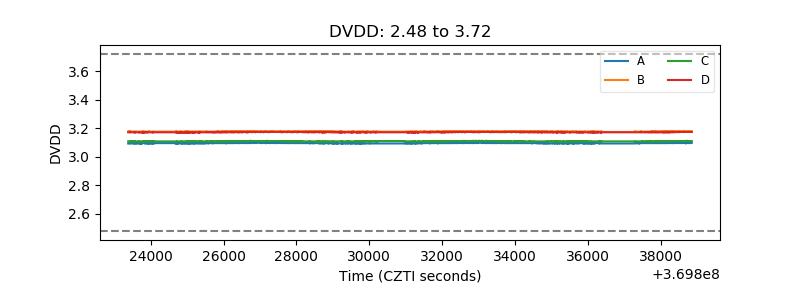 |
| Temperature 1 | 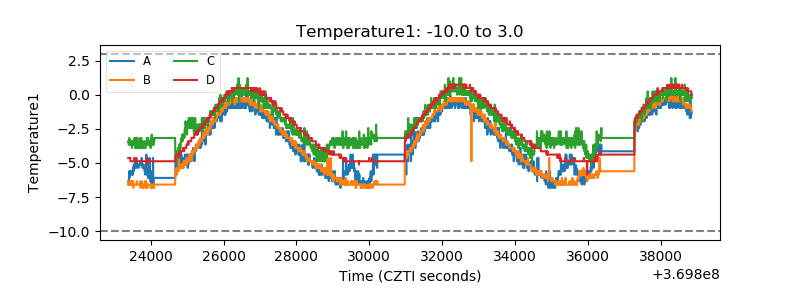 |
| Veto HV Monitor | 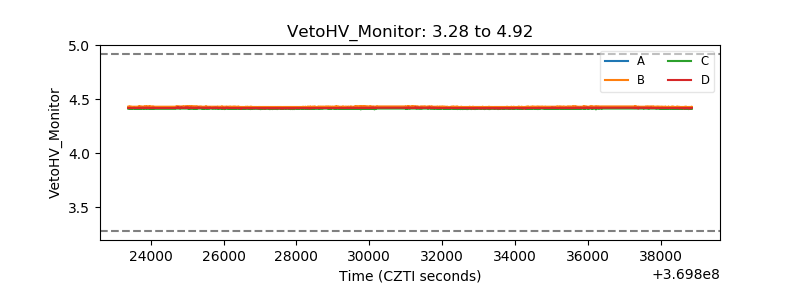 |
| Veto LLD | 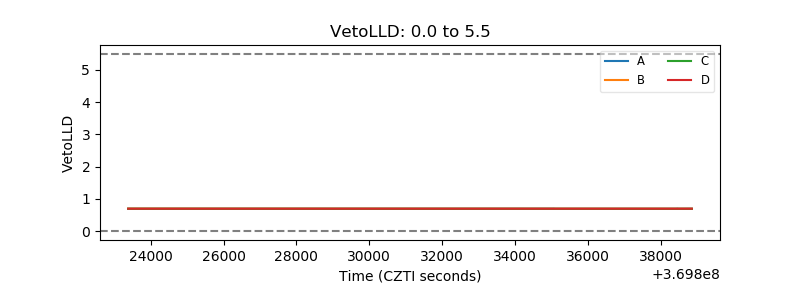 |
| Alpha Counter | 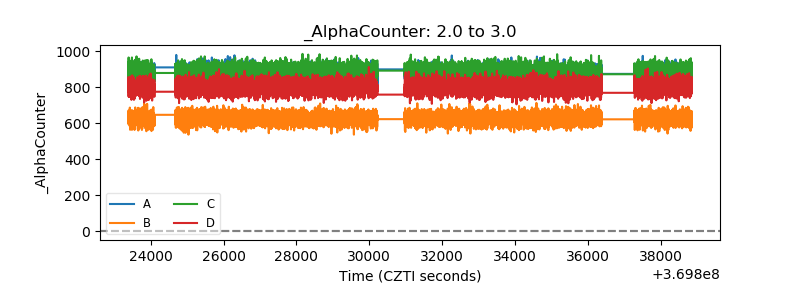 |
| _CPM_Rate | 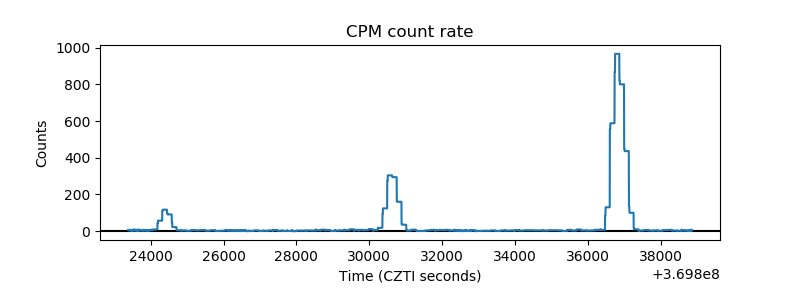 |
| CZT Counter |  |
| +2.5 Volts monitor |  |
| +5 Volts monitor |  |
| _ROLL_ROT | 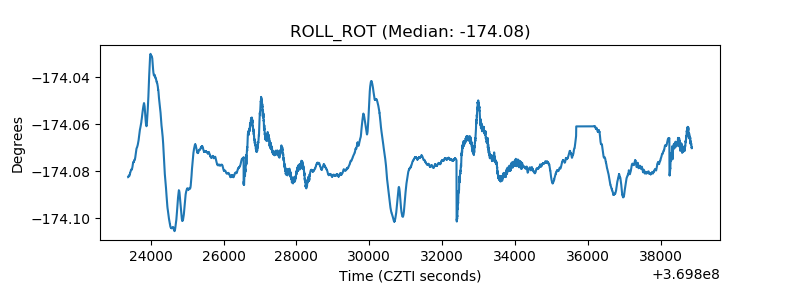 |
| _Roll_DEC |  |
| _Roll_RA | 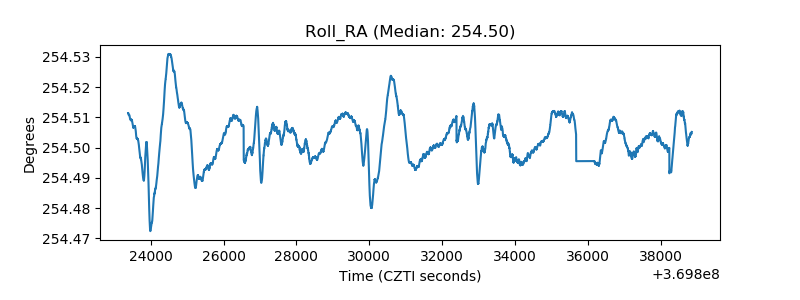 |
| Veto Counter | 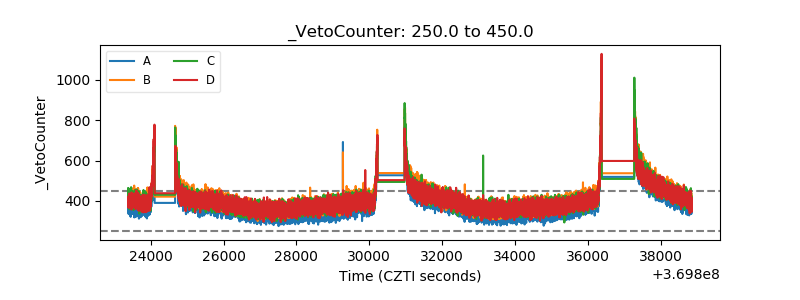 |