| Param | Original file | Final file |
|---|---|---|
| Filename | modeM0/AS1A10_005T01_9000004700_32333cztM0_level2.evt | modeM0/AS1A10_005T01_9000004700_32333cztM0_level2_quad_clean.evt |
| Size (bytes) | 669,078,720 | 82,140,480 |
| Size | 638.1 MB | 78.3 MB |
| Events in quadrant A | 2,942,947 | 574,887 |
| Events in quadrant B | 7,020,162 | 475,226 |
| Events in quadrant C | 3,217,632 | 527,663 |
| Events in quadrant D | 6,674,453 | 486,951 |
| Mode M0 | |||
|---|---|---|---|
| Quadrant | BADHDUFLAG | Total packets | Discarded packets |
| A | 0 | 12661 | 2 |
| B | 0 | 25176 | 1 |
| C | 0 | 13295 | 1 |
| D | 0 | 24255 | 1 |
| Mode M9 | |||
|---|---|---|---|
| Quadrant | BADHDUFLAG | Total packets | Discarded packets |
| A | 0 | 11 | 0 |
| B | 0 | 11 | 0 |
| C | 0 | 11 | 0 |
| D | 0 | 11 | 0 |
| Mode SS | |||
|---|---|---|---|
| Quadrant | BADHDUFLAG | Total packets | Discarded packets |
| A | 0 | 122 | 0 |
| B | 0 | 122 | 0 |
| C | 0 | 122 | 0 |
| D | 0 | 122 | 0 |
| Quadrant | Total seconds | Saturated seconds | Saturation percentage |
|---|---|---|---|
| A | 6043 | 36 | 0.595731% |
| B | 6043 | 1151 | 19.046831% |
| C | 6043 | 140 | 2.316730% |
| D | 6043 | 727 | 12.030448% |
Noise dominated data is calculated using 1-second bins in cleaned event files. If a bin has >2000 counts, and if more than 50% of those come from <1% of pixels, then it is considered to be noise-dominated and hence unusable.
| Quadrant | # 1 sec bins | Bins with >0 counts | Bins with >2000 counts | High rate bins dominated by noise | Noise dominated (total time) | Noise dominated (detector-on time) | Marked lightcurve |
|---|---|---|---|---|---|---|---|
| A | 7118 | 6044 | 0 | 0 | 0.00% | 0.00% | 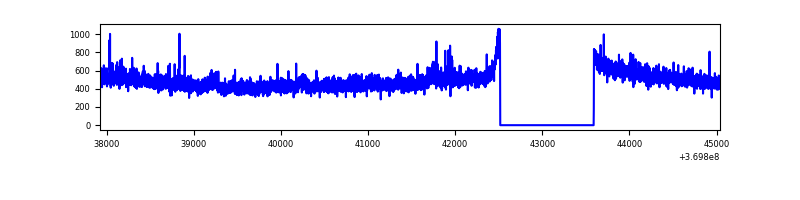 |
| B | 7118 | 6044 | 765 | 765 | 10.75% | 12.66% | 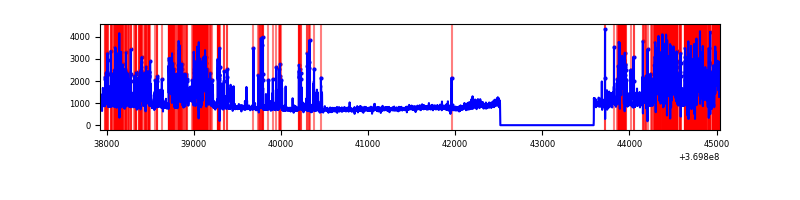 |
| C | 7118 | 6044 | 42 | 42 | 0.59% | 0.69% | 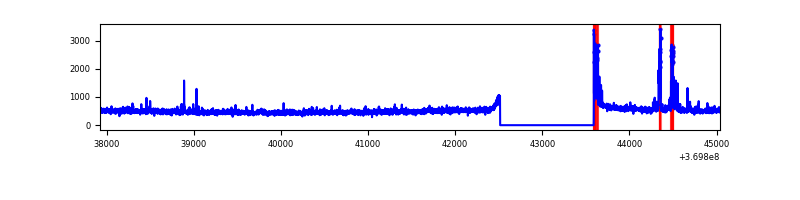 |
| D | 7118 | 6044 | 606 | 606 | 8.51% | 10.03% | 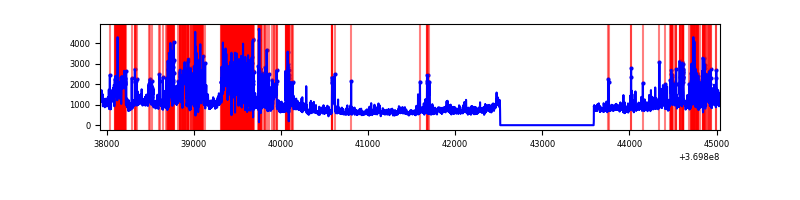 |
Top three noisy pixels from each quadrant. If the there are fewer than three noisy pixels in the level2.evt file, extra rows are filled as -1
| Pixel properties | Quadrant properties | ||||||
|---|---|---|---|---|---|---|---|
| Quadrant | DetID | PixID | Counts | Sigma | Mean | Median | Sigma |
| A | 12 | 189 | 47779 | 319.79 | 740 | 727 | 147.1 |
| A | 13 | 6 | 17686 | 115.26 | 740 | 727 | 147.1 |
| A | 13 | 254 | 12316 | 78.76 | 740 | 727 | 147.1 |
| B | 5 | 172 | 2375631 | 18717.69 | 669 | 653 | 126.9 |
| B | 6 | 159 | 1770895 | 13951.64 | 669 | 653 | 126.9 |
| B | 0 | 190 | 87197 | 682.07 | 669 | 653 | 126.9 |
| C | 0 | 207 | 117978 | 718.14 | 700 | 704 | 163.3 |
| C | 14 | 238 | 116274 | 707.71 | 700 | 704 | 163.3 |
| C | 0 | 10 | 80749 | 490.17 | 700 | 704 | 163.3 |
| D | 8 | 195 | 1935088 | 11880.68 | 689 | 673 | 162.8 |
| D | 12 | 218 | 584036 | 3582.87 | 689 | 673 | 162.8 |
| D | 13 | 249 | 439687 | 2696.31 | 689 | 673 | 162.8 |
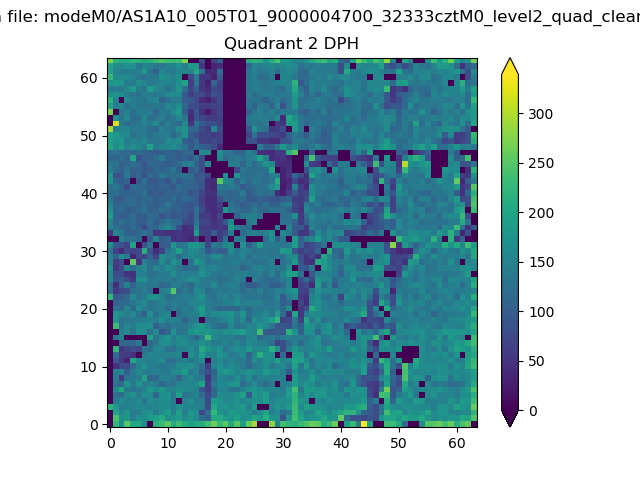
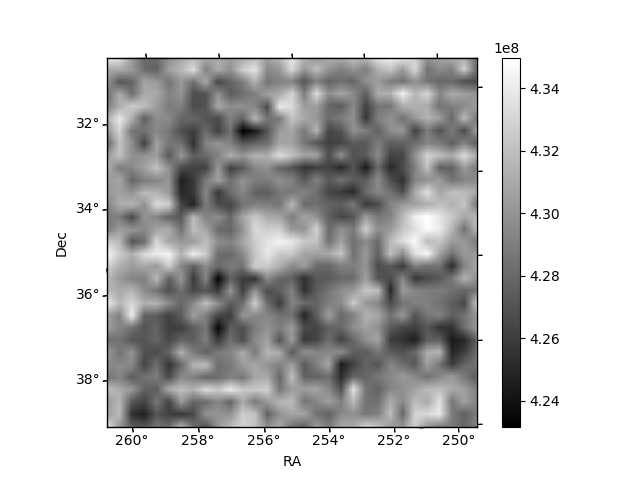
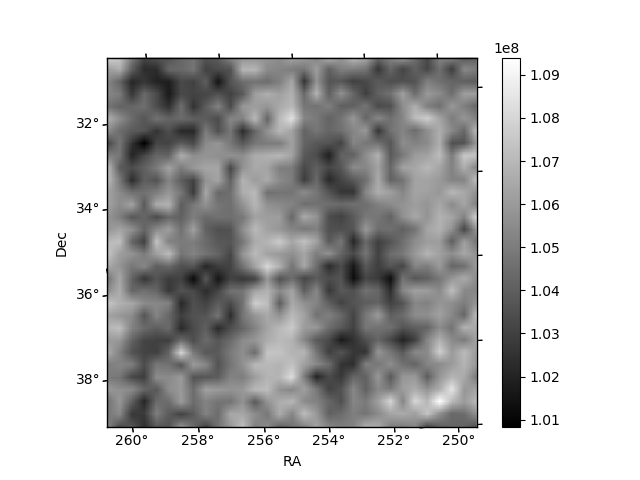
Histogram calculated using DETX and DETY for each event in the final _common_clean file
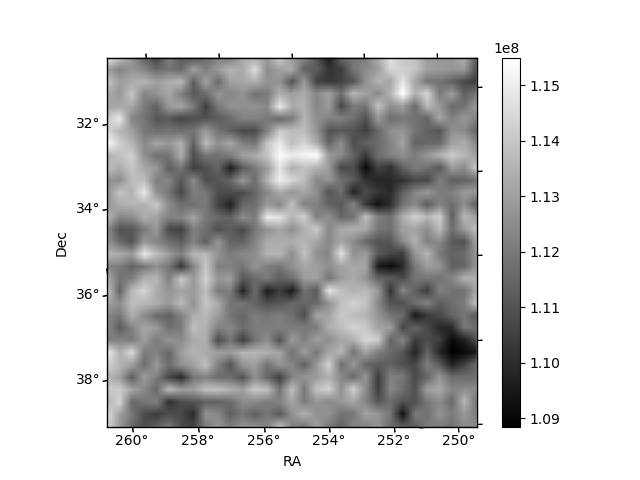
| Quadrant A | 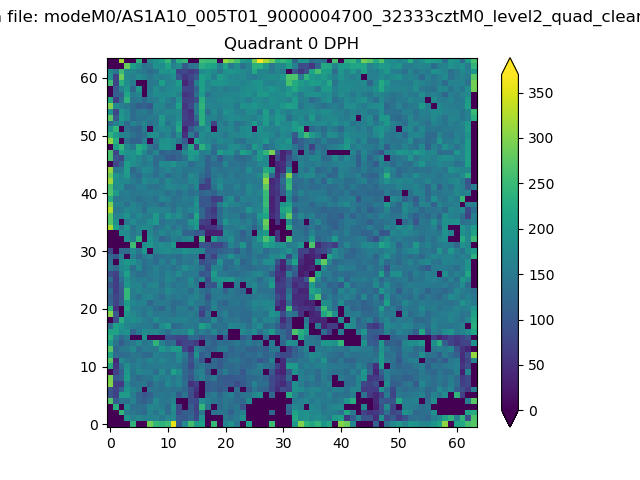 |
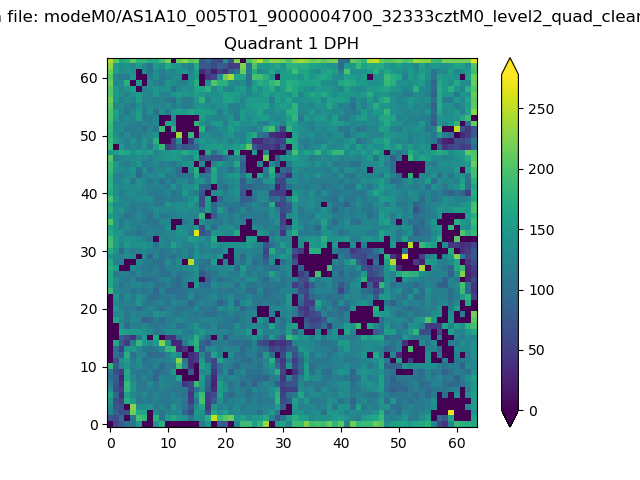 |
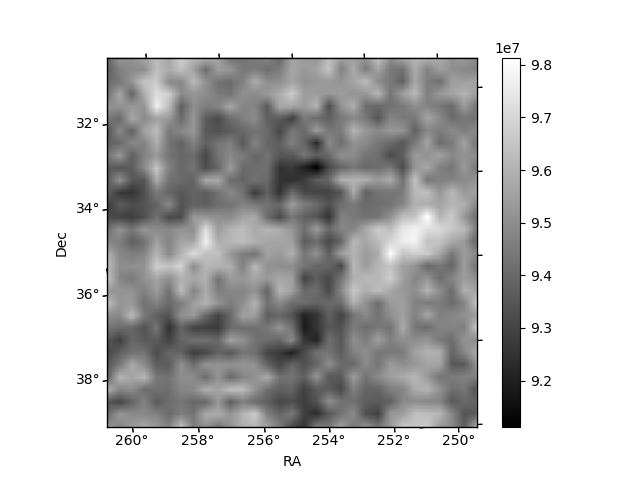
Quadrant B |
|---|---|---|---|
| Quadrant D | 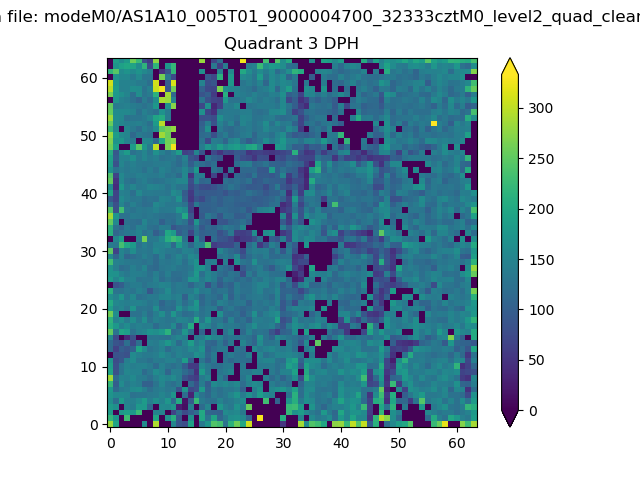 |
 |
Quadrant C |
| Plot type | Count rate plots | Images |
|---|---|---|
| Comparison with Poisson distribution Blue bars denote a histogram of data divided into 1 sec bins. Red curve is a Poisson curve with rate = median count rate of data. |
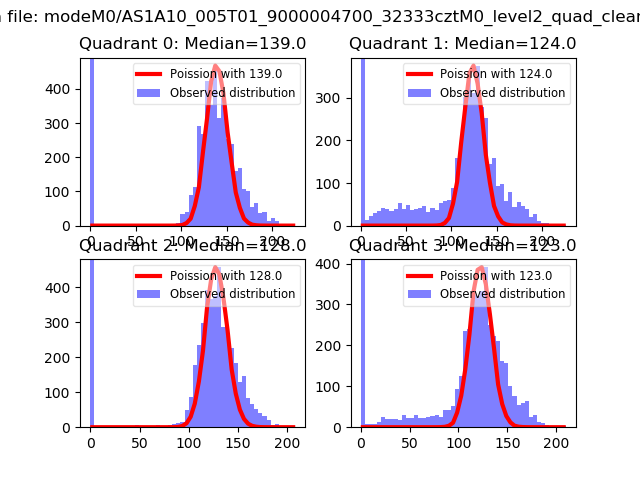 |
 |
| Quadrant-wise count rates Data is divided into 100 sec bins |
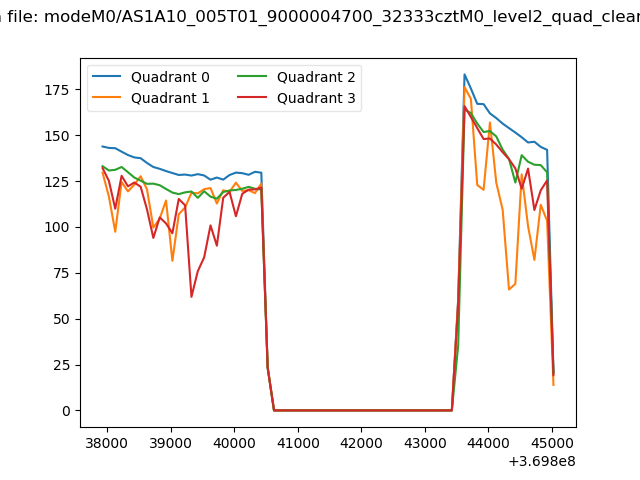 |
|
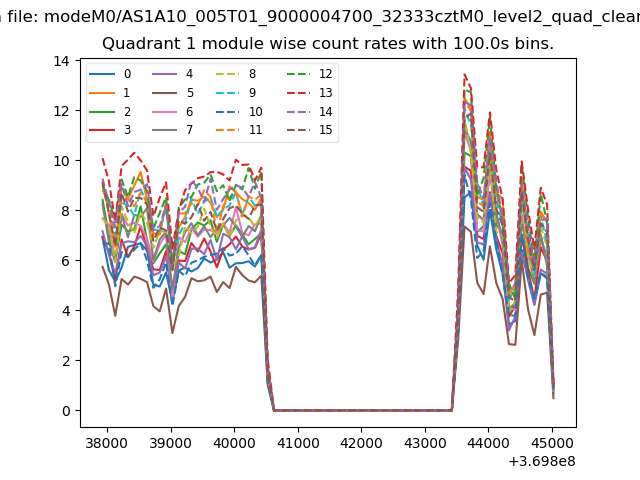
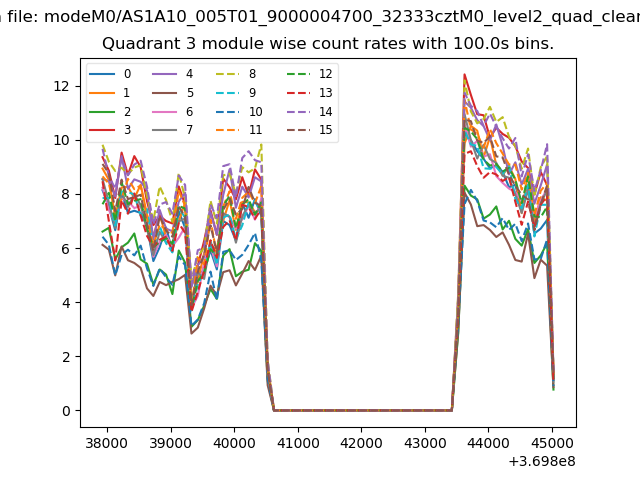
| Module-wise count rates for Quadrant A Data is divided into 100 sec bins |
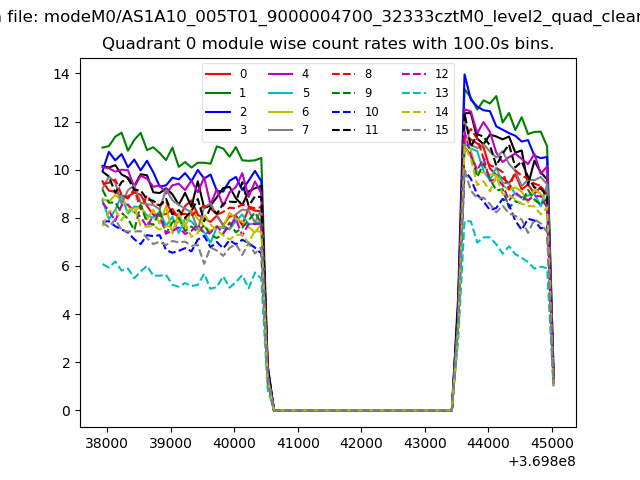 |
 |
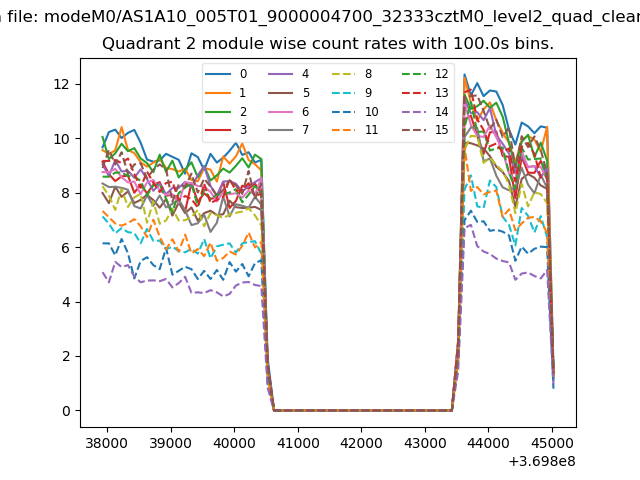
| Module-wise count rates for Quadrant B Data is divided into 100 sec bins |
 |
 |
| Module-wise count rates for Quadrant C Data is divided into 100 sec bins |
 |
 |
| Module-wise count rates for Quadrant D Data is divided into 100 sec bins |
 |
 |
| Parameter | Plot |
|---|---|
| CZT HV Monitor | 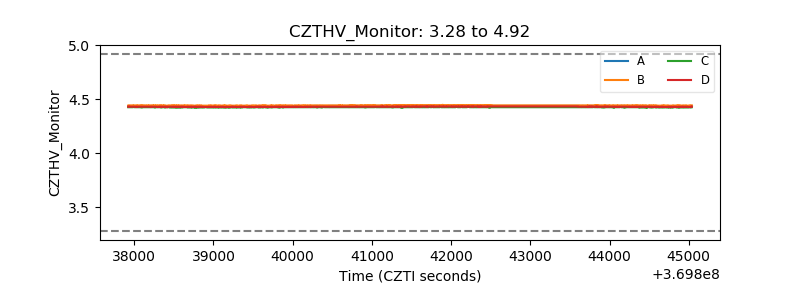 |
| D_VDD | 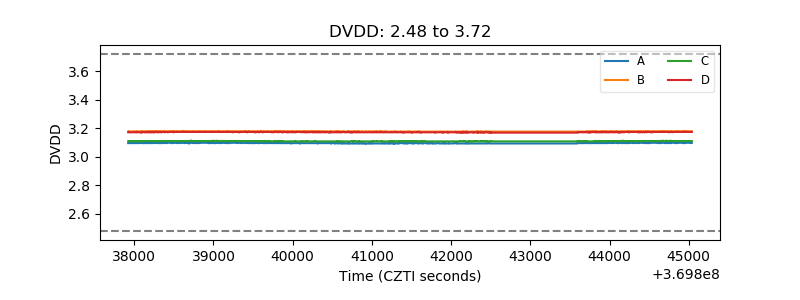 |
| Temperature 1 | 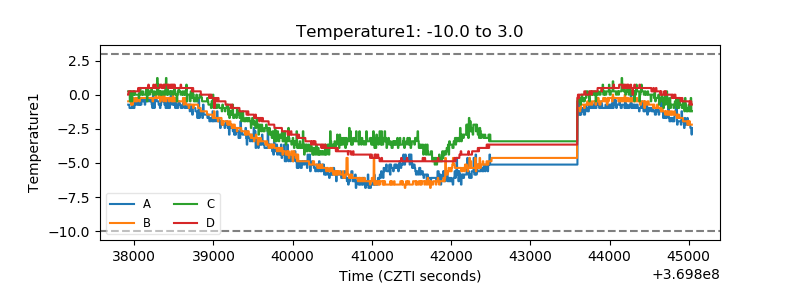 |
| Veto HV Monitor | 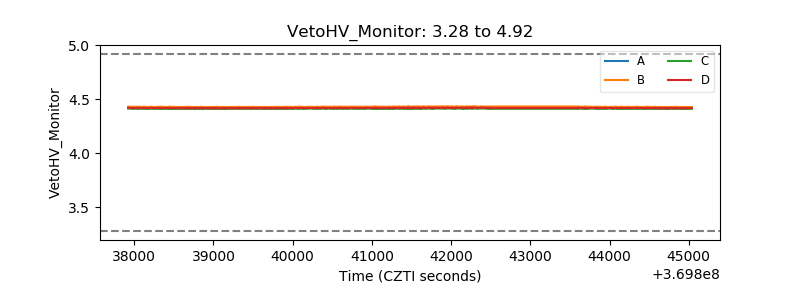 |
| Veto LLD | 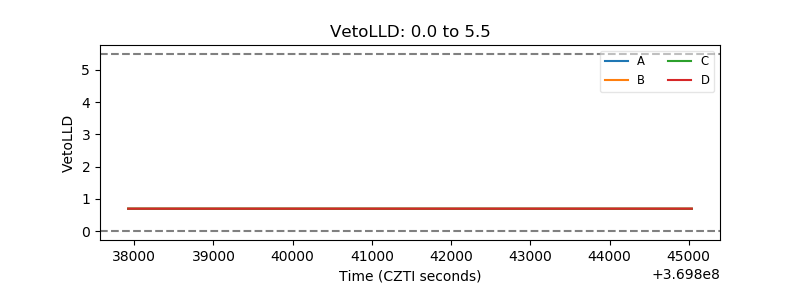 |
| Alpha Counter | 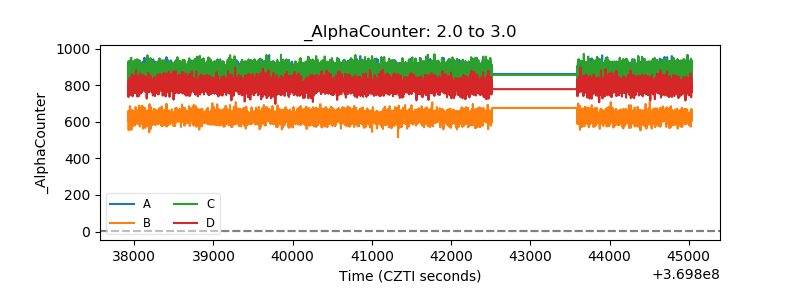 |
| _CPM_Rate | 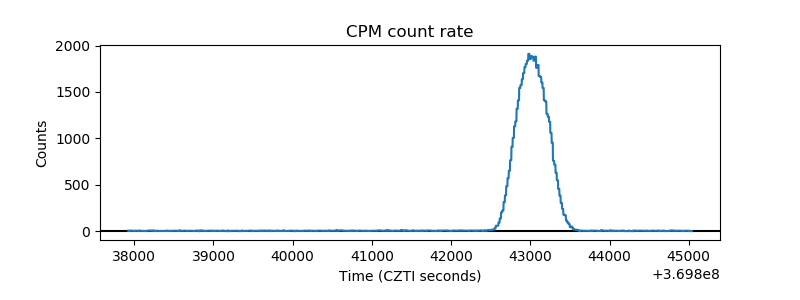 |
| CZT Counter | 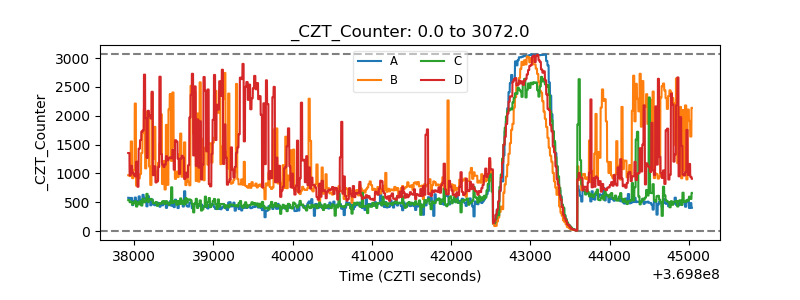 |
| +2.5 Volts monitor |  |
| +5 Volts monitor |  |
| _ROLL_ROT | 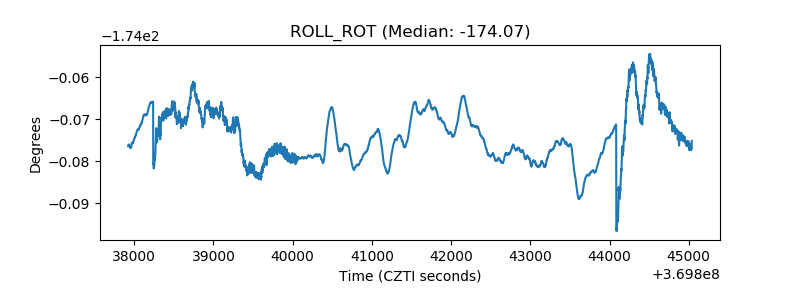 |
| _Roll_DEC | 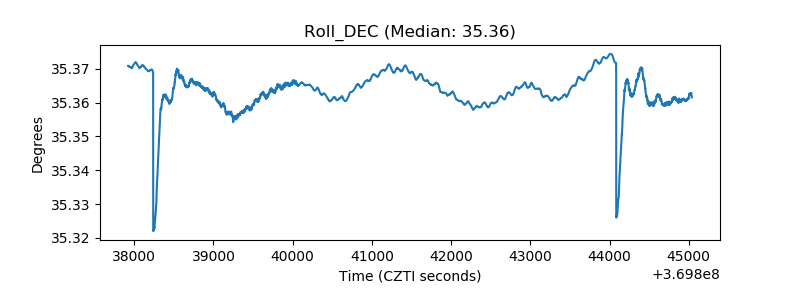 |
| _Roll_RA | 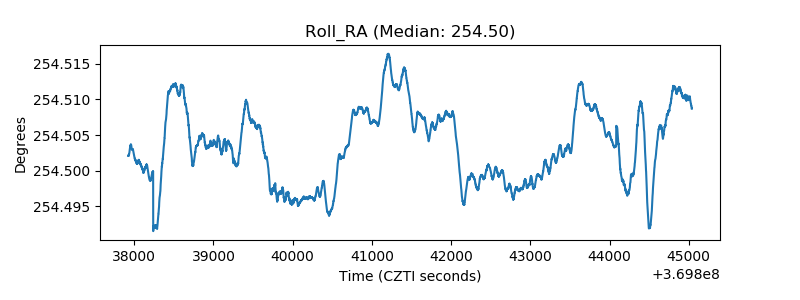 |
| Veto Counter | 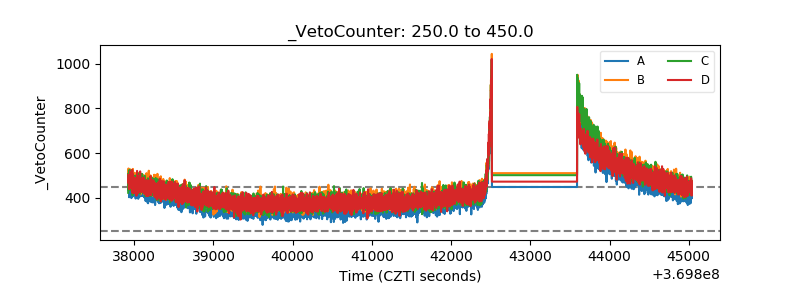 |