| Param | Original file | Final file |
|---|---|---|
| Filename | modeM0/AS1A10_005T01_9000004700_32335cztM0_level2.evt | modeM0/AS1A10_005T01_9000004700_32335cztM0_level2_quad_clean.evt |
| Size (bytes) | 704,229,120 | 89,979,840 |
| Size | 671.6 MB | 85.8 MB |
| Events in quadrant A | 3,161,682 | 633,849 |
| Events in quadrant B | 7,655,609 | 510,840 |
| Events in quadrant C | 3,715,326 | 583,889 |
| Events in quadrant D | 6,373,534 | 559,550 |
| Mode M0 | |||
|---|---|---|---|
| Quadrant | BADHDUFLAG | Total packets | Discarded packets |
| A | 0 | 13424 | 2 |
| B | 0 | 27287 | 1 |
| C | 0 | 15098 | 1 |
| D | 0 | 23498 | 1 |
| Mode M9 | |||
|---|---|---|---|
| Quadrant | BADHDUFLAG | Total packets | Discarded packets |
| A | 0 | 12 | 0 |
| B | 0 | 12 | 0 |
| C | 0 | 12 | 0 |
| D | 0 | 12 | 0 |
| Mode SS | |||
|---|---|---|---|
| Quadrant | BADHDUFLAG | Total packets | Discarded packets |
| A | 0 | 128 | 0 |
| B | 0 | 128 | 0 |
| C | 0 | 128 | 0 |
| D | 0 | 128 | 0 |
| Quadrant | Total seconds | Saturated seconds | Saturation percentage |
|---|---|---|---|
| A | 6241 | 32 | 0.512738% |
| B | 6241 | 1428 | 22.880949% |
| C | 6241 | 281 | 4.502484% |
| D | 6241 | 304 | 4.871014% |
Noise dominated data is calculated using 1-second bins in cleaned event files. If a bin has >2000 counts, and if more than 50% of those come from <1% of pixels, then it is considered to be noise-dominated and hence unusable.
| Quadrant | # 1 sec bins | Bins with >0 counts | Bins with >2000 counts | High rate bins dominated by noise | Noise dominated (total time) | Noise dominated (detector-on time) | Marked lightcurve |
|---|---|---|---|---|---|---|---|
| A | 7441 | 6242 | 1 | 1 | 0.01% | 0.02% | 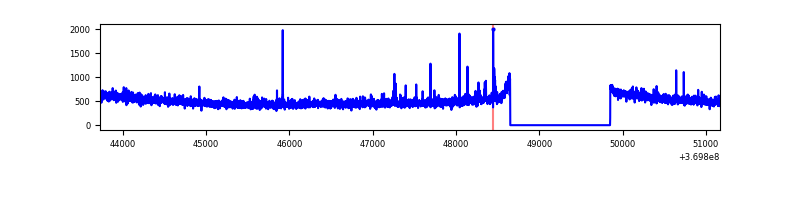 |
| B | 7441 | 6242 | 990 | 990 | 13.30% | 15.86% | 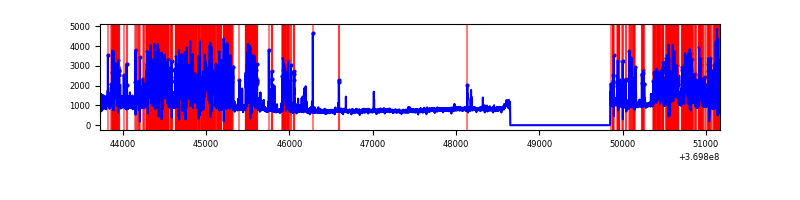 |
| C | 7441 | 6241 | 48 | 48 | 0.65% | 0.77% | 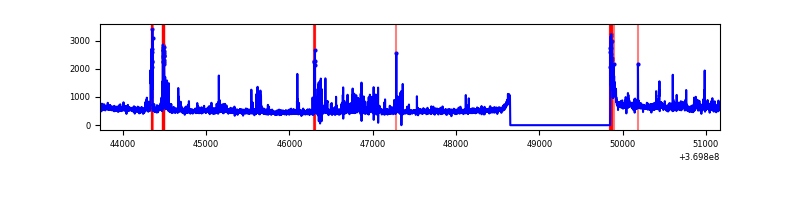 |
| D | 7441 | 6242 | 237 | 237 | 3.19% | 3.80% | 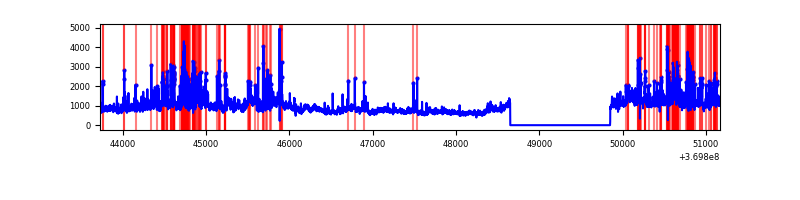 |
Top three noisy pixels from each quadrant. If the there are fewer than three noisy pixels in the level2.evt file, extra rows are filled as -1
| Pixel properties | Quadrant properties | ||||||
|---|---|---|---|---|---|---|---|
| Quadrant | DetID | PixID | Counts | Sigma | Mean | Median | Sigma |
| A | 12 | 189 | 50211 | 312.29 | 794 | 779 | 158.3 |
| A | 13 | 6 | 18067 | 109.22 | 794 | 779 | 158.3 |
| A | 12 | 96 | 16854 | 101.56 | 794 | 779 | 158.3 |
| B | 5 | 172 | 2809810 | 21327.5 | 703 | 687 | 131.7 |
| B | 6 | 159 | 1826973 | 13865.58 | 703 | 687 | 131.7 |
| B | 0 | 190 | 60831 | 456.63 | 703 | 687 | 131.7 |
| C | 14 | 238 | 174155 | 999.51 | 746 | 751 | 173.5 |
| C | 0 | 207 | 127972 | 733.31 | 746 | 751 | 173.5 |
| C | 3 | 233 | 113574 | 650.32 | 746 | 751 | 173.5 |
| D | 8 | 195 | 2429464 | 13477.77 | 756 | 736 | 180.2 |
| D | 12 | 218 | 253408 | 1402.16 | 756 | 736 | 180.2 |
| D | 12 | 233 | 227968 | 1260.98 | 756 | 736 | 180.2 |
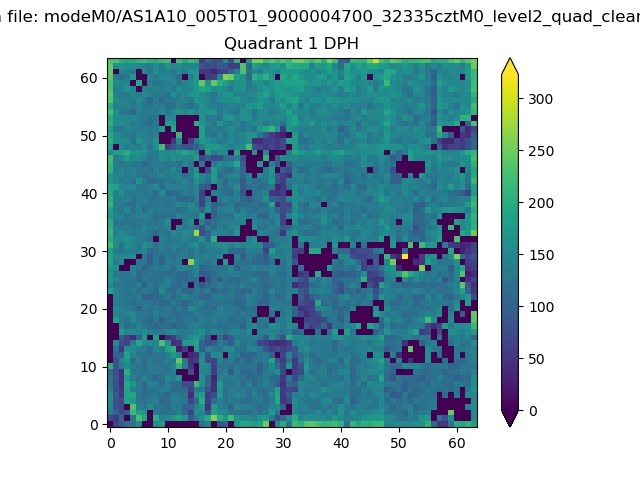
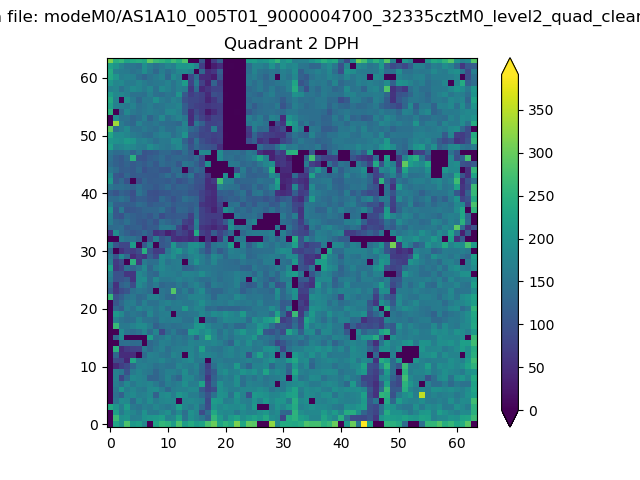
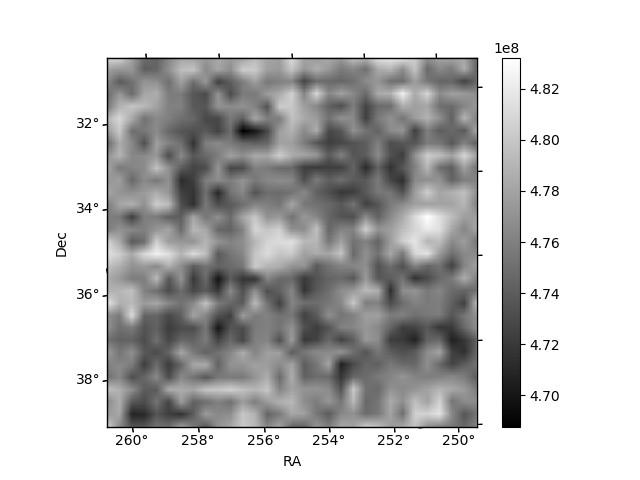
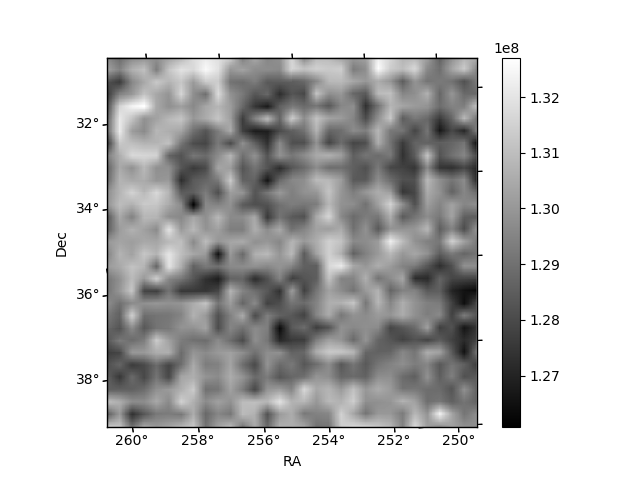
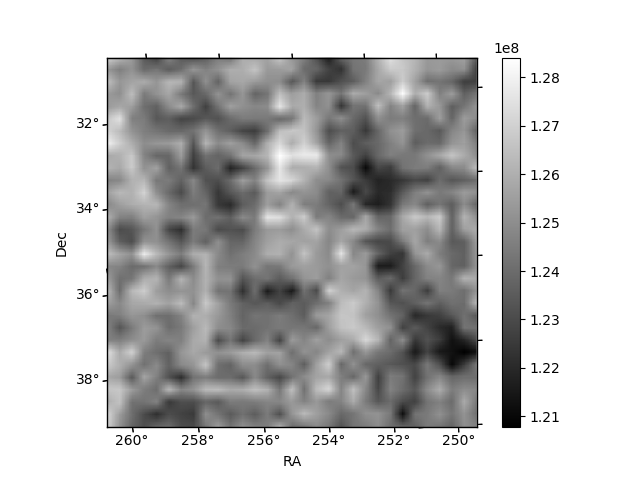
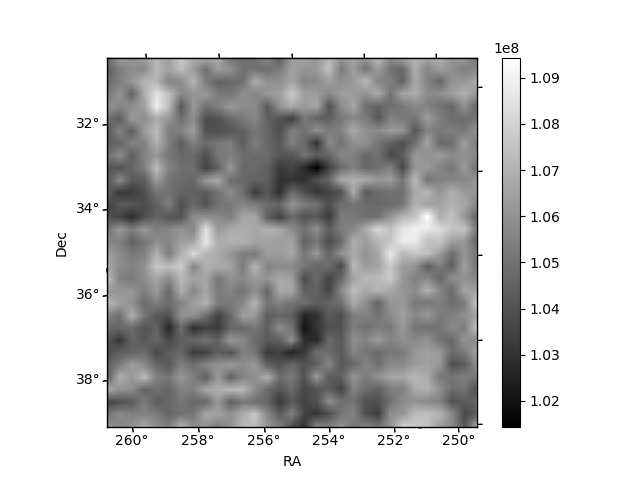
Histogram calculated using DETX and DETY for each event in the final _common_clean file
| Quadrant A |  |
 |
Quadrant B |
|---|---|---|---|
| Quadrant D | 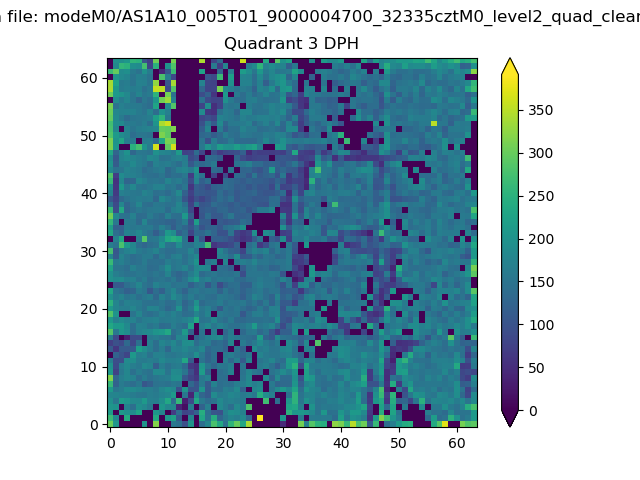 |
 |
Quadrant C |
| Plot type | Count rate plots | Images |
|---|---|---|
| Comparison with Poisson distribution Blue bars denote a histogram of data divided into 1 sec bins. Red curve is a Poisson curve with rate = median count rate of data. |
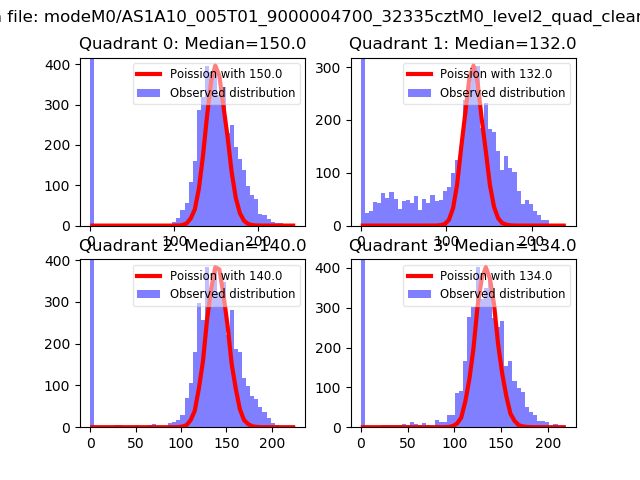 |
 |
| Quadrant-wise count rates Data is divided into 100 sec bins |
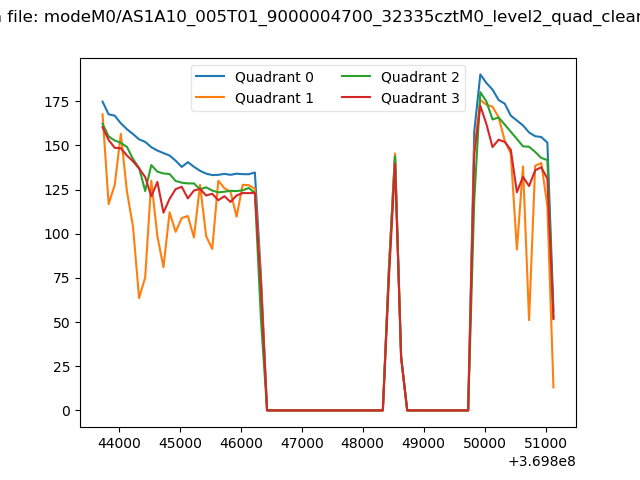 |
|
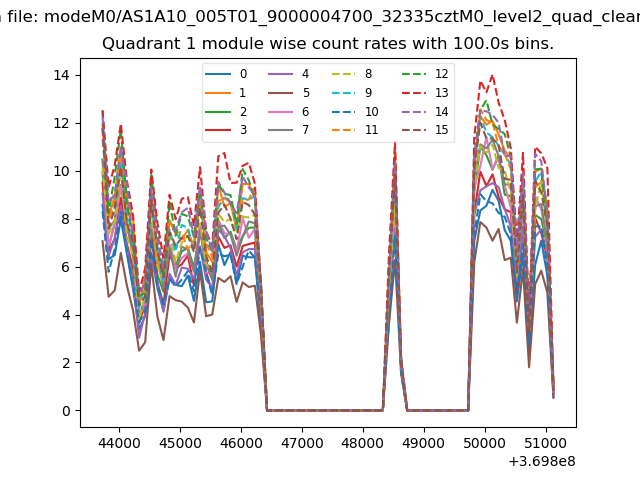
| Module-wise count rates for Quadrant A Data is divided into 100 sec bins |
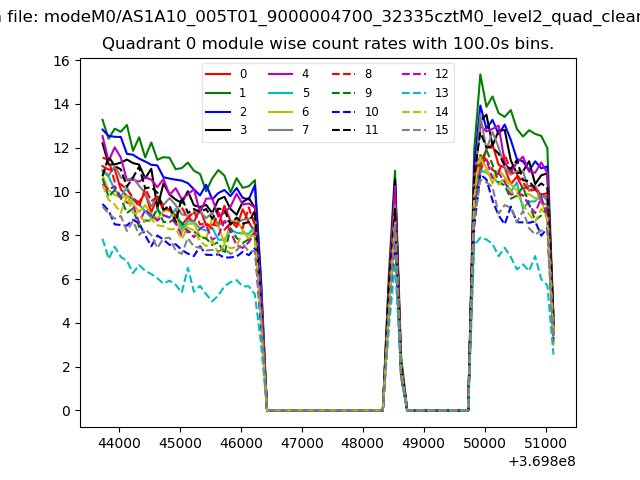 |
 |
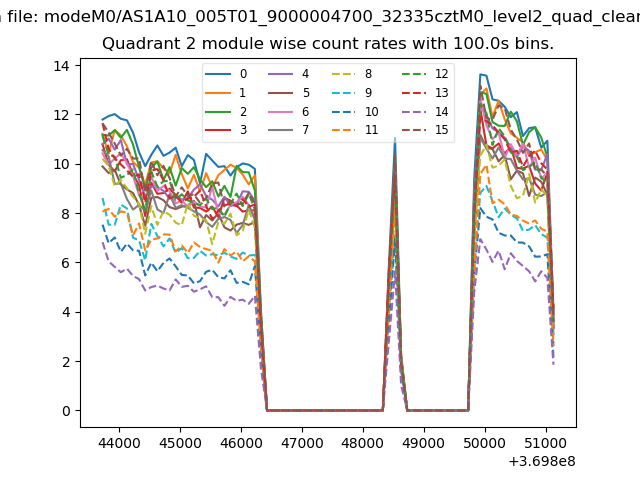
| Module-wise count rates for Quadrant B Data is divided into 100 sec bins |
 |
 |
| Module-wise count rates for Quadrant C Data is divided into 100 sec bins |
 |
 |
| Module-wise count rates for Quadrant D Data is divided into 100 sec bins |
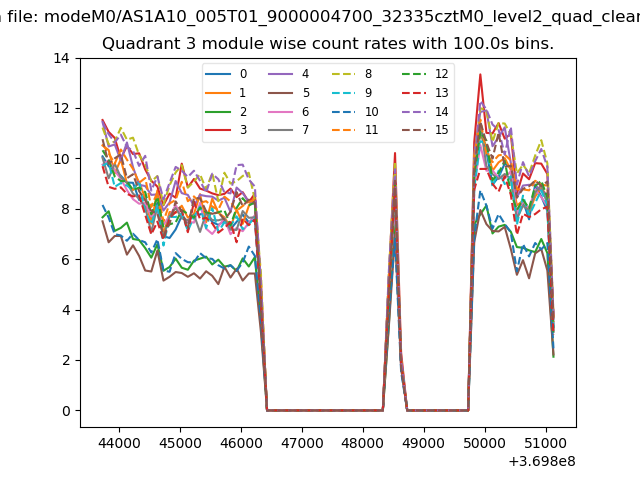 |
 |
| Parameter | Plot |
|---|---|
| CZT HV Monitor | 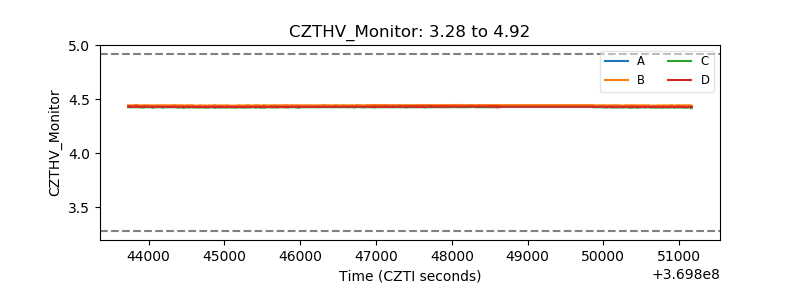 |
| D_VDD | 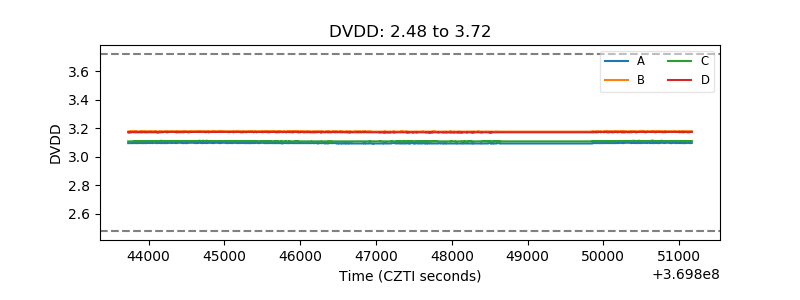 |
| Temperature 1 | 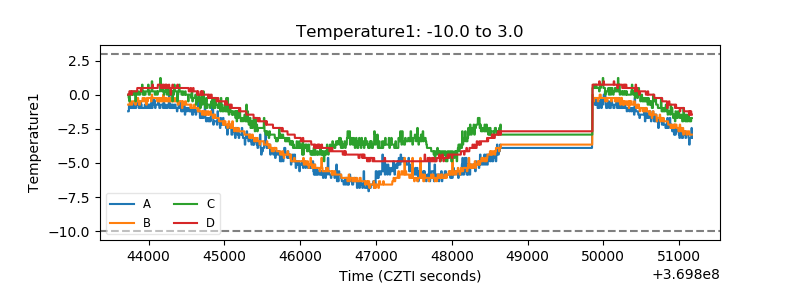 |
| Veto HV Monitor | 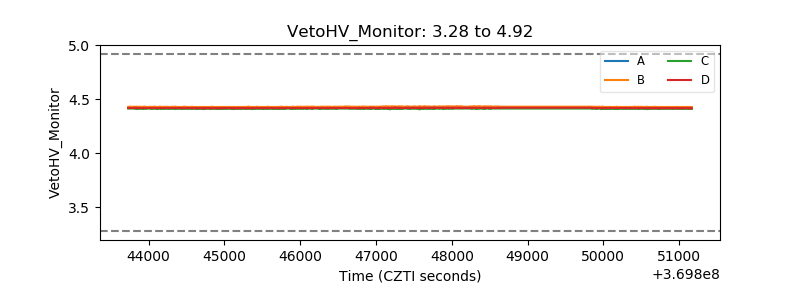 |
| Veto LLD | 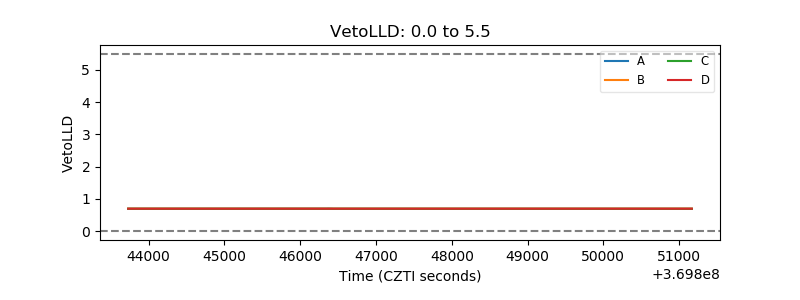 |
| Alpha Counter | 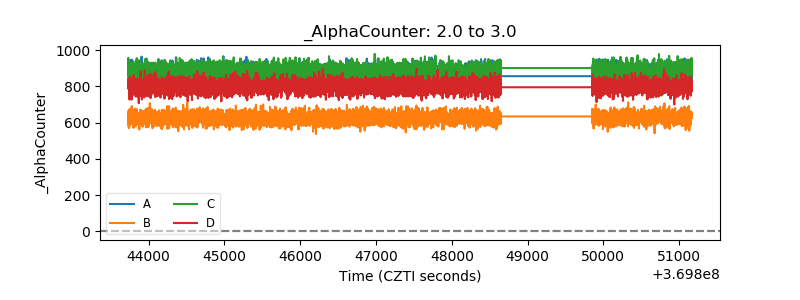 |
| _CPM_Rate | 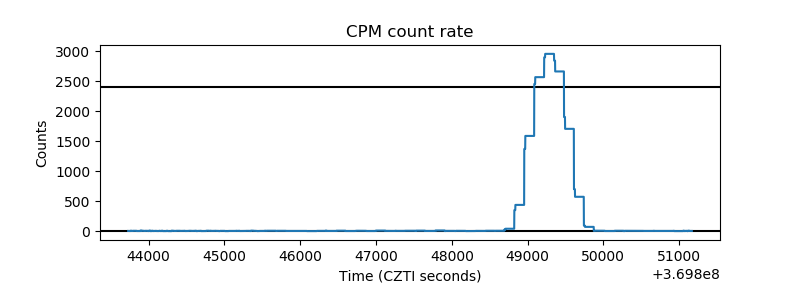 |
| CZT Counter | 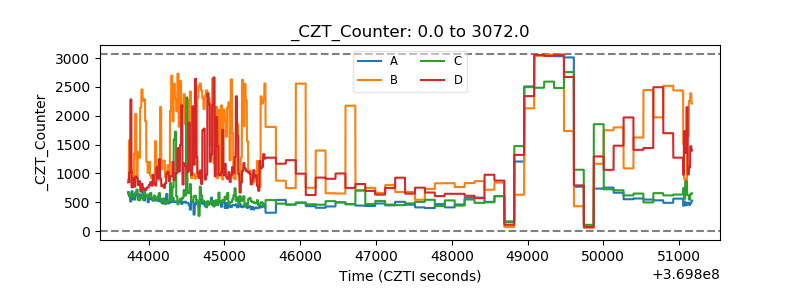 |
| +2.5 Volts monitor |  |
| +5 Volts monitor |  |
| _ROLL_ROT | 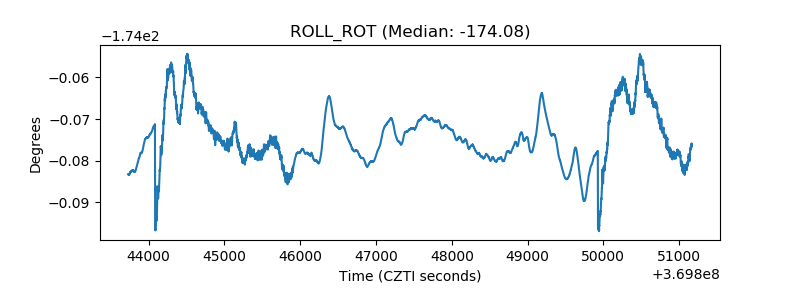 |
| _Roll_DEC | 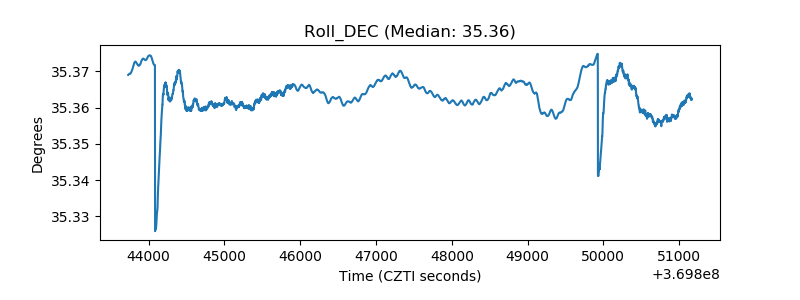 |
| _Roll_RA | 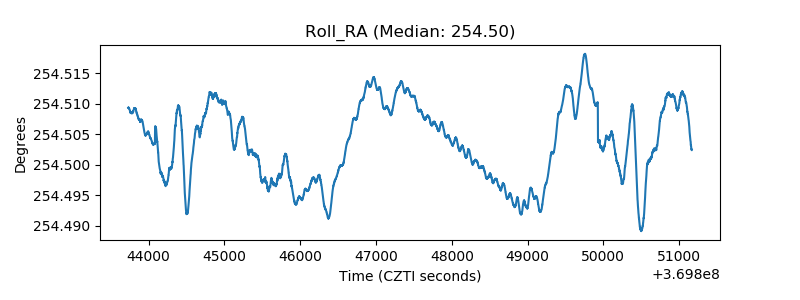 |
| Veto Counter | 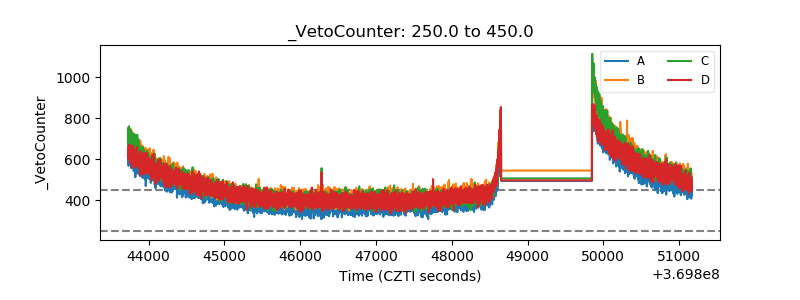 |