| Param | Original file | Final file |
|---|---|---|
| Filename | modeM0/AS1A10_005T01_9000004700_32338cztM0_level2.evt | modeM0/AS1A10_005T01_9000004700_32338cztM0_level2_quad_clean.evt |
| Size (bytes) | 675,685,440 | 93,551,040 |
| Size | 644.4 MB | 89.2 MB |
| Events in quadrant A | 3,210,098 | 639,500 |
| Events in quadrant B | 5,883,335 | 612,276 |
| Events in quadrant C | 4,862,915 | 570,714 |
| Events in quadrant D | 6,082,086 | 570,694 |
| Mode M0 | |||
|---|---|---|---|
| Quadrant | BADHDUFLAG | Total packets | Discarded packets |
| A | 0 | 13360 | 3 |
| B | 0 | 22005 | 2 |
| C | 0 | 18492 | 2 |
| D | 0 | 22780 | 2 |
| Mode M9 | |||
|---|---|---|---|
| Quadrant | BADHDUFLAG | Total packets | Discarded packets |
| A | 0 | 16 | 0 |
| B | 0 | 16 | 0 |
| C | 0 | 16 | 0 |
| D | 0 | 17 | 0 |
| Mode SS | |||
|---|---|---|---|
| Quadrant | BADHDUFLAG | Total packets | Discarded packets |
| A | 0 | 128 | 0 |
| B | 0 | 128 | 0 |
| C | 0 | 128 | 0 |
| D | 0 | 128 | 0 |
| Quadrant | Total seconds | Saturated seconds | Saturation percentage |
|---|---|---|---|
| A | 6295 | 37 | 0.587768% |
| B | 6295 | 484 | 7.688642% |
| C | 6295 | 630 | 10.007943% |
| D | 6295 | 266 | 4.225576% |
Noise dominated data is calculated using 1-second bins in cleaned event files. If a bin has >2000 counts, and if more than 50% of those come from <1% of pixels, then it is considered to be noise-dominated and hence unusable.
| Quadrant | # 1 sec bins | Bins with >0 counts | Bins with >2000 counts | High rate bins dominated by noise | Noise dominated (total time) | Noise dominated (detector-on time) | Marked lightcurve |
|---|---|---|---|---|---|---|---|
| A | 7585 | 6296 | 0 | 0 | 0.00% | 0.00% | 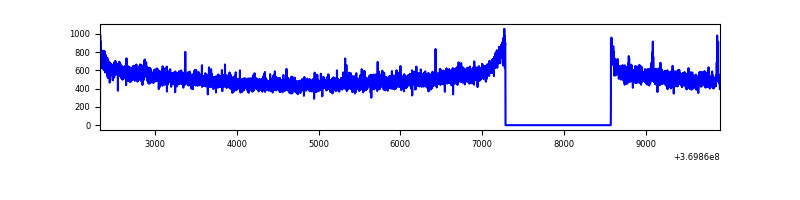 |
| B | 7585 | 6296 | 215 | 215 | 2.83% | 3.41% | 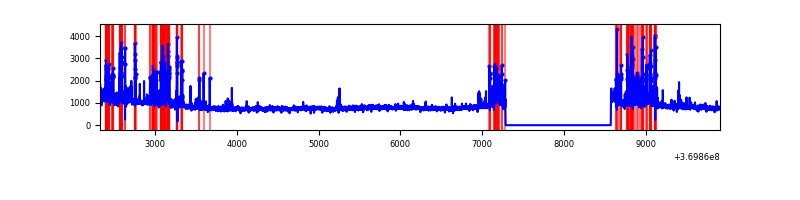 |
| C | 7585 | 6296 | 419 | 419 | 5.52% | 6.66% | 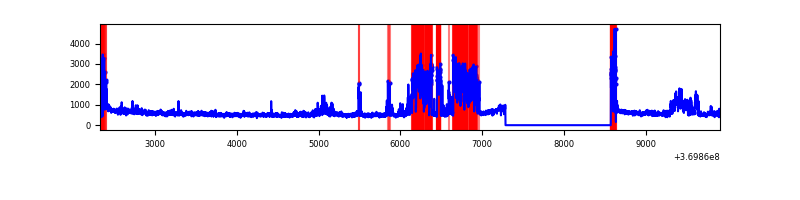 |
| D | 7585 | 6296 | 171 | 171 | 2.25% | 2.72% | 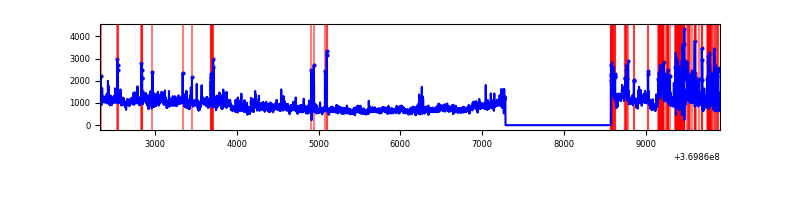 |
Top three noisy pixels from each quadrant. If the there are fewer than three noisy pixels in the level2.evt file, extra rows are filled as -1
| Pixel properties | Quadrant properties | ||||||
|---|---|---|---|---|---|---|---|
| Quadrant | DetID | PixID | Counts | Sigma | Mean | Median | Sigma |
| A | 12 | 189 | 22298 | 132.27 | 821 | 809 | 162.5 |
| A | 13 | 6 | 16649 | 97.5 | 821 | 809 | 162.5 |
| A | 13 | 254 | 12457 | 71.7 | 821 | 809 | 162.5 |
| B | 6 | 159 | 1859156 | 12526.68 | 798 | 779 | 148.4 |
| B | 5 | 172 | 729471 | 4911.86 | 798 | 779 | 148.4 |
| B | 0 | 190 | 67018 | 446.49 | 798 | 779 | 148.4 |
| C | 0 | 10 | 1418938 | 7976.4 | 764 | 771 | 177.8 |
| C | 3 | 233 | 198839 | 1114.02 | 764 | 771 | 177.8 |
| C | 14 | 238 | 123106 | 688.07 | 764 | 771 | 177.8 |
| D | 8 | 195 | 1954189 | 10421.61 | 783 | 761 | 187.4 |
| D | 11 | 164 | 400998 | 2135.28 | 783 | 761 | 187.4 |
| D | 7 | 38 | 221262 | 1176.38 | 783 | 761 | 187.4 |
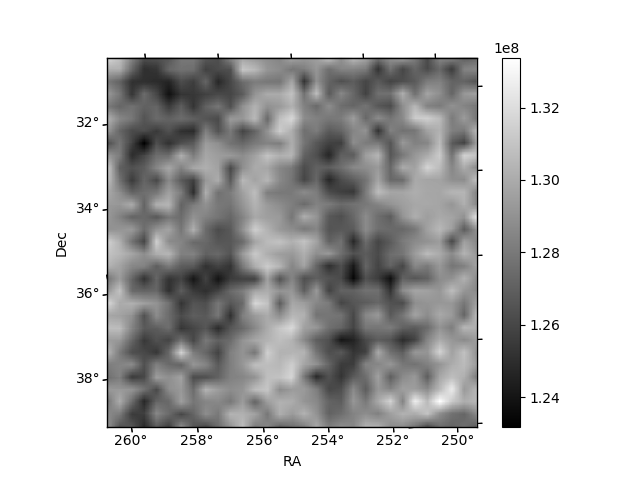
Histogram calculated using DETX and DETY for each event in the final _common_clean file
| Quadrant A | 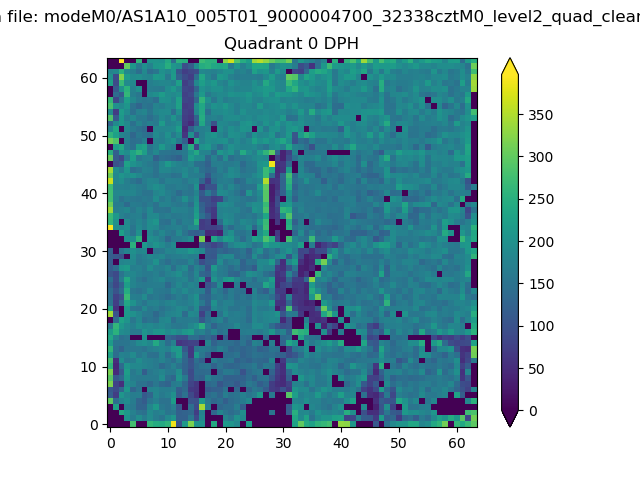 |
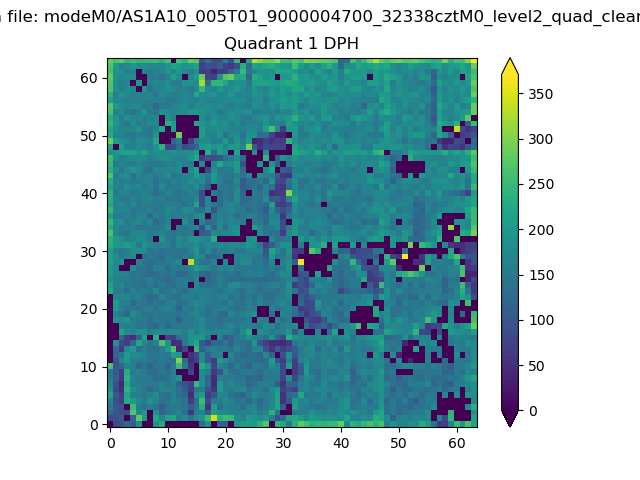 |
Quadrant B |
|---|---|---|---|
| Quadrant D | 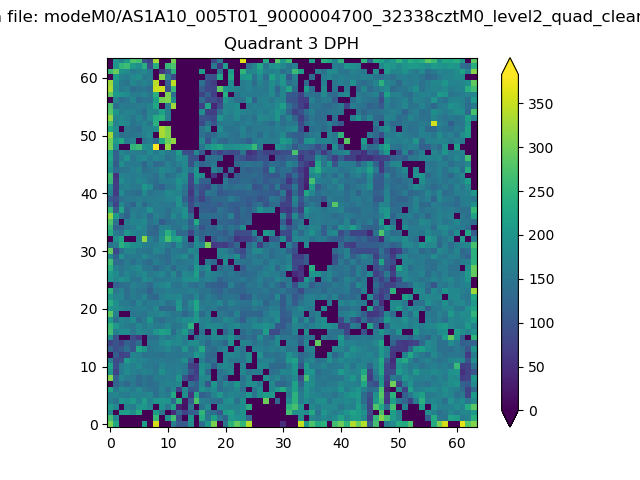 |
 |
Quadrant C |
| Plot type | Count rate plots | Images |
|---|---|---|
| Comparison with Poisson distribution Blue bars denote a histogram of data divided into 1 sec bins. Red curve is a Poisson curve with rate = median count rate of data. |
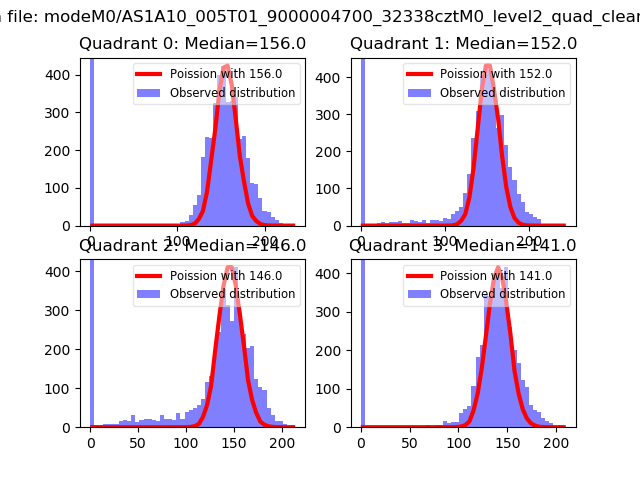 |
 |
| Quadrant-wise count rates Data is divided into 100 sec bins |
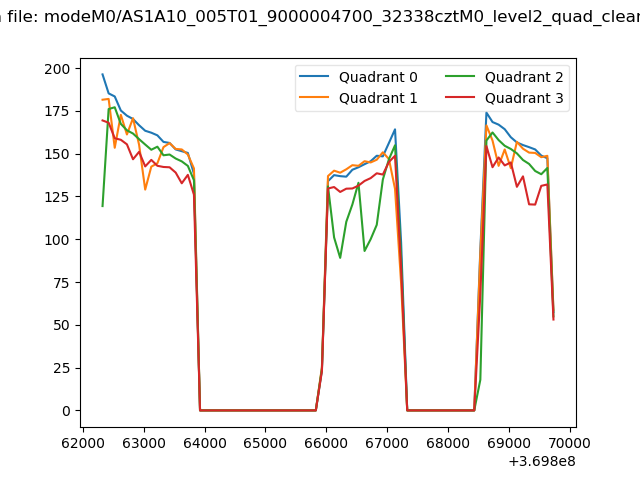 |
|
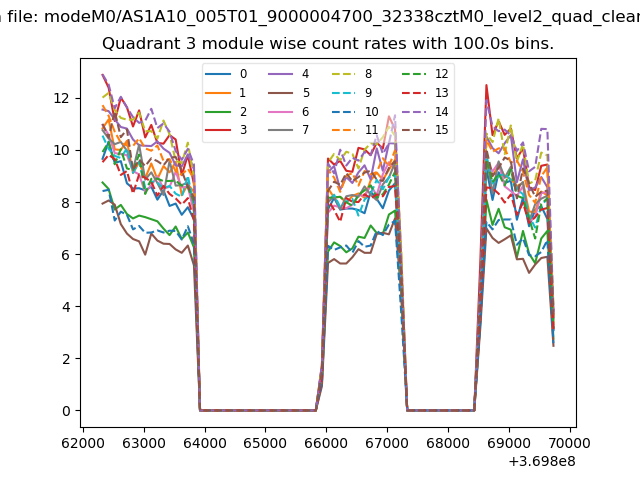
| Module-wise count rates for Quadrant A Data is divided into 100 sec bins |
 |
 |
| Module-wise count rates for Quadrant B Data is divided into 100 sec bins |
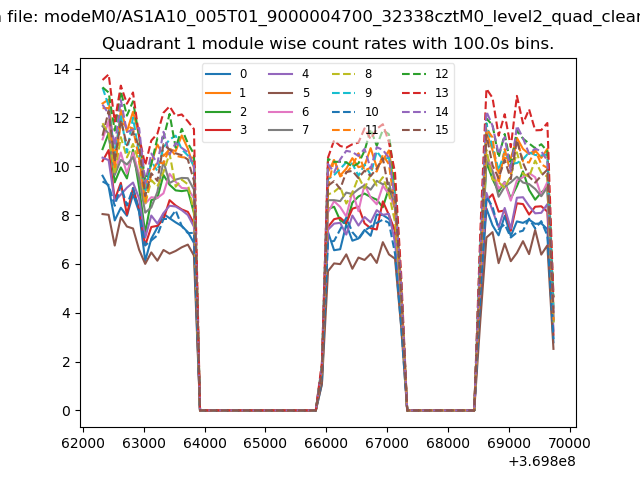 |
 |
| Module-wise count rates for Quadrant C Data is divided into 100 sec bins |
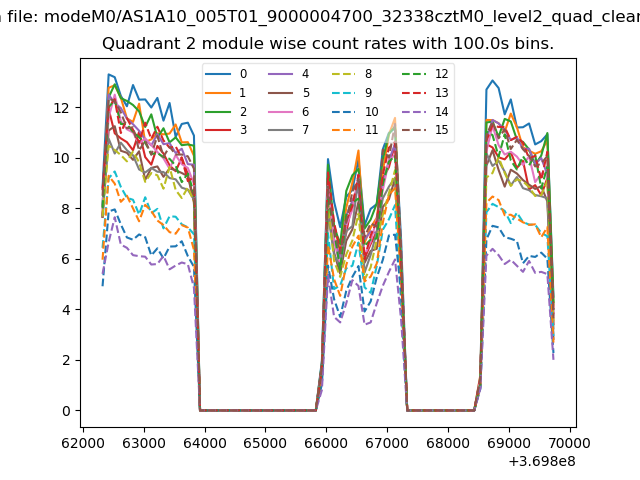 |
 |
| Module-wise count rates for Quadrant D Data is divided into 100 sec bins |
 |
 |
| Parameter | Plot |
|---|---|
| CZT HV Monitor | 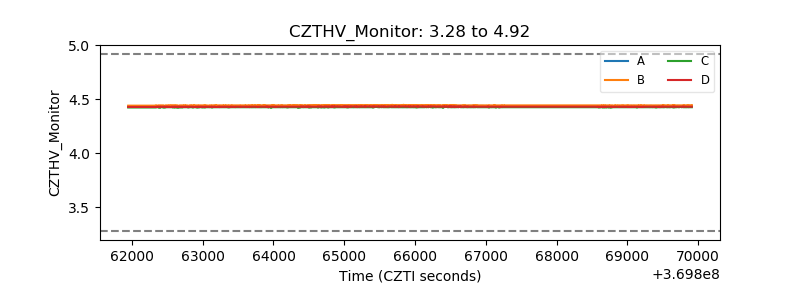 |
| D_VDD | 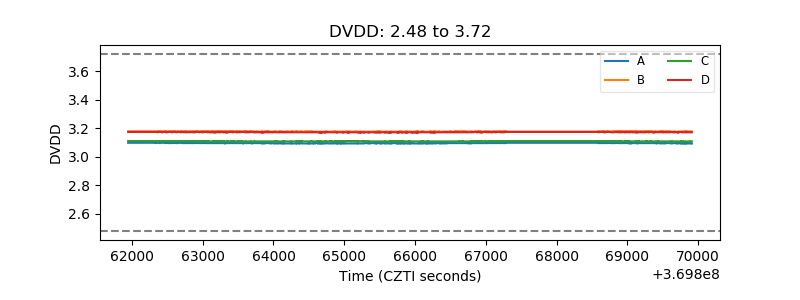 |
| Temperature 1 | 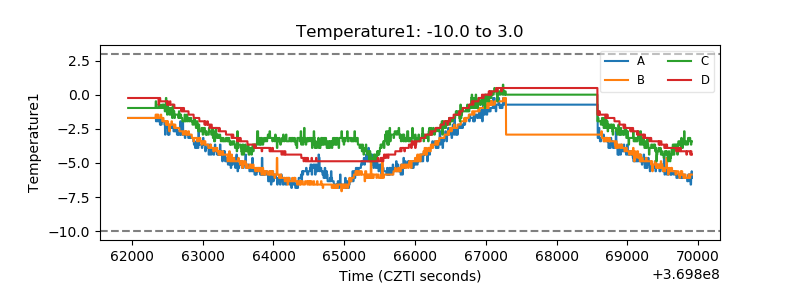 |
| Veto HV Monitor | 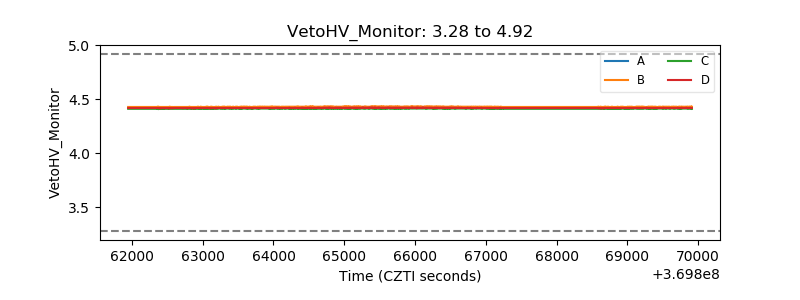 |
| Veto LLD | 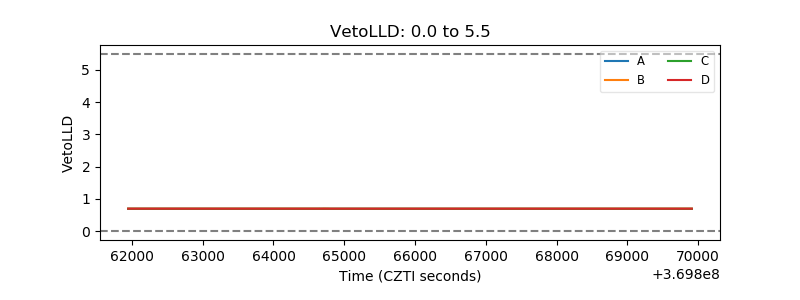 |
| Alpha Counter | 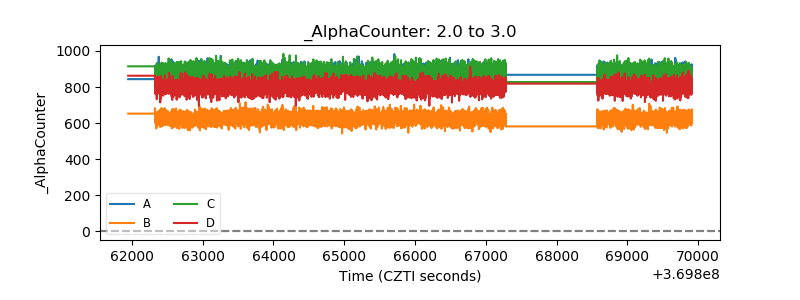 |
| _CPM_Rate | 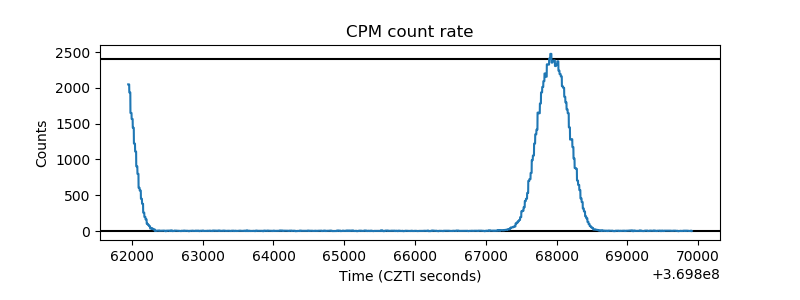 |
| CZT Counter |  |
| +2.5 Volts monitor |  |
| +5 Volts monitor |  |
| _ROLL_ROT | 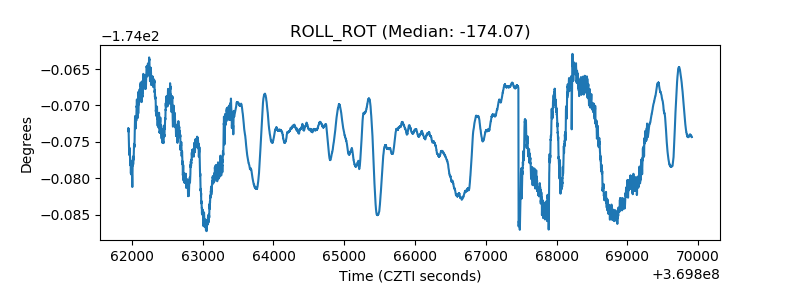 |
| _Roll_DEC | 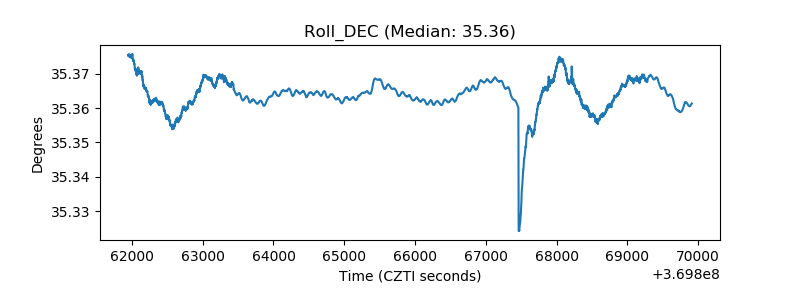 |
| _Roll_RA |  |
| Veto Counter | 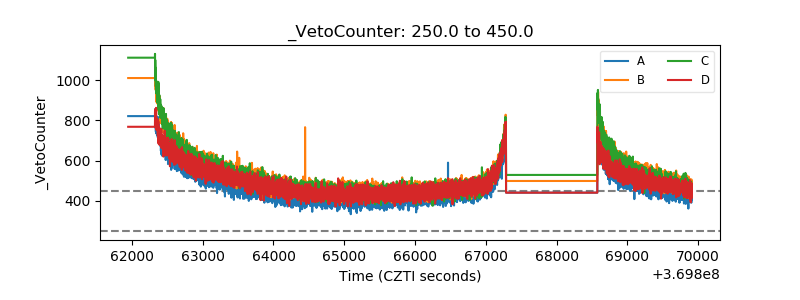 |