| Param | Original file | Final file |
|---|---|---|
| Filename | modeM0/AS1A10_005T01_9000004700_32339cztM0_level2.evt | modeM0/AS1A10_005T01_9000004700_32339cztM0_level2_quad_clean.evt |
| Size (bytes) | 627,592,320 | 80,994,240 |
| Size | 598.5 MB | 77.2 MB |
| Events in quadrant A | 3,102,711 | 531,437 |
| Events in quadrant B | 5,515,740 | 508,583 |
| Events in quadrant C | 3,617,782 | 501,049 |
| Events in quadrant D | 6,345,407 | 472,105 |
| Mode M0 | |||
|---|---|---|---|
| Quadrant | BADHDUFLAG | Total packets | Discarded packets |
| A | 0 | 13061 | 2 |
| B | 0 | 20934 | 1 |
| C | 0 | 14630 | 1 |
| D | 0 | 23559 | 1 |
| Mode M9 | |||
|---|---|---|---|
| Quadrant | BADHDUFLAG | Total packets | Discarded packets |
| A | 0 | 12 | 0 |
| B | 0 | 12 | 0 |
| C | 0 | 12 | 0 |
| D | 0 | 12 | 0 |
| Mode SS | |||
|---|---|---|---|
| Quadrant | BADHDUFLAG | Total packets | Discarded packets |
| A | 0 | 128 | 0 |
| B | 0 | 128 | 0 |
| C | 0 | 128 | 0 |
| D | 0 | 128 | 0 |
| Quadrant | Total seconds | Saturated seconds | Saturation percentage |
|---|---|---|---|
| A | 6293 | 18 | 0.286032% |
| B | 6293 | 331 | 5.259812% |
| C | 6293 | 124 | 1.970443% |
| D | 6293 | 354 | 5.625298% |
Noise dominated data is calculated using 1-second bins in cleaned event files. If a bin has >2000 counts, and if more than 50% of those come from <1% of pixels, then it is considered to be noise-dominated and hence unusable.
| Quadrant | # 1 sec bins | Bins with >0 counts | Bins with >2000 counts | High rate bins dominated by noise | Noise dominated (total time) | Noise dominated (detector-on time) | Marked lightcurve |
|---|---|---|---|---|---|---|---|
| A | 7488 | 6294 | 0 | 0 | 0.00% | 0.00% | 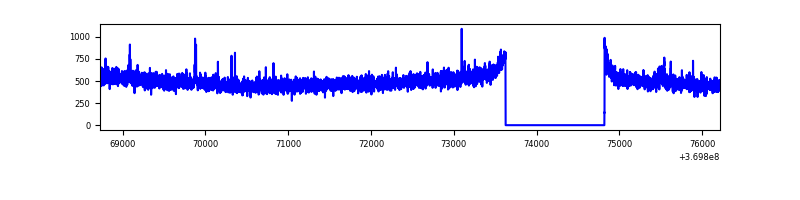 |
| B | 7488 | 6294 | 139 | 139 | 1.86% | 2.21% | 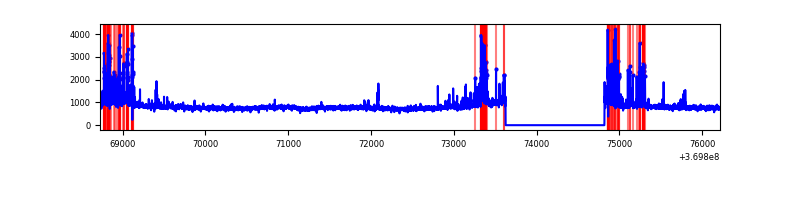 |
| C | 7488 | 6294 | 16 | 16 | 0.21% | 0.25% | 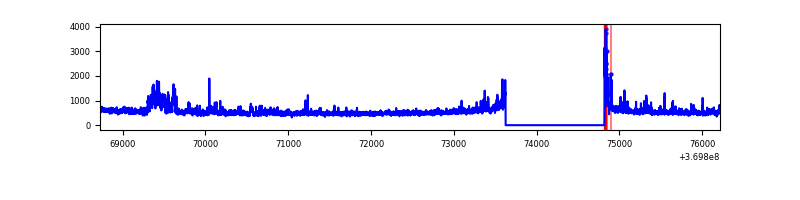 |
| D | 7488 | 6294 | 236 | 236 | 3.15% | 3.75% | 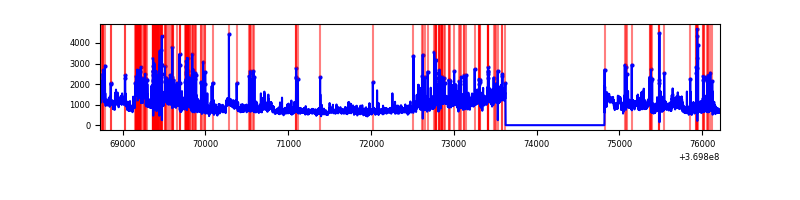 |
Top three noisy pixels from each quadrant. If the there are fewer than three noisy pixels in the level2.evt file, extra rows are filled as -1
| Pixel properties | Quadrant properties | ||||||
|---|---|---|---|---|---|---|---|
| Quadrant | DetID | PixID | Counts | Sigma | Mean | Median | Sigma |
| A | 12 | 189 | 44663 | 280.71 | 787 | 772 | 156.4 |
| A | 13 | 6 | 14707 | 89.12 | 787 | 772 | 156.4 |
| A | 13 | 254 | 12389 | 74.3 | 787 | 772 | 156.4 |
| B | 6 | 159 | 1789150 | 12317.76 | 771 | 751 | 145.2 |
| B | 5 | 172 | 517079 | 3556.26 | 771 | 751 | 145.2 |
| B | 0 | 190 | 96974 | 662.74 | 771 | 751 | 145.2 |
| C | 3 | 233 | 359110 | 2012.15 | 757 | 762 | 178.1 |
| C | 14 | 238 | 120995 | 675.12 | 757 | 762 | 178.1 |
| C | 14 | 67 | 69015 | 383.25 | 757 | 762 | 178.1 |
| D | 8 | 195 | 1946250 | 10915.78 | 748 | 728 | 178.2 |
| D | 11 | 164 | 453051 | 2537.86 | 748 | 728 | 178.2 |
| D | 12 | 3 | 445422 | 2495.05 | 748 | 728 | 178.2 |
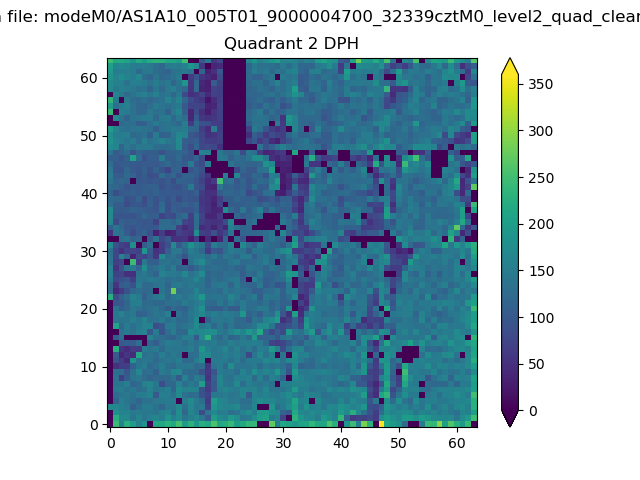
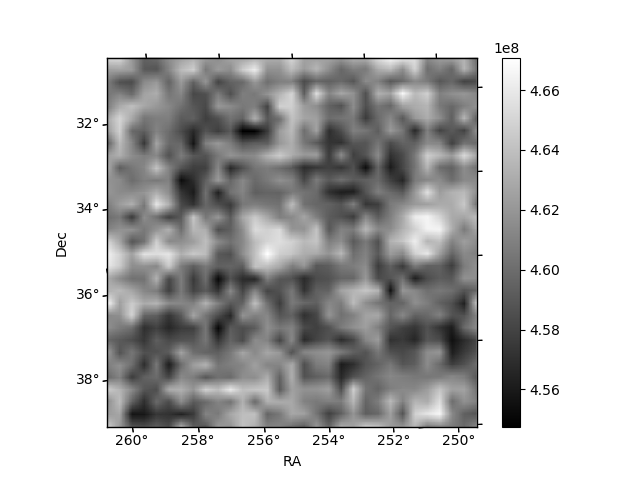
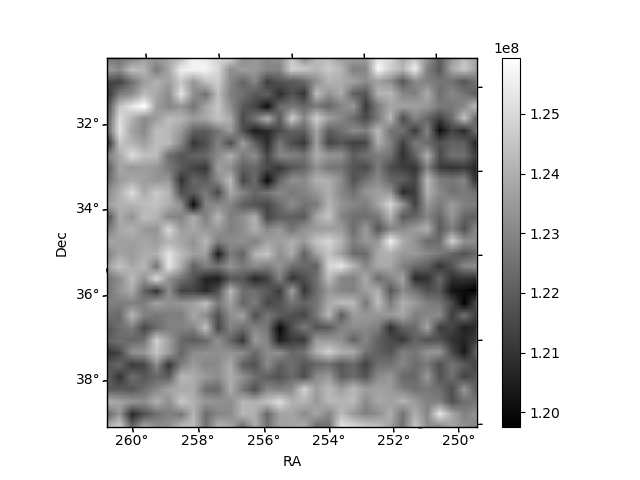
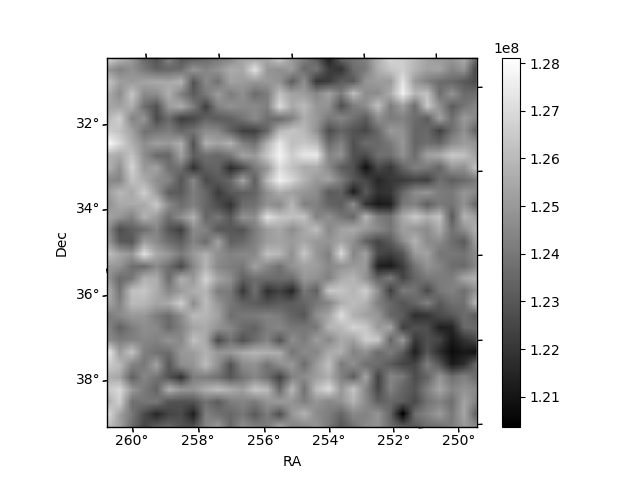
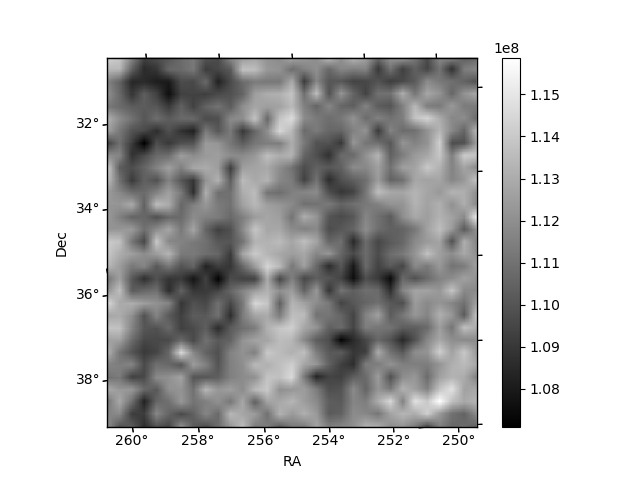
Histogram calculated using DETX and DETY for each event in the final _common_clean file
| Quadrant A | 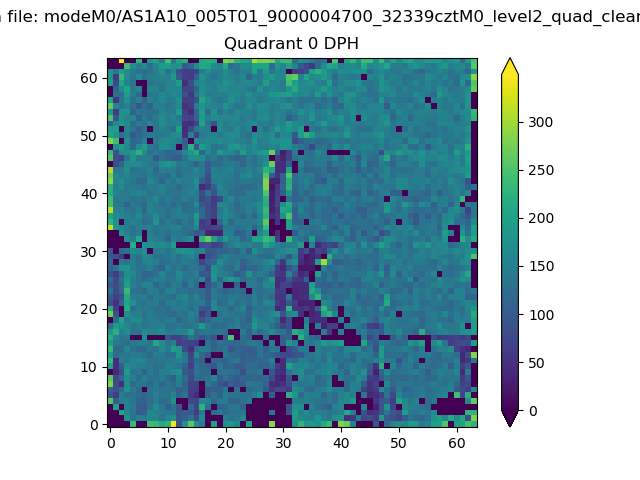 |
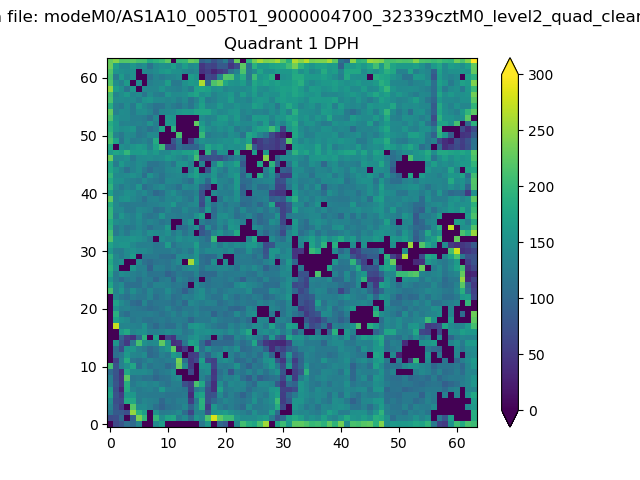 |
Quadrant B |
|---|---|---|---|
| Quadrant D | 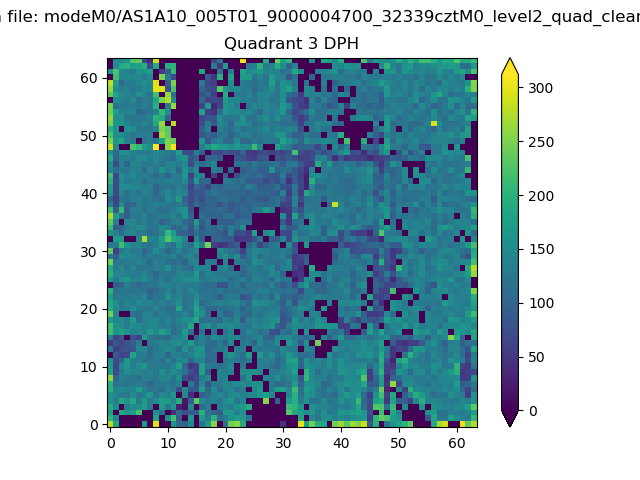 |
 |
Quadrant C |
| Plot type | Count rate plots | Images |
|---|---|---|
| Comparison with Poisson distribution Blue bars denote a histogram of data divided into 1 sec bins. Red curve is a Poisson curve with rate = median count rate of data. |
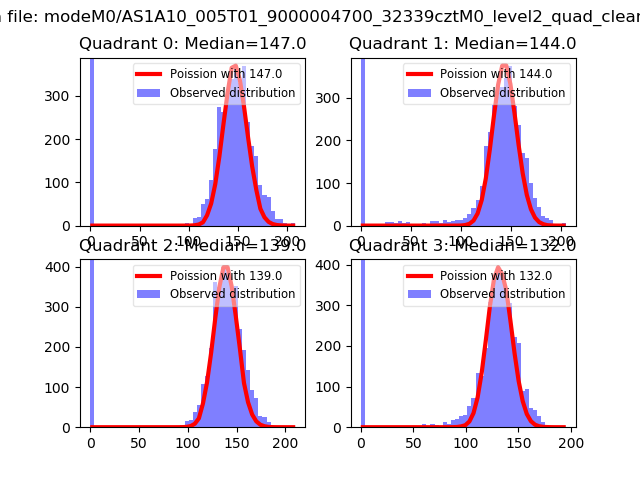 |
 |
| Quadrant-wise count rates Data is divided into 100 sec bins |
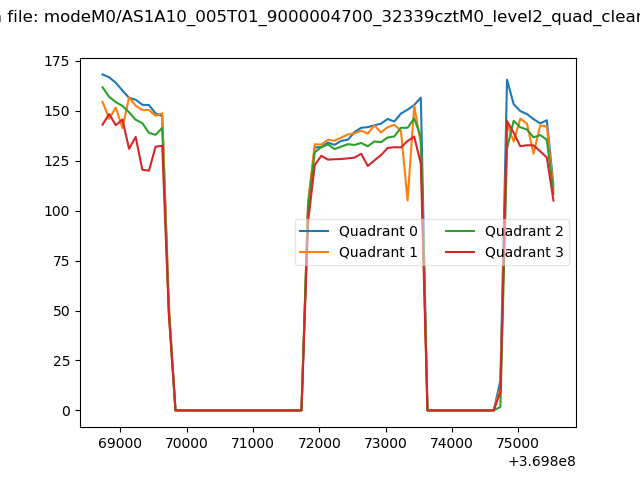 |
|
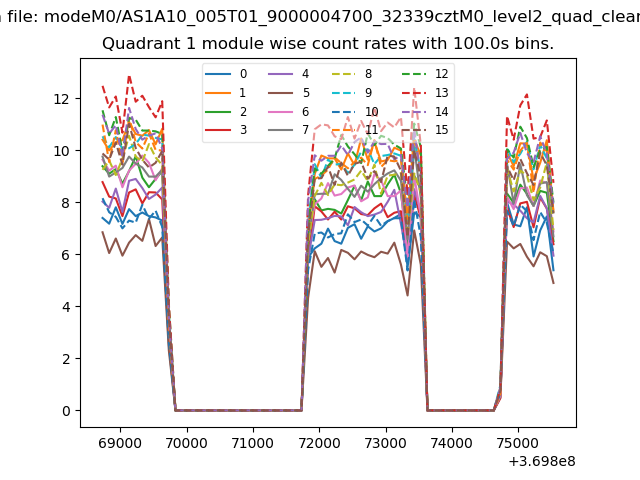
| Module-wise count rates for Quadrant A Data is divided into 100 sec bins |
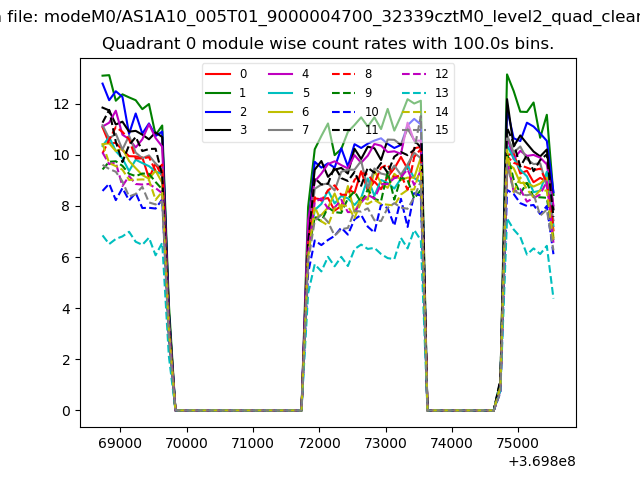 |
 |
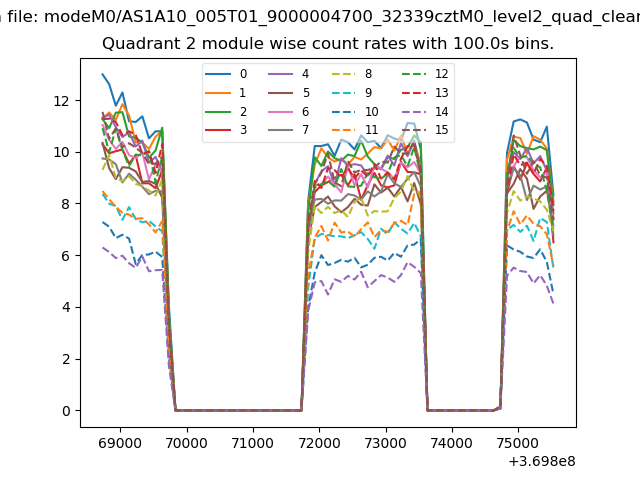
| Module-wise count rates for Quadrant B Data is divided into 100 sec bins |
 |
 |
| Module-wise count rates for Quadrant C Data is divided into 100 sec bins |
 |
 |
| Module-wise count rates for Quadrant D Data is divided into 100 sec bins |
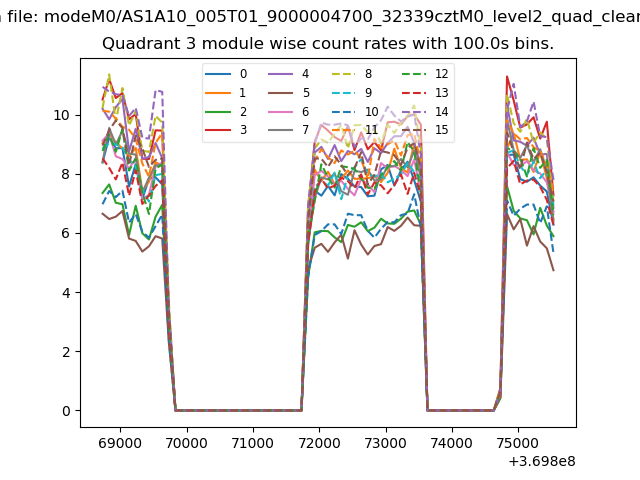 |
 |
| Parameter | Plot |
|---|---|
| CZT HV Monitor | 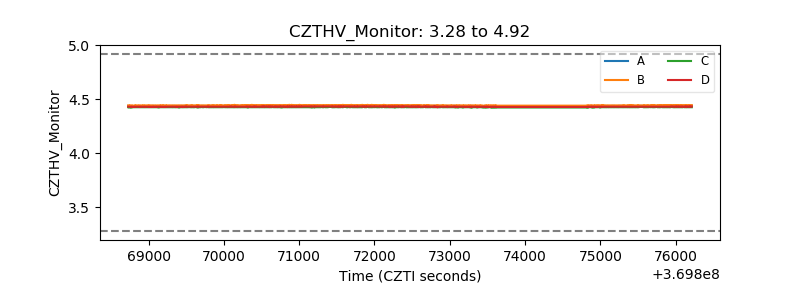 |
| D_VDD | 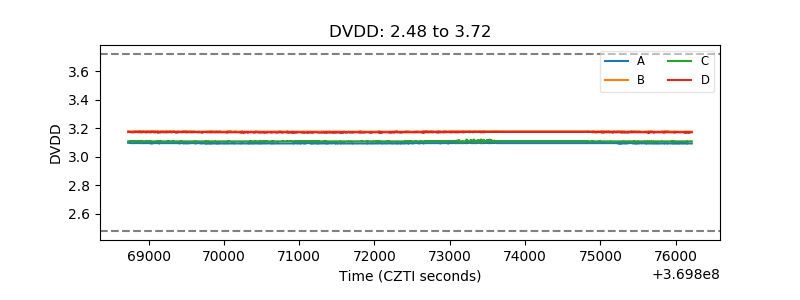 |
| Temperature 1 | 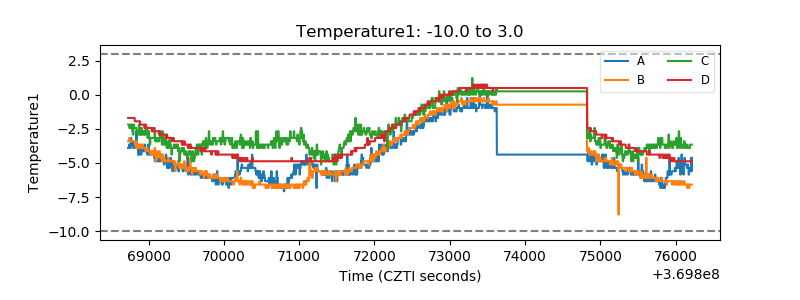 |
| Veto HV Monitor | 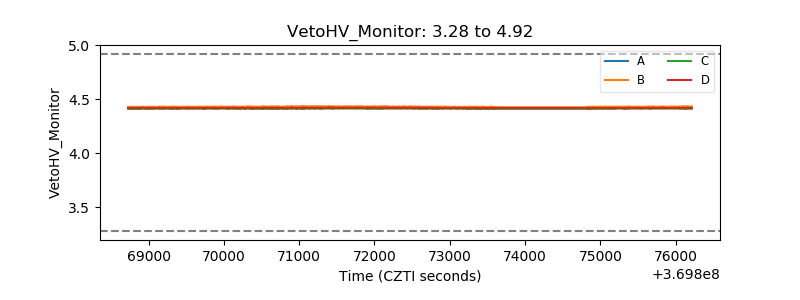 |
| Veto LLD | 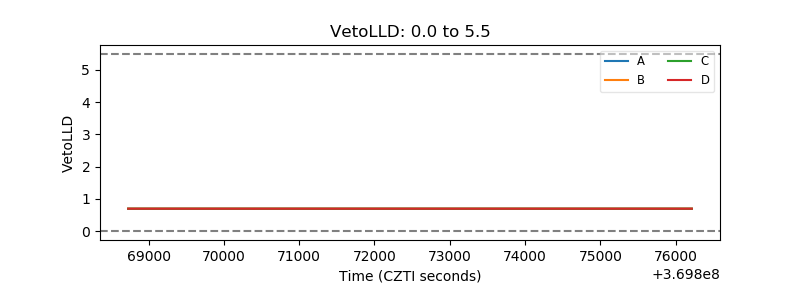 |
| Alpha Counter | 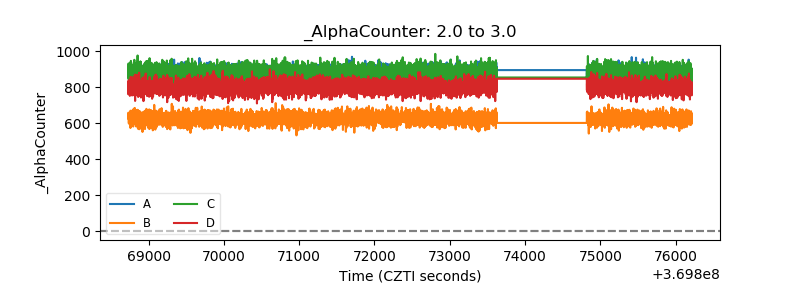 |
| _CPM_Rate | 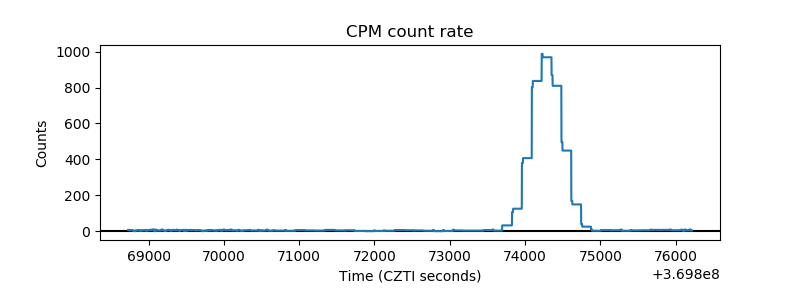 |
| CZT Counter | 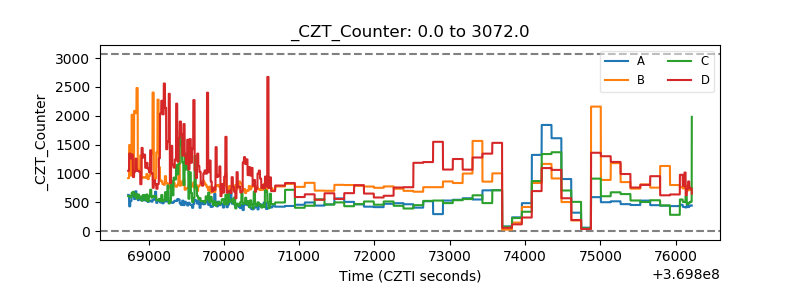 |
| +2.5 Volts monitor | 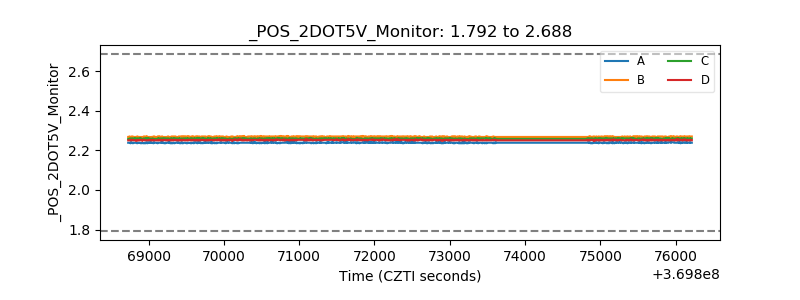 |
| +5 Volts monitor |  |
| _ROLL_ROT | 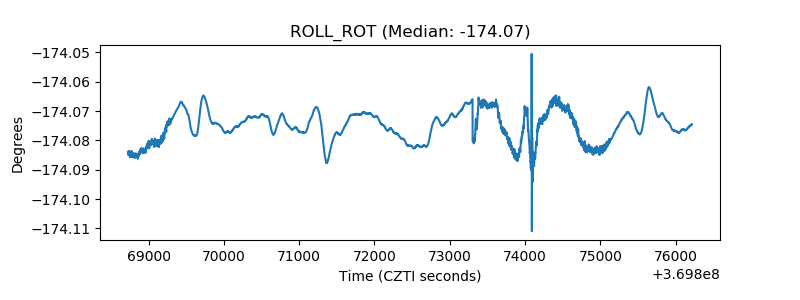 |
| _Roll_DEC | 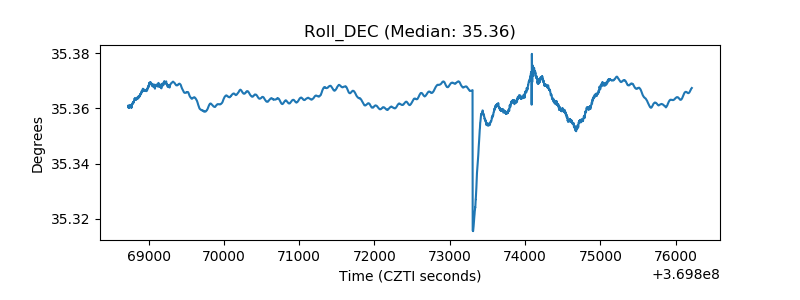 |
| _Roll_RA | 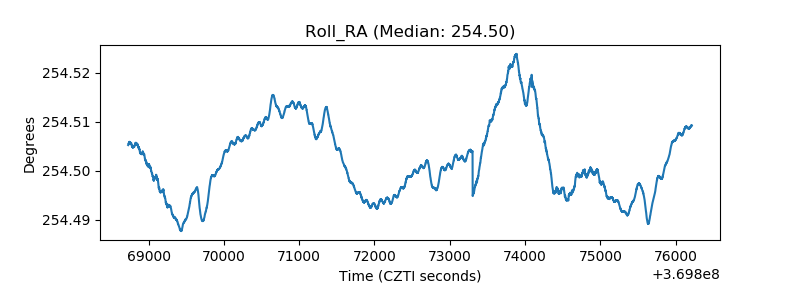 |
| Veto Counter | 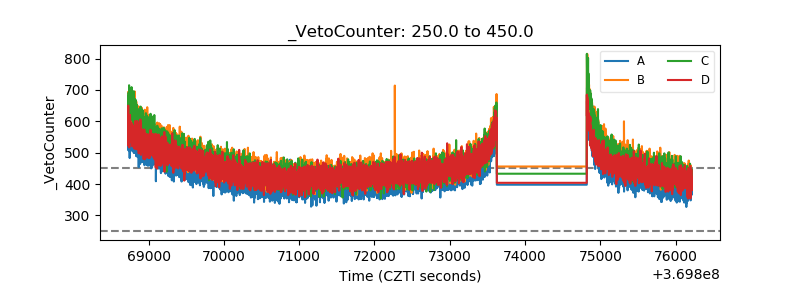 |