| Param | Original file | Final file |
|---|---|---|
| Filename | modeM0/AS1A10_005T01_9000004700_32341cztM0_level2.evt | modeM0/AS1A10_005T01_9000004700_32341cztM0_level2_quad_clean.evt |
| Size (bytes) | 650,796,480 | 71,058,240 |
| Size | 620.6 MB | 67.8 MB |
| Events in quadrant A | 3,288,500 | 440,912 |
| Events in quadrant B | 6,130,364 | 408,675 |
| Events in quadrant C | 3,584,673 | 415,994 |
| Events in quadrant D | 6,235,484 | 400,716 |
| Mode M0 | |||
|---|---|---|---|
| Quadrant | BADHDUFLAG | Total packets | Discarded packets |
| A | 0 | 14297 | 1 |
| B | 0 | 23381 | 0 |
| C | 0 | 14951 | 0 |
| D | 0 | 23602 | 0 |
| Mode M9 | |||
|---|---|---|---|
| Quadrant | BADHDUFLAG | Total packets | Discarded packets |
| A | 0 | 5 | 0 |
| B | 0 | 5 | 0 |
| C | 0 | 5 | 0 |
| D | 0 | 5 | 0 |
| Mode SS | |||
|---|---|---|---|
| Quadrant | BADHDUFLAG | Total packets | Discarded packets |
| A | 0 | 140 | 0 |
| B | 0 | 140 | 0 |
| C | 0 | 140 | 0 |
| D | 0 | 140 | 0 |
| Quadrant | Total seconds | Saturated seconds | Saturation percentage |
|---|---|---|---|
| A | 6965 | 83 | 1.191673% |
| B | 6965 | 508 | 7.293611% |
| C | 6965 | 157 | 2.254128% |
| D | 6965 | 193 | 2.770998% |
Noise dominated data is calculated using 1-second bins in cleaned event files. If a bin has >2000 counts, and if more than 50% of those come from <1% of pixels, then it is considered to be noise-dominated and hence unusable.
| Quadrant | # 1 sec bins | Bins with >0 counts | Bins with >2000 counts | High rate bins dominated by noise | Noise dominated (total time) | Noise dominated (detector-on time) | Marked lightcurve |
|---|---|---|---|---|---|---|---|
| A | 7420 | 6966 | 0 | 0 | 0.00% | 0.00% | 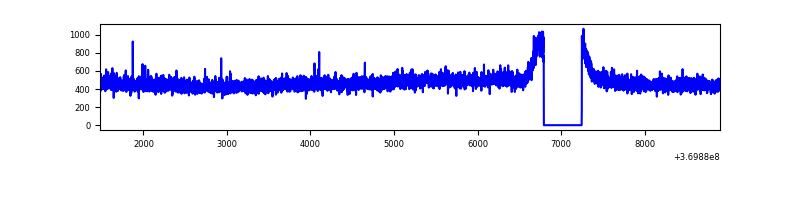 |
| B | 7420 | 6966 | 264 | 264 | 3.56% | 3.79% | 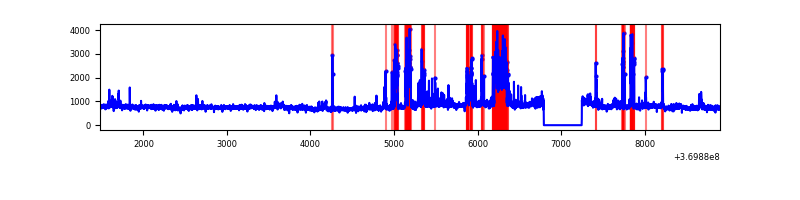 |
| C | 7420 | 6966 | 3 | 3 | 0.04% | 0.04% | 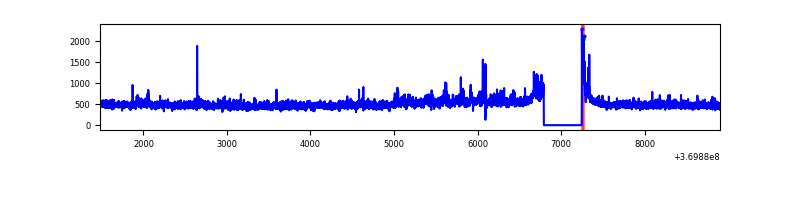 |
| D | 7420 | 6966 | 98 | 98 | 1.32% | 1.41% | 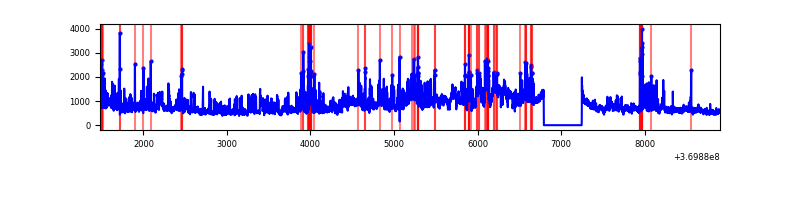 |
Top three noisy pixels from each quadrant. If the there are fewer than three noisy pixels in the level2.evt file, extra rows are filled as -1
| Pixel properties | Quadrant properties | ||||||
|---|---|---|---|---|---|---|---|
| Quadrant | DetID | PixID | Counts | Sigma | Mean | Median | Sigma |
| A | 12 | 189 | 17626 | 98.77 | 843 | 824 | 170.1 |
| A | 13 | 6 | 14424 | 79.95 | 843 | 824 | 170.1 |
| A | 13 | 254 | 13335 | 73.54 | 843 | 824 | 170.1 |
| B | 6 | 159 | 1945183 | 12261.27 | 815 | 792 | 158.6 |
| B | 5 | 172 | 596004 | 3753.39 | 815 | 792 | 158.6 |
| B | 10 | 245 | 249630 | 1569.17 | 815 | 792 | 158.6 |
| C | 14 | 238 | 134763 | 702.72 | 808 | 812 | 190.6 |
| C | 14 | 67 | 112375 | 585.27 | 808 | 812 | 190.6 |
| C | 3 | 233 | 65966 | 341.8 | 808 | 812 | 190.6 |
| D | 8 | 195 | 1910488 | 9901.91 | 809 | 788 | 192.9 |
| D | 11 | 164 | 681442 | 3529.23 | 809 | 788 | 192.9 |
| D | 14 | 52 | 218852 | 1130.68 | 809 | 788 | 192.9 |
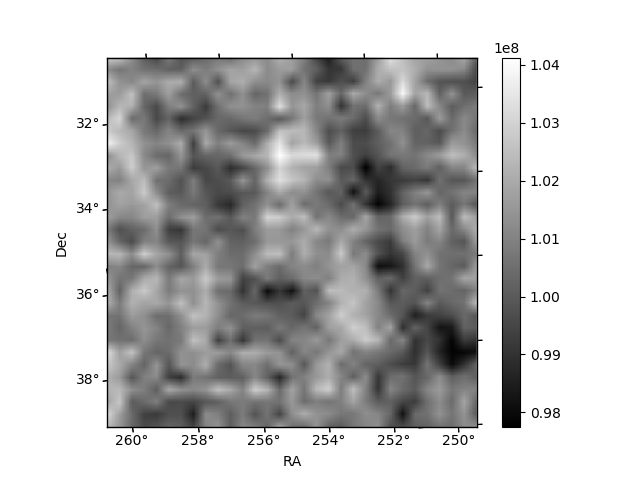
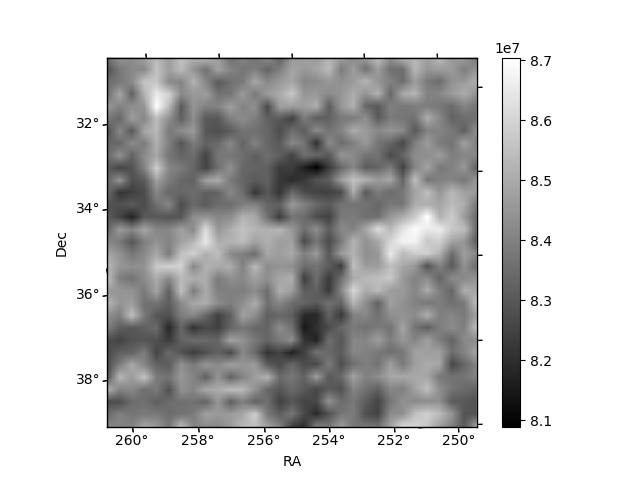
Histogram calculated using DETX and DETY for each event in the final _common_clean file
| Quadrant A | 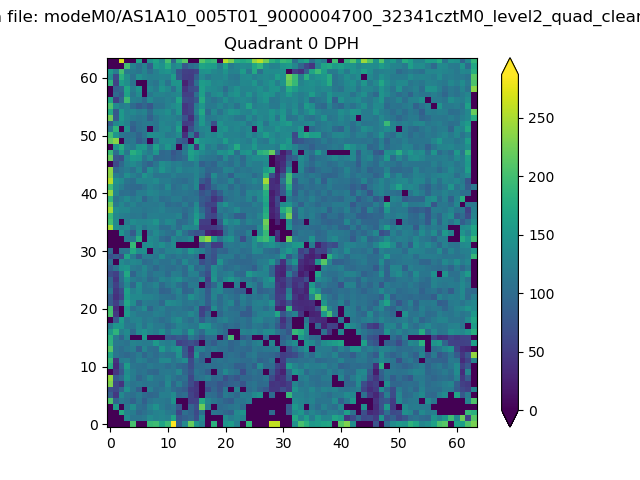 |
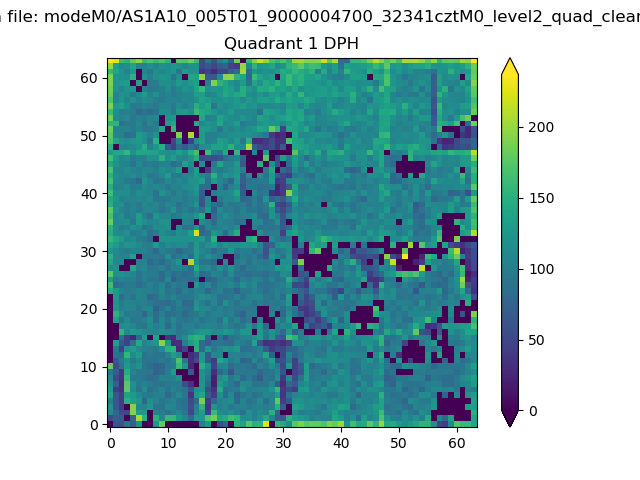 |
Quadrant B |
|---|---|---|---|
| Quadrant D | 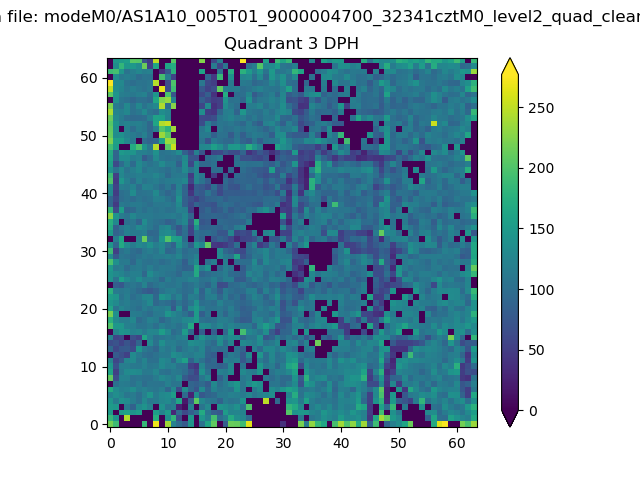 |
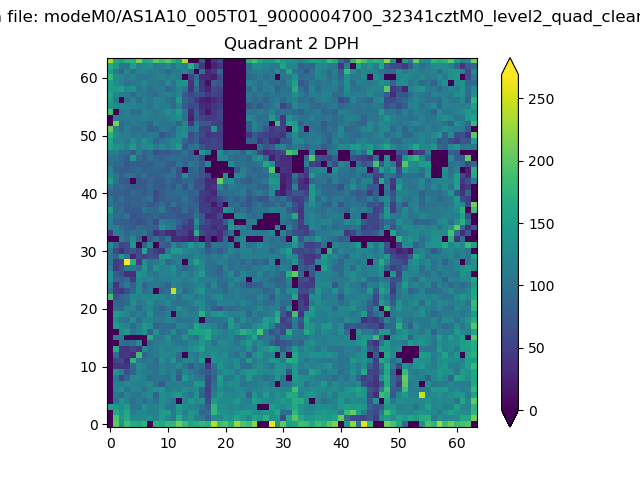 |
Quadrant C |
| Plot type | Count rate plots | Images |
|---|---|---|
| Comparison with Poisson distribution Blue bars denote a histogram of data divided into 1 sec bins. Red curve is a Poisson curve with rate = median count rate of data. |
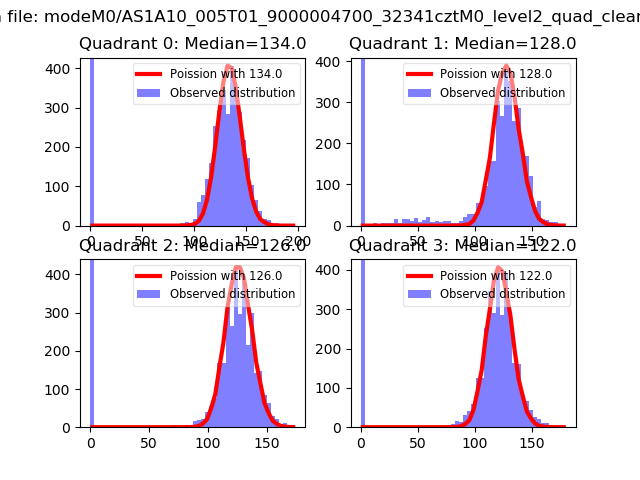 |
 |
| Quadrant-wise count rates Data is divided into 100 sec bins |
 |
|
| Module-wise count rates for Quadrant A Data is divided into 100 sec bins |
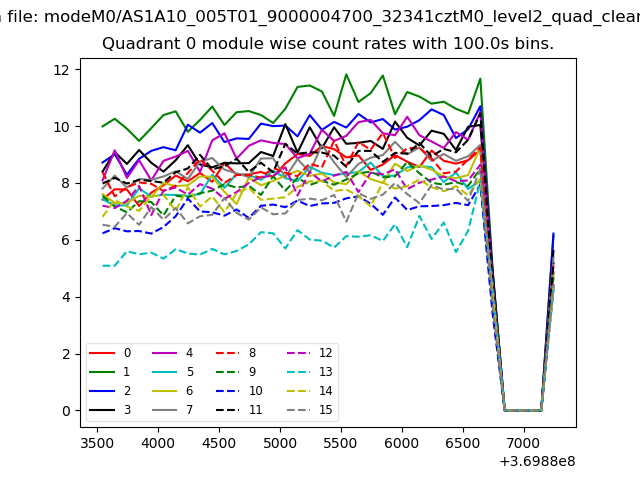 |
 |
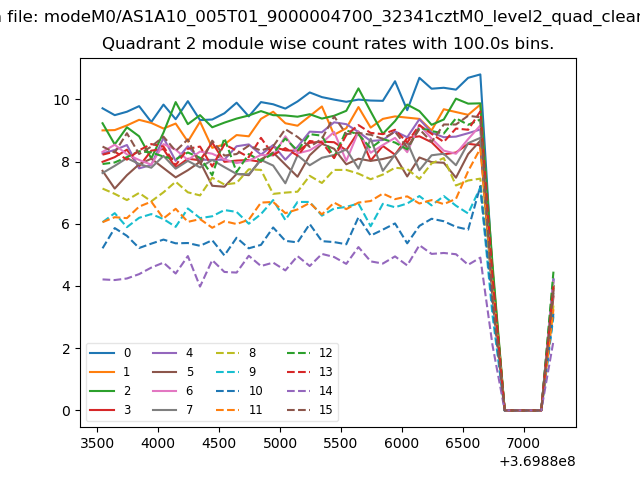
| Module-wise count rates for Quadrant B Data is divided into 100 sec bins |
 |
 |
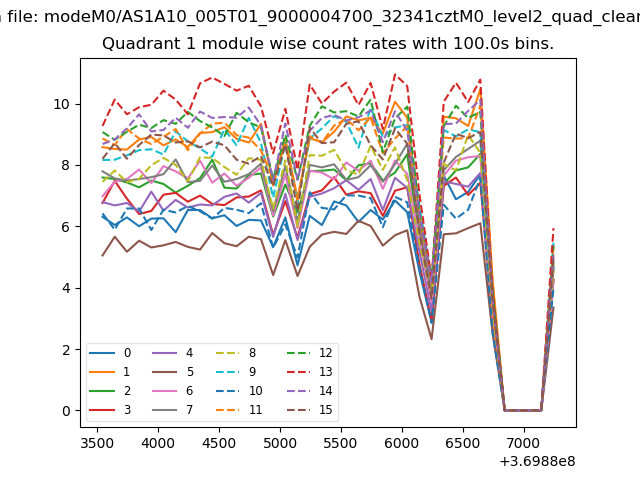
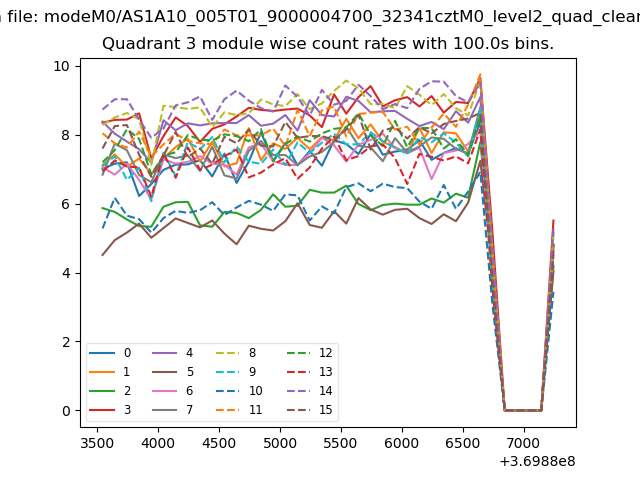
| Module-wise count rates for Quadrant C Data is divided into 100 sec bins |
 |
 |
| Module-wise count rates for Quadrant D Data is divided into 100 sec bins |
 |
 |
| Parameter | Plot |
|---|---|
| CZT HV Monitor | 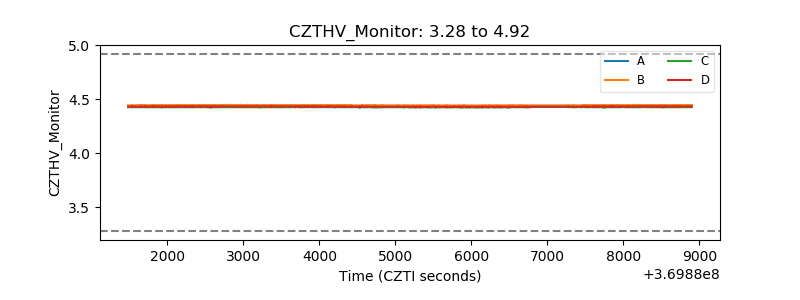 |
| D_VDD | 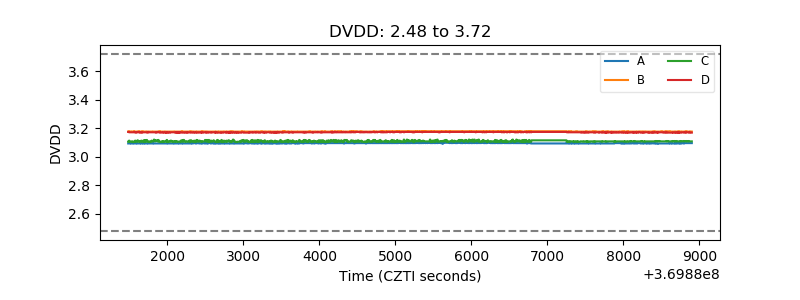 |
| Temperature 1 | 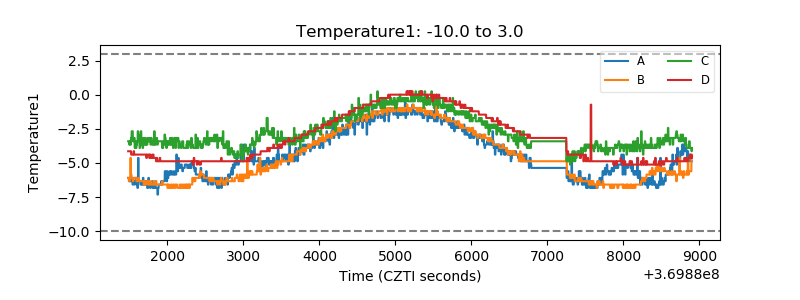 |
| Veto HV Monitor |  |
| Veto LLD | 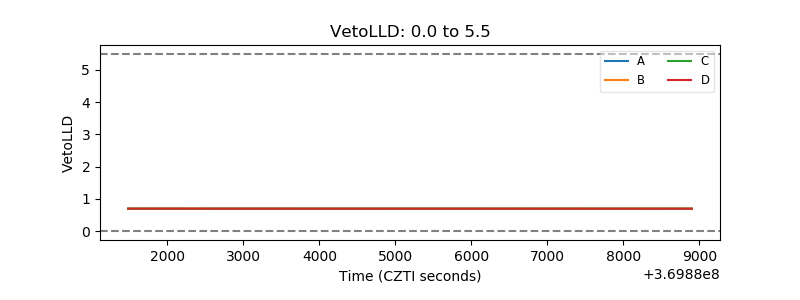 |
| Alpha Counter | 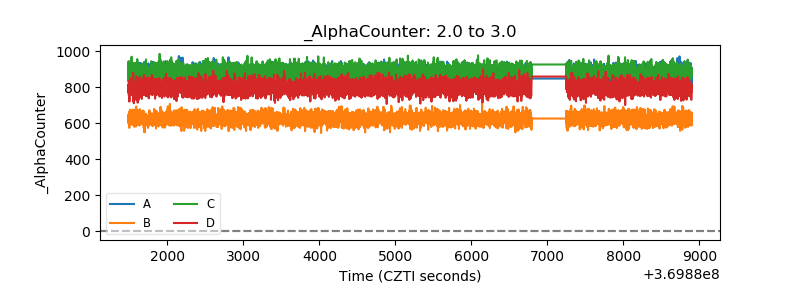 |
| _CPM_Rate | 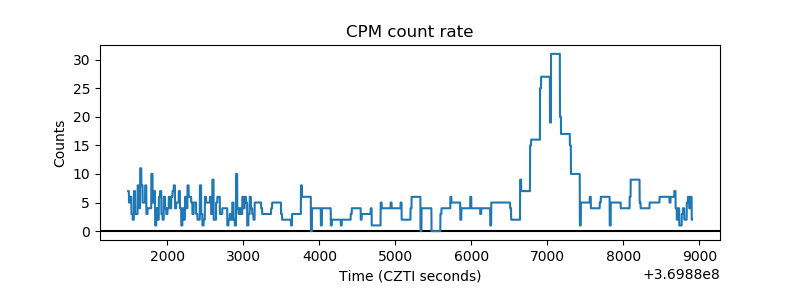 |
| CZT Counter | 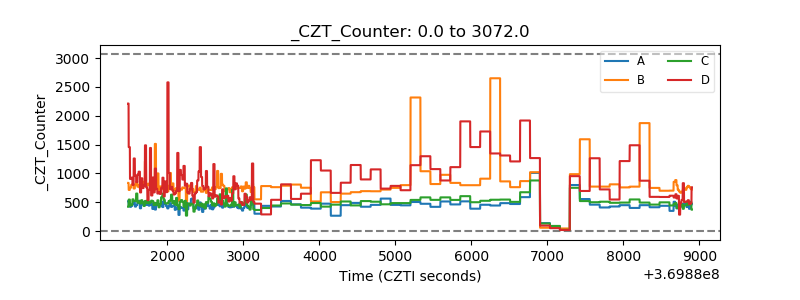 |
| +2.5 Volts monitor |  |
| +5 Volts monitor |  |
| _ROLL_ROT | 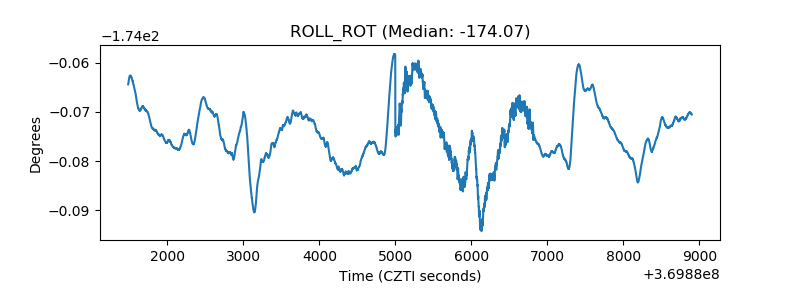 |
| _Roll_DEC | 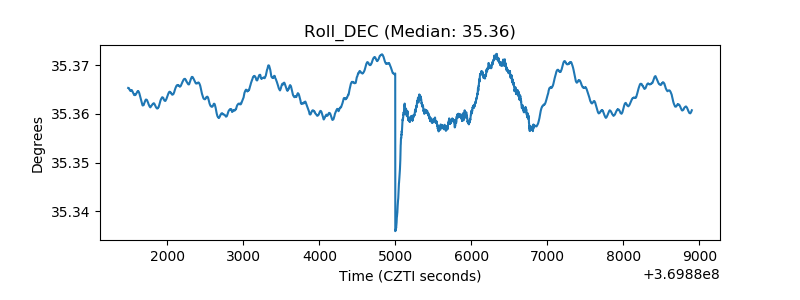 |
| _Roll_RA | 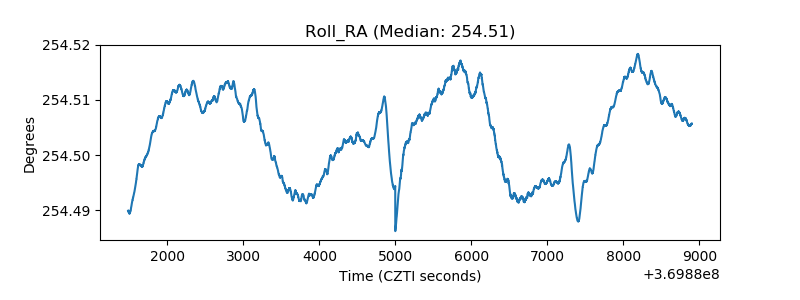 |
| Veto Counter | 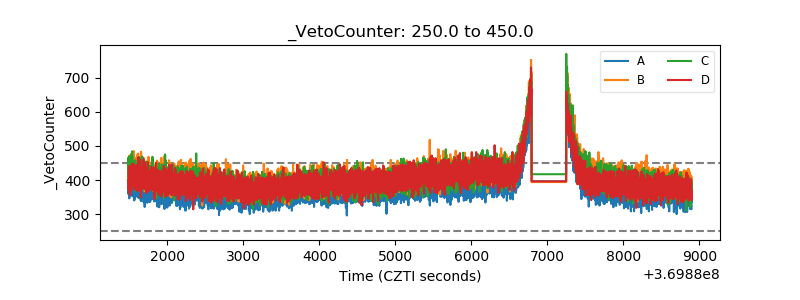 |