| Param | Original file | Final file |
|---|---|---|
| Filename | modeM0/AS1A10_005T01_9000004700_32342cztM0_level2.evt | modeM0/AS1A10_005T01_9000004700_32342cztM0_level2_quad_clean.evt |
| Size (bytes) | 659,197,440 | 76,536,000 |
| Size | 628.7 MB | 73.0 MB |
| Events in quadrant A | 3,320,161 | 487,663 |
| Events in quadrant B | 6,034,932 | 462,851 |
| Events in quadrant C | 3,554,360 | 462,749 |
| Events in quadrant D | 6,583,519 | 418,987 |
| Mode M0 | |||
|---|---|---|---|
| Quadrant | BADHDUFLAG | Total packets | Discarded packets |
| A | 0 | 14357 | 2 |
| B | 0 | 22969 | 1 |
| C | 0 | 14793 | 1 |
| D | 0 | 24746 | 1 |
| Mode M9 | |||
|---|---|---|---|
| Quadrant | BADHDUFLAG | Total packets | Discarded packets |
| A | 0 | 2 | 0 |
| B | 0 | 2 | 0 |
| C | 0 | 2 | 0 |
| D | 0 | 2 | 0 |
| Mode SS | |||
|---|---|---|---|
| Quadrant | BADHDUFLAG | Total packets | Discarded packets |
| A | 0 | 140 | 0 |
| B | 0 | 140 | 0 |
| C | 0 | 140 | 0 |
| D | 0 | 140 | 0 |
| Quadrant | Total seconds | Saturated seconds | Saturation percentage |
|---|---|---|---|
| A | 6967 | 173 | 2.483135% |
| B | 6967 | 492 | 7.061863% |
| C | 6967 | 242 | 3.473518% |
| D | 6967 | 650 | 9.329697% |
Noise dominated data is calculated using 1-second bins in cleaned event files. If a bin has >2000 counts, and if more than 50% of those come from <1% of pixels, then it is considered to be noise-dominated and hence unusable.
| Quadrant | # 1 sec bins | Bins with >0 counts | Bins with >2000 counts | High rate bins dominated by noise | Noise dominated (total time) | Noise dominated (detector-on time) | Marked lightcurve |
|---|---|---|---|---|---|---|---|
| A | 7127 | 6968 | 0 | 0 | 0.00% | 0.00% | 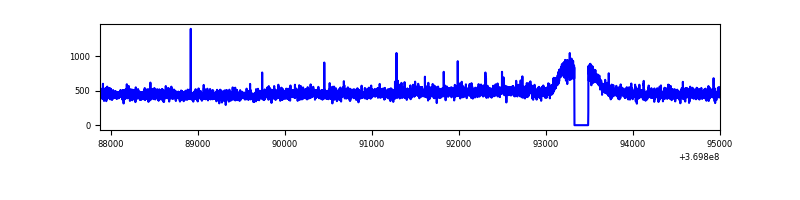 |
| B | 7127 | 6968 | 151 | 151 | 2.12% | 2.17% | 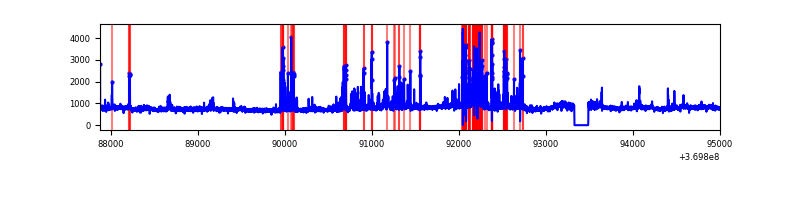 |
| C | 7127 | 6968 | 1 | 1 | 0.01% | 0.01% | 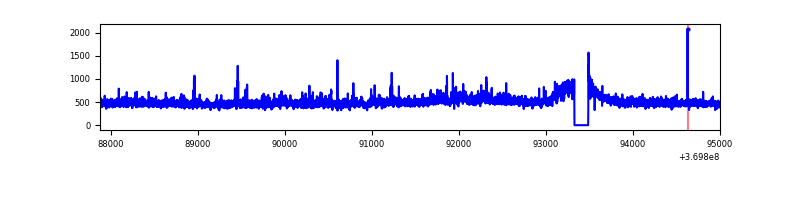 |
| D | 7127 | 6968 | 365 | 365 | 5.12% | 5.24% | 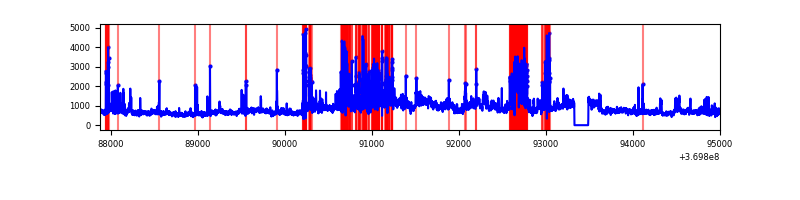 |
Top three noisy pixels from each quadrant. If the there are fewer than three noisy pixels in the level2.evt file, extra rows are filled as -1
| Pixel properties | Quadrant properties | ||||||
|---|---|---|---|---|---|---|---|
| Quadrant | DetID | PixID | Counts | Sigma | Mean | Median | Sigma |
| A | 12 | 189 | 24841 | 139.56 | 847 | 828 | 172.1 |
| A | 13 | 6 | 20244 | 112.84 | 847 | 828 | 172.1 |
| A | 13 | 254 | 13452 | 73.37 | 847 | 828 | 172.1 |
| B | 6 | 159 | 1912119 | 11956.07 | 823 | 802 | 159.9 |
| B | 5 | 172 | 488913 | 3053.34 | 823 | 802 | 159.9 |
| B | 10 | 245 | 205545 | 1280.75 | 823 | 802 | 159.9 |
| C | 14 | 238 | 140252 | 721.32 | 813 | 816 | 193.3 |
| C | 3 | 233 | 102445 | 525.74 | 813 | 816 | 193.3 |
| C | 14 | 67 | 56142 | 286.21 | 813 | 816 | 193.3 |
| D | 8 | 195 | 2059376 | 10972.61 | 790 | 767 | 187.6 |
| D | 13 | 249 | 956766 | 5095.58 | 790 | 767 | 187.6 |
| D | 14 | 52 | 202693 | 1076.29 | 790 | 767 | 187.6 |
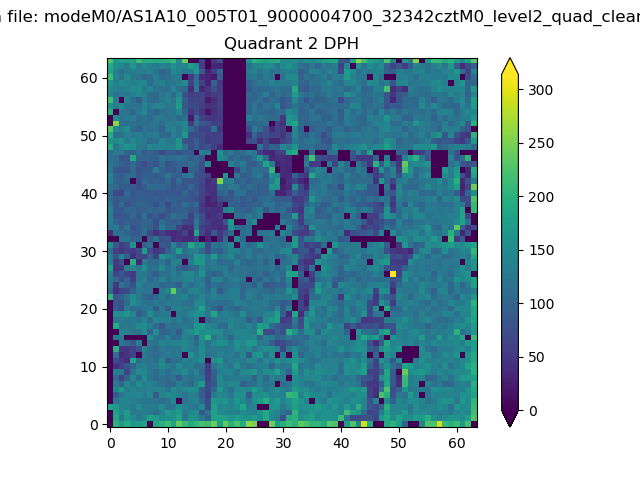
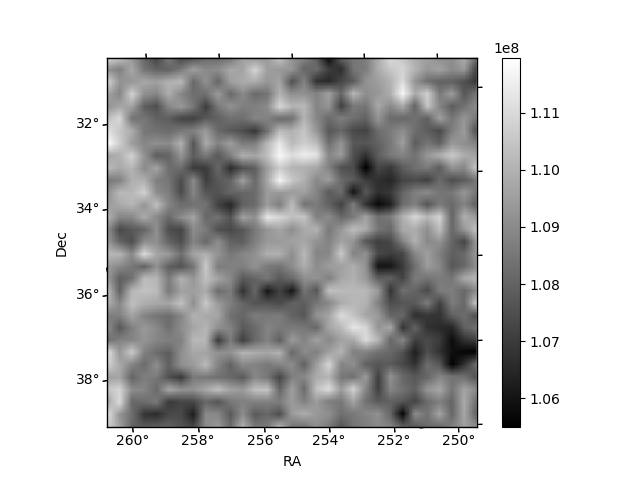
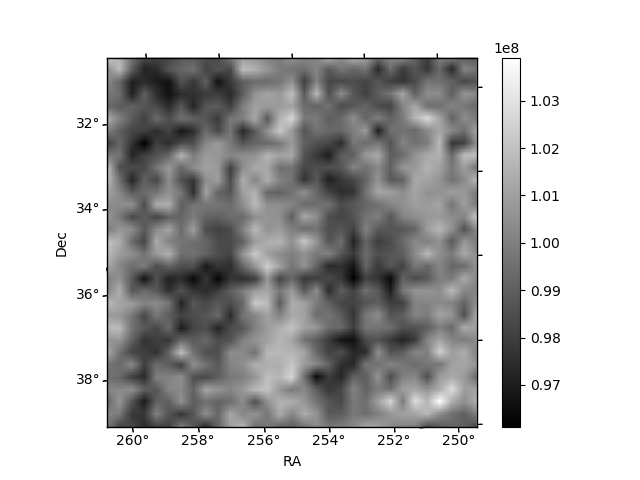
Histogram calculated using DETX and DETY for each event in the final _common_clean file
| Quadrant A | 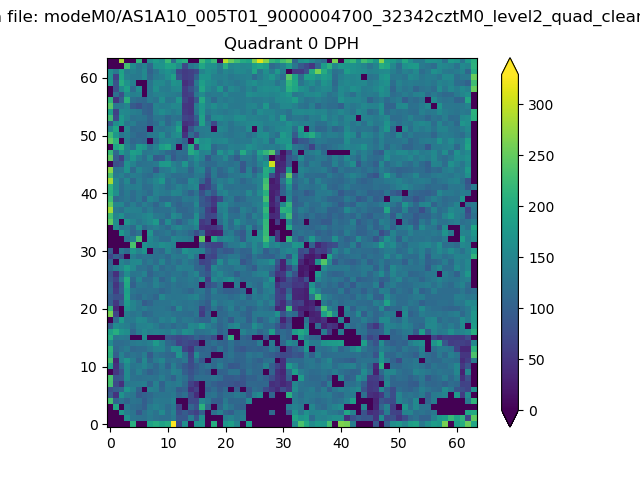 |
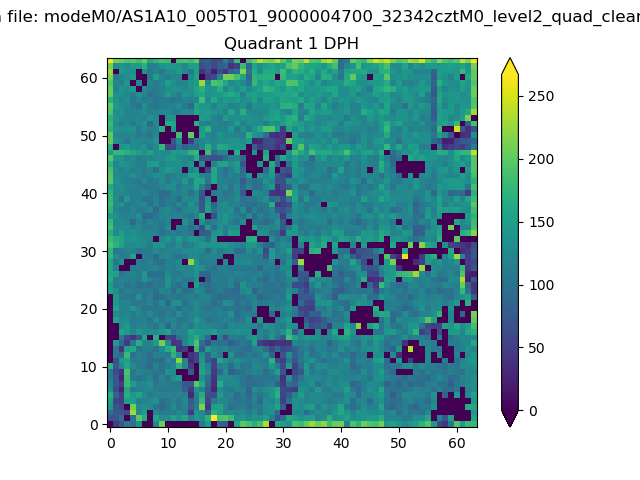 |
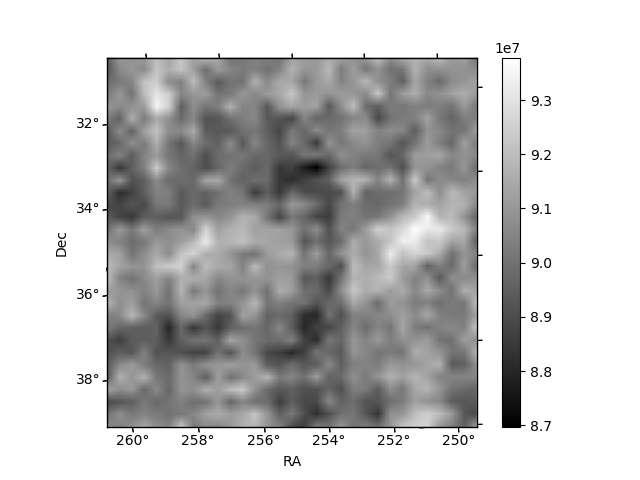
Quadrant B |
|---|---|---|---|
| Quadrant D | 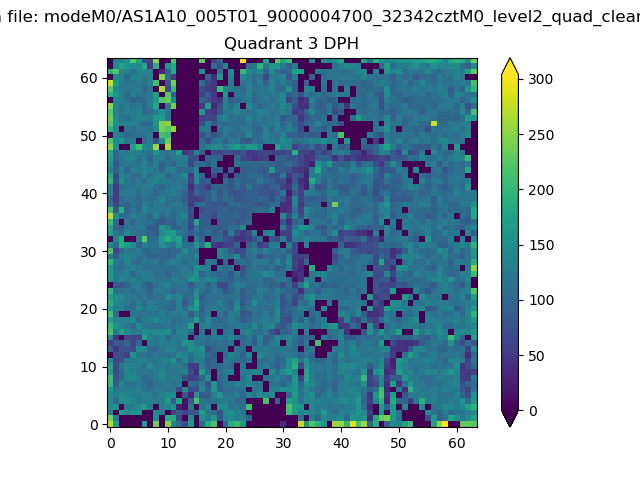 |
 |
Quadrant C |
| Plot type | Count rate plots | Images |
|---|---|---|
| Comparison with Poisson distribution Blue bars denote a histogram of data divided into 1 sec bins. Red curve is a Poisson curve with rate = median count rate of data. |
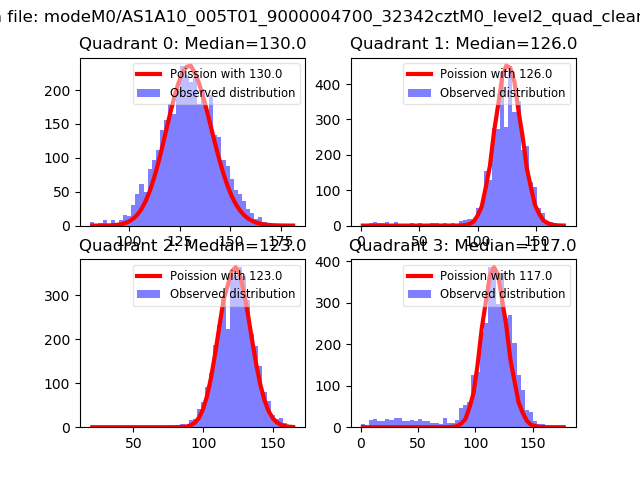 |
 |
| Quadrant-wise count rates Data is divided into 100 sec bins |
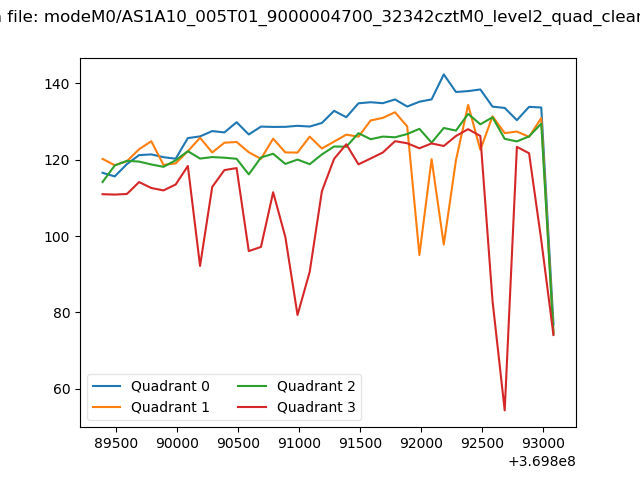 |
|
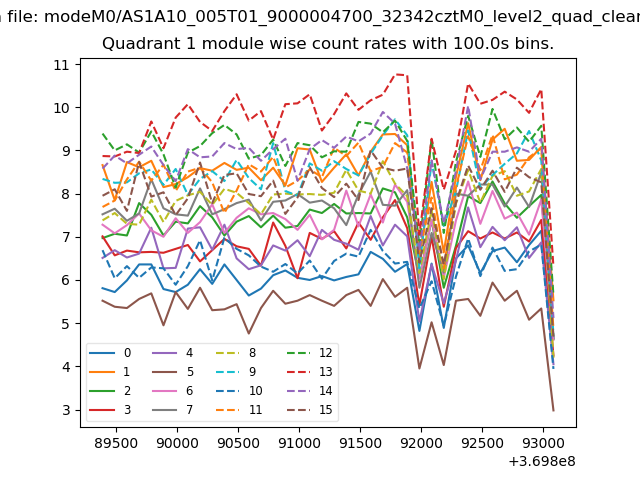
| Module-wise count rates for Quadrant A Data is divided into 100 sec bins |
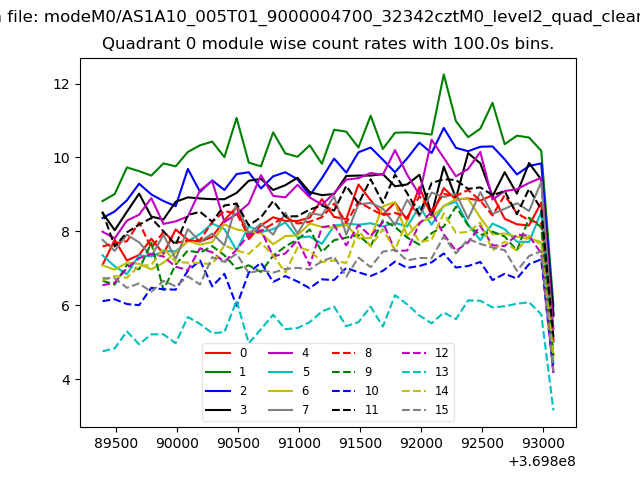 |
 |
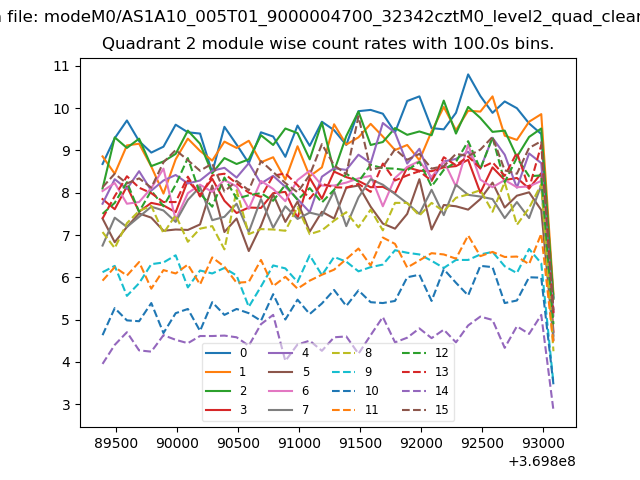
| Module-wise count rates for Quadrant B Data is divided into 100 sec bins |
 |
 |
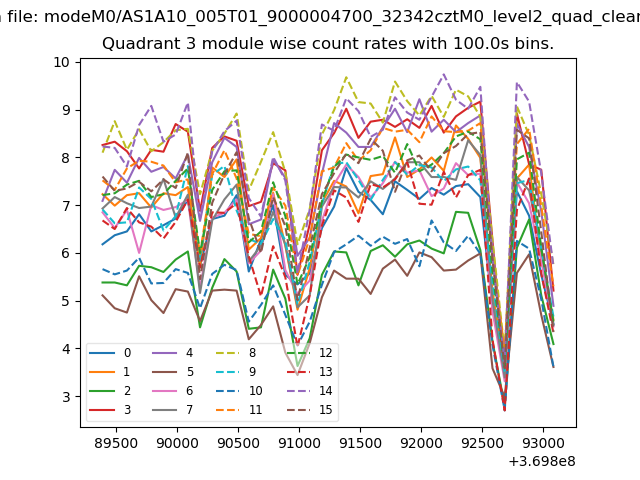
| Module-wise count rates for Quadrant C Data is divided into 100 sec bins |
 |
 |
| Module-wise count rates for Quadrant D Data is divided into 100 sec bins |
 |
 |
| Parameter | Plot |
|---|---|
| CZT HV Monitor | 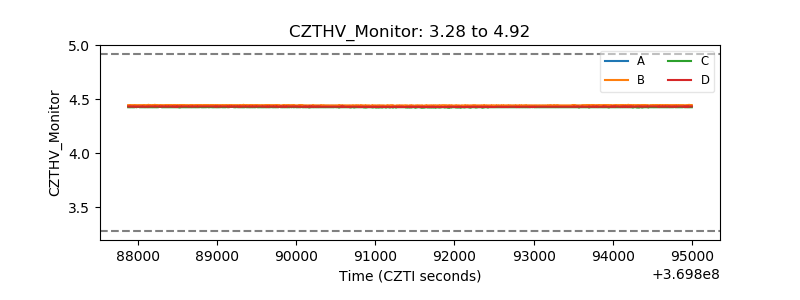 |
| D_VDD |  |
| Temperature 1 | 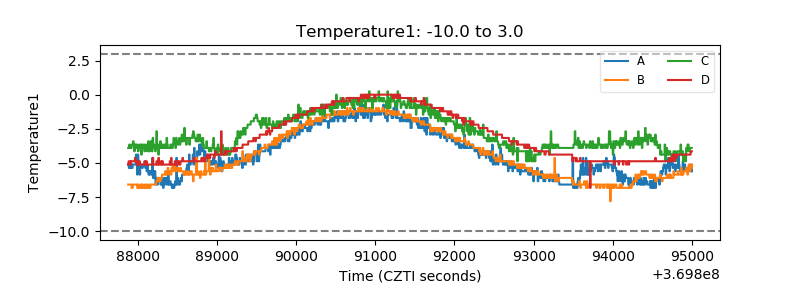 |
| Veto HV Monitor | 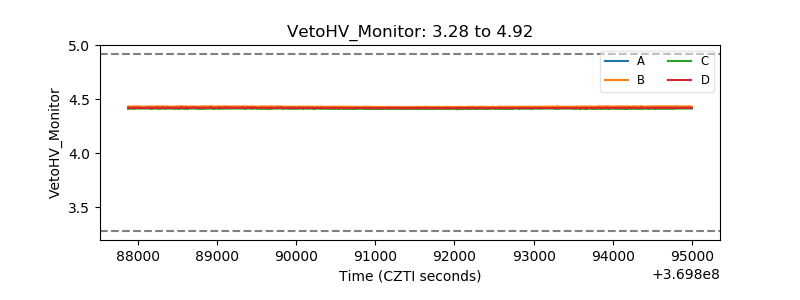 |
| Veto LLD | 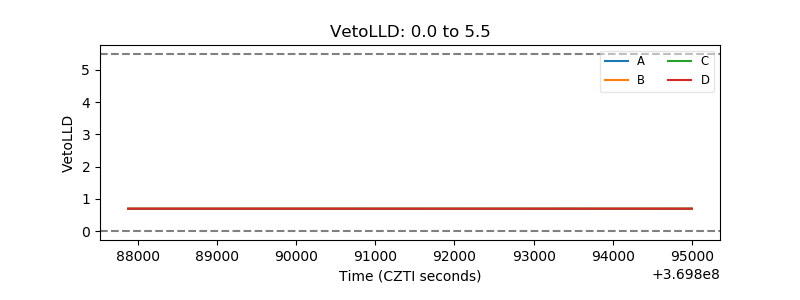 |
| Alpha Counter | 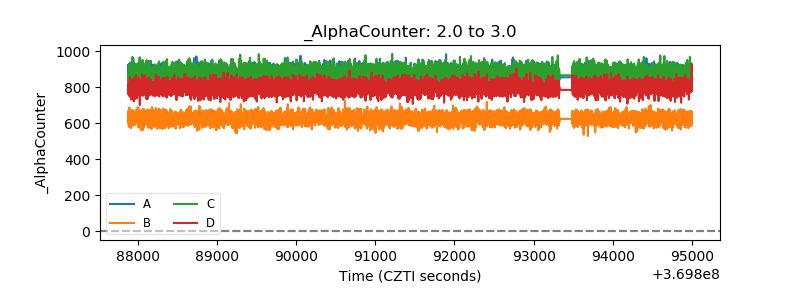 |
| _CPM_Rate | 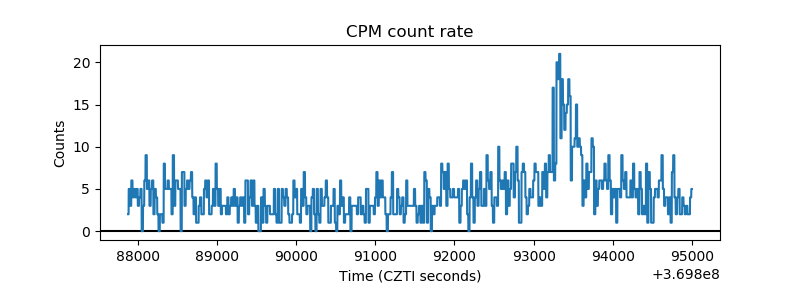 |
| CZT Counter | 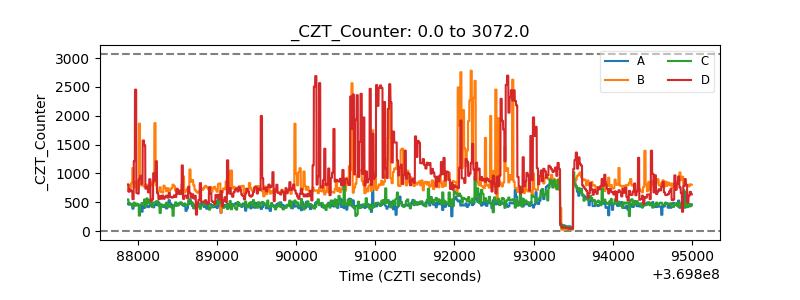 |
| +2.5 Volts monitor |  |
| +5 Volts monitor | 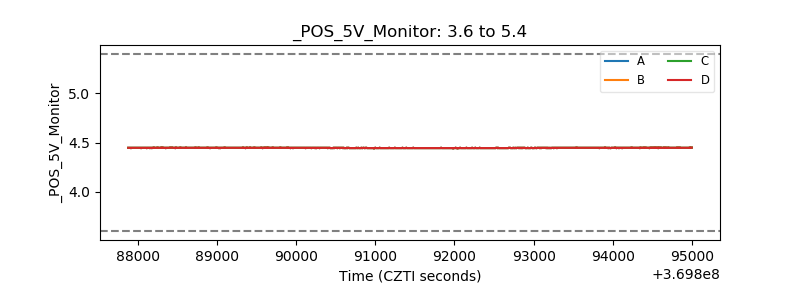 |
| _ROLL_ROT | 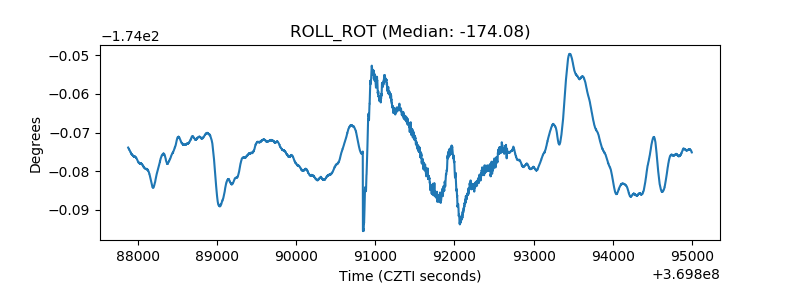 |
| _Roll_DEC | 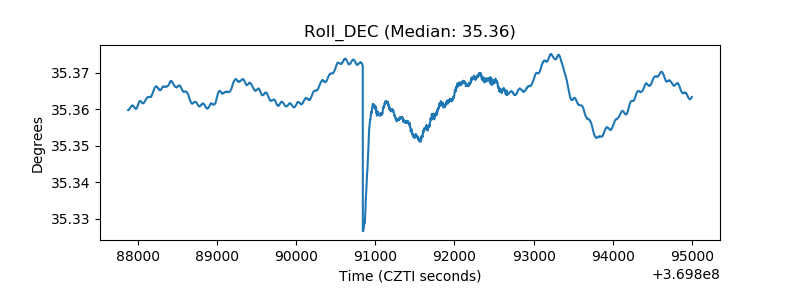 |
| _Roll_RA |  |
| Veto Counter | 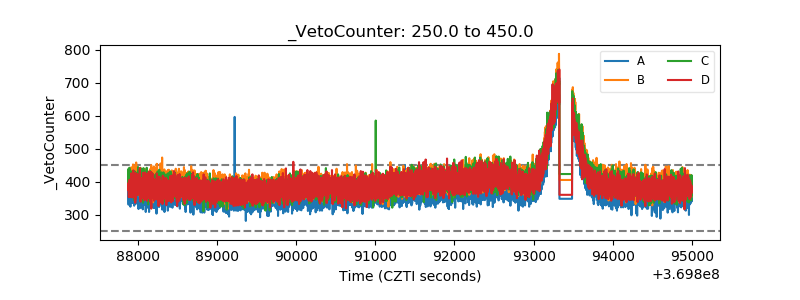 |