| Param | Original file | Final file |
|---|---|---|
| Filename | modeM0/AS1A10_005T01_9000004700_32347cztM0_level2.evt | modeM0/AS1A10_005T01_9000004700_32347cztM0_level2_quad_clean.evt |
| Size (bytes) | 594,432,000 | 97,130,880 |
| Size | 566.9 MB | 92.6 MB |
| Events in quadrant A | 3,266,280 | 654,524 |
| Events in quadrant B | 6,035,211 | 621,177 |
| Events in quadrant C | 3,500,741 | 609,056 |
| Events in quadrant D | 4,759,536 | 602,399 |
| Mode M0 | |||
|---|---|---|---|
| Quadrant | BADHDUFLAG | Total packets | Discarded packets |
| A | 0 | 13937 | 2 |
| B | 0 | 22385 | 1 |
| C | 0 | 14354 | 1 |
| D | 0 | 18882 | 1 |
| Mode M9 | |||
|---|---|---|---|
| Quadrant | BADHDUFLAG | Total packets | Discarded packets |
| A | 0 | 10 | 0 |
| B | 0 | 10 | 0 |
| C | 0 | 10 | 0 |
| D | 0 | 10 | 0 |
| Mode SS | |||
|---|---|---|---|
| Quadrant | BADHDUFLAG | Total packets | Discarded packets |
| A | 0 | 132 | 0 |
| B | 0 | 132 | 0 |
| C | 0 | 132 | 0 |
| D | 0 | 132 | 0 |
| Quadrant | Total seconds | Saturated seconds | Saturation percentage |
|---|---|---|---|
| A | 6515 | 61 | 0.936301% |
| B | 6515 | 404 | 6.201074% |
| C | 6515 | 144 | 2.210284% |
| D | 6515 | 175 | 2.686109% |
Noise dominated data is calculated using 1-second bins in cleaned event files. If a bin has >2000 counts, and if more than 50% of those come from <1% of pixels, then it is considered to be noise-dominated and hence unusable.
| Quadrant | # 1 sec bins | Bins with >0 counts | Bins with >2000 counts | High rate bins dominated by noise | Noise dominated (total time) | Noise dominated (detector-on time) | Marked lightcurve |
|---|---|---|---|---|---|---|---|
| A | 7510 | 6516 | 2 | 2 | 0.03% | 0.03% | 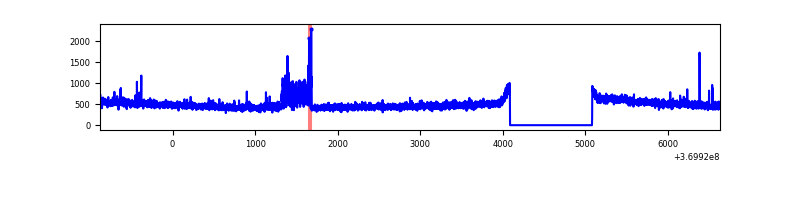 |
| B | 7510 | 6516 | 219 | 219 | 2.92% | 3.36% |  |
| C | 7510 | 6516 | 11 | 11 | 0.15% | 0.17% | 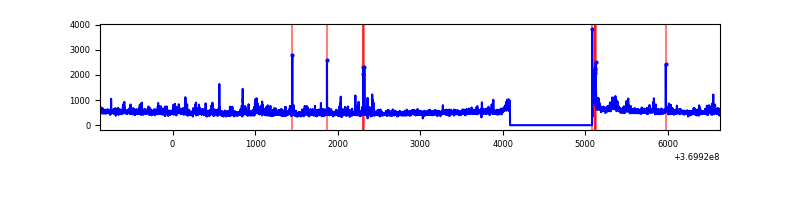 |
| D | 7510 | 6516 | 101 | 101 | 1.34% | 1.55% | 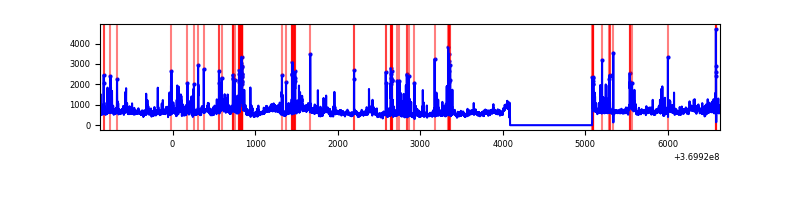 |
Top three noisy pixels from each quadrant. If the there are fewer than three noisy pixels in the level2.evt file, extra rows are filled as -1
| Pixel properties | Quadrant properties | ||||||
|---|---|---|---|---|---|---|---|
| Quadrant | DetID | PixID | Counts | Sigma | Mean | Median | Sigma |
| A | 12 | 189 | 103138 | 638.69 | 800 | 784 | 160.3 |
| A | 15 | 174 | 31980 | 194.66 | 800 | 784 | 160.3 |
| A | 13 | 6 | 31102 | 189.18 | 800 | 784 | 160.3 |
| B | 6 | 159 | 1903780 | 12978.87 | 771 | 754 | 146.6 |
| B | 5 | 172 | 793092 | 5403.84 | 771 | 754 | 146.6 |
| B | 0 | 190 | 125978 | 854.04 | 771 | 754 | 146.6 |
| C | 3 | 233 | 186315 | 1045.94 | 757 | 762 | 177.4 |
| C | 14 | 238 | 139690 | 783.12 | 757 | 762 | 177.4 |
| C | 0 | 10 | 77725 | 433.83 | 757 | 762 | 177.4 |
| D | 8 | 195 | 1023720 | 5522.56 | 771 | 751 | 185.2 |
| D | 12 | 233 | 301581 | 1624.05 | 771 | 751 | 185.2 |
| D | 14 | 52 | 81004 | 433.25 | 771 | 751 | 185.2 |
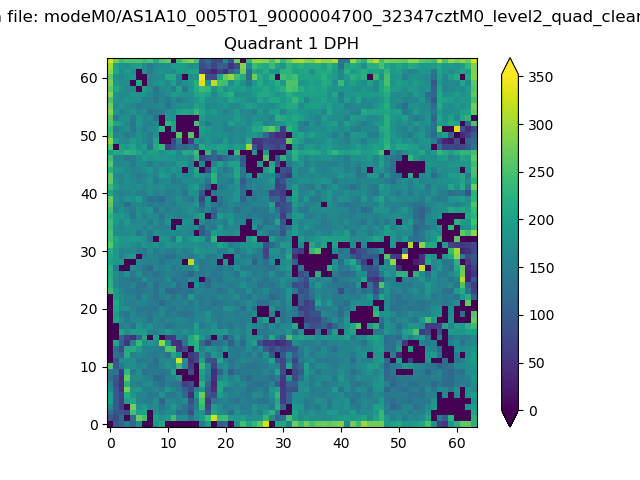
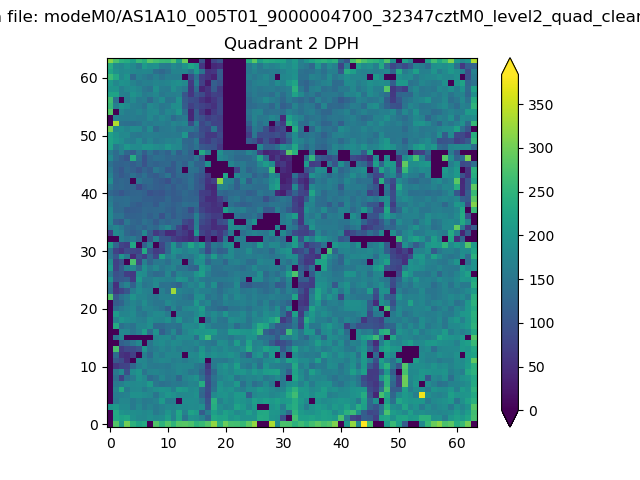
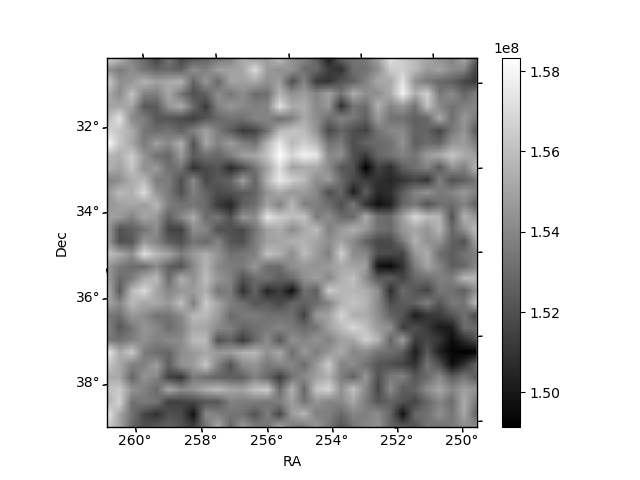
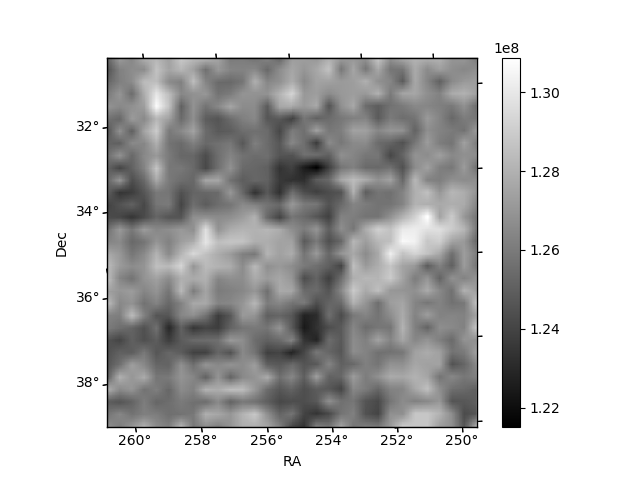
Histogram calculated using DETX and DETY for each event in the final _common_clean file
| Quadrant A |  |
 |
Quadrant B |
|---|---|---|---|
| Quadrant D | 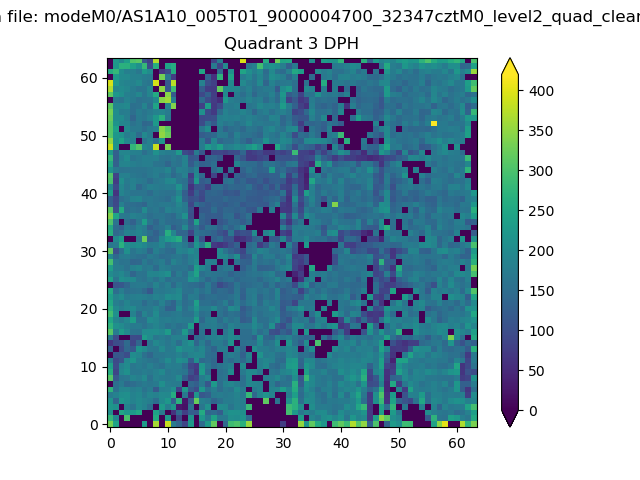 |
 |
Quadrant C |
| Plot type | Count rate plots | Images |
|---|---|---|
| Comparison with Poisson distribution Blue bars denote a histogram of data divided into 1 sec bins. Red curve is a Poisson curve with rate = median count rate of data. |
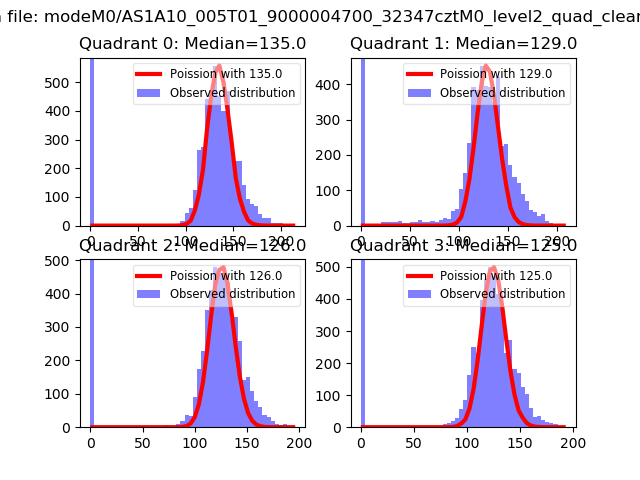 |
 |
| Quadrant-wise count rates Data is divided into 100 sec bins |
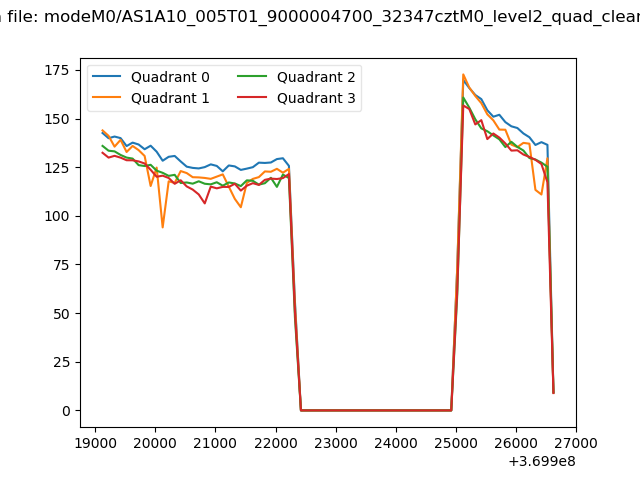 |
|
| Module-wise count rates for Quadrant A Data is divided into 100 sec bins |
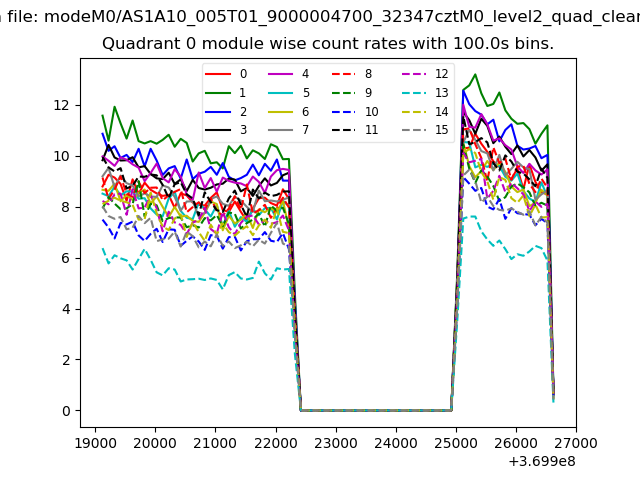 |
 |
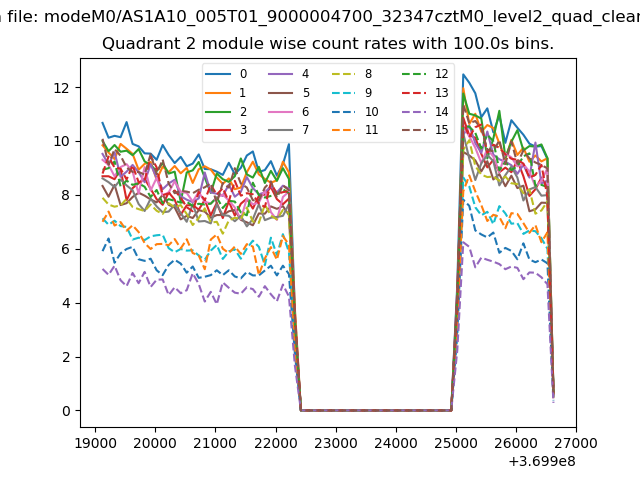
| Module-wise count rates for Quadrant B Data is divided into 100 sec bins |
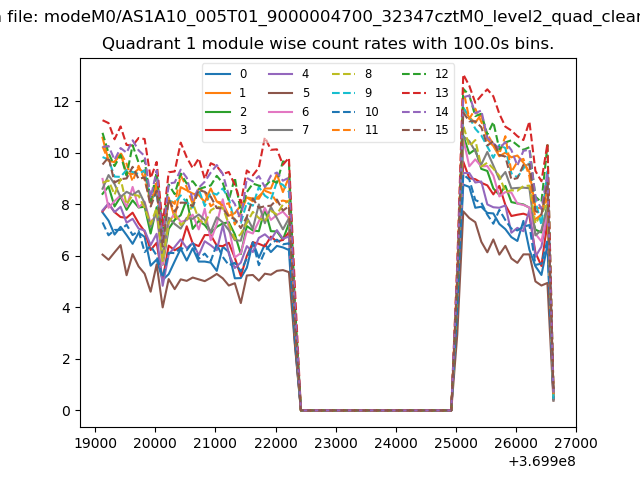 |
 |
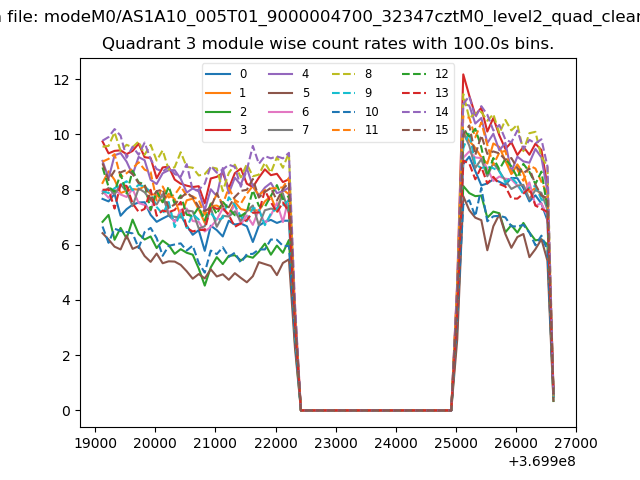
| Module-wise count rates for Quadrant C Data is divided into 100 sec bins |
 |
 |
| Module-wise count rates for Quadrant D Data is divided into 100 sec bins |
 |
 |
| Parameter | Plot |
|---|---|
| CZT HV Monitor | 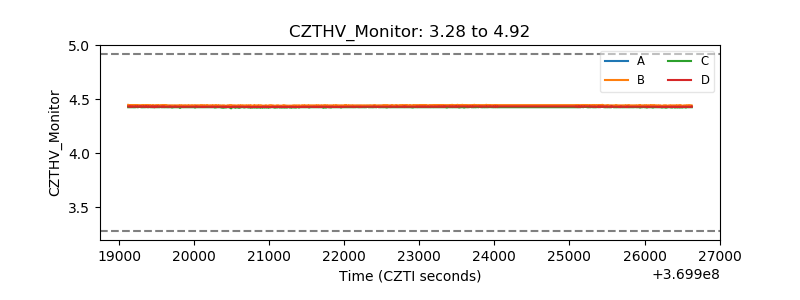 |
| D_VDD | 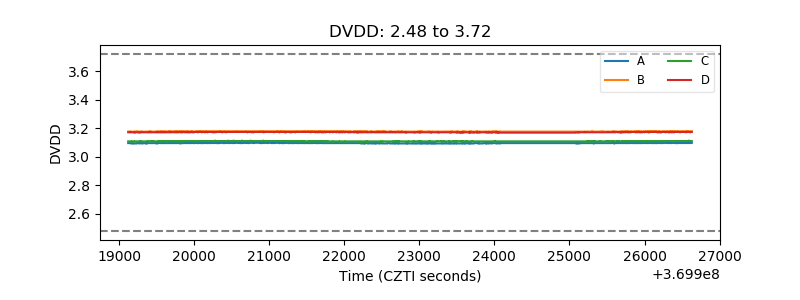 |
| Temperature 1 | 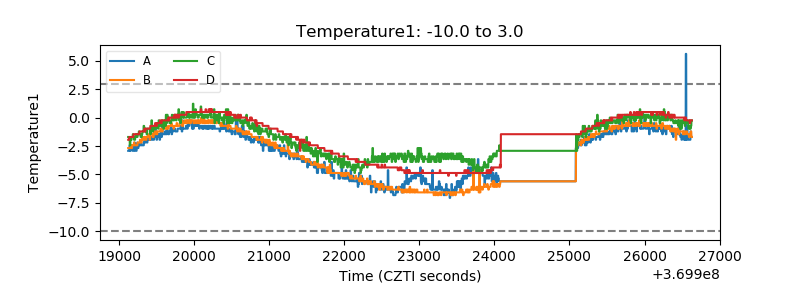 |
| Veto HV Monitor | 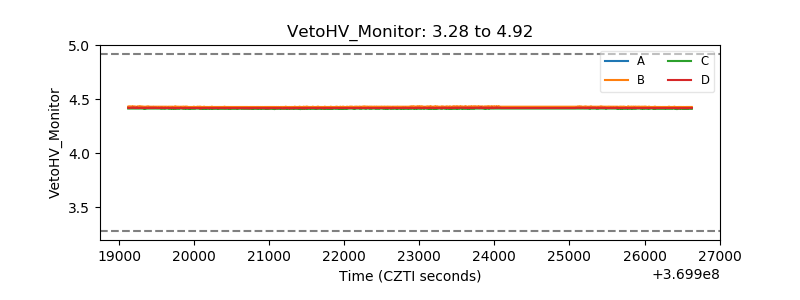 |
| Veto LLD | 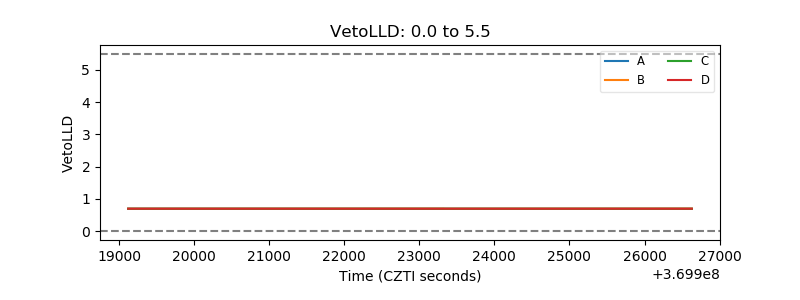 |
| Alpha Counter | 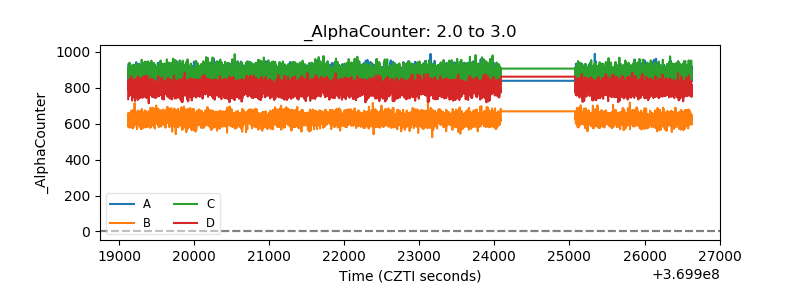 |
| _CPM_Rate | 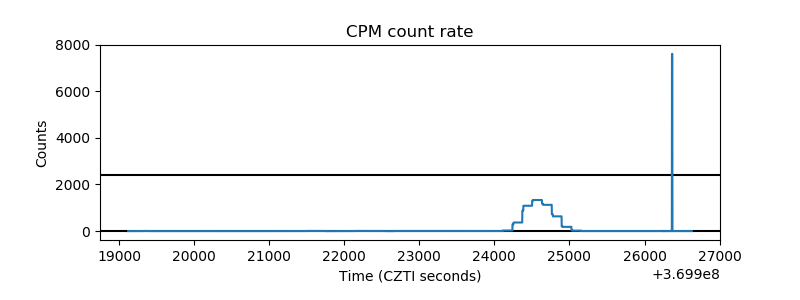 |
| CZT Counter | 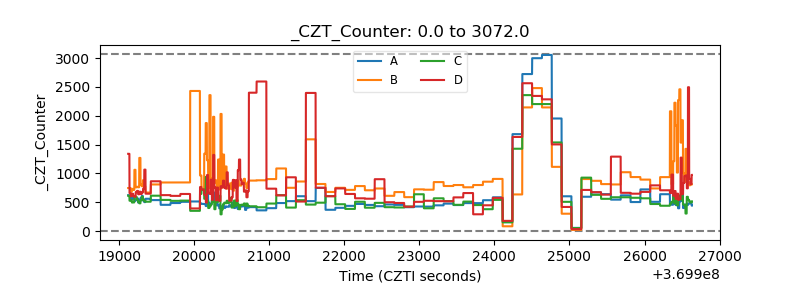 |
| +2.5 Volts monitor |  |
| +5 Volts monitor |  |
| _ROLL_ROT | 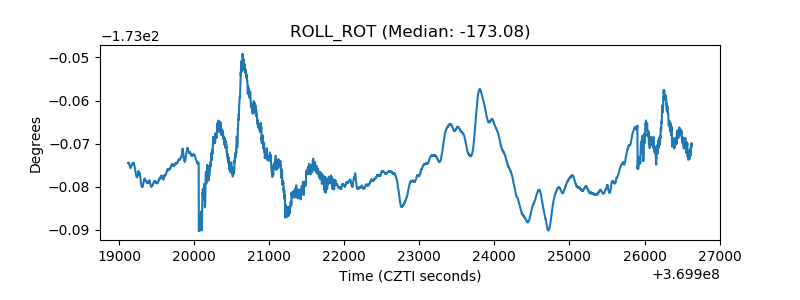 |
| _Roll_DEC | 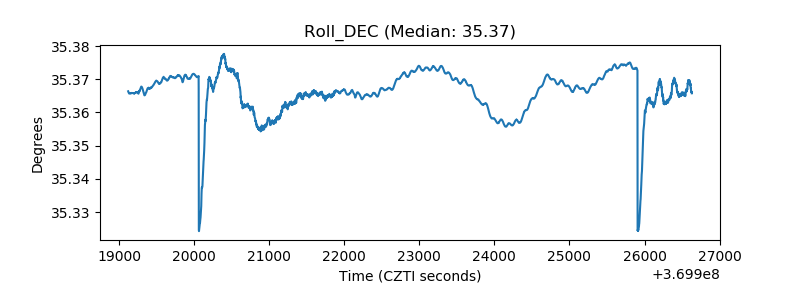 |
| _Roll_RA | 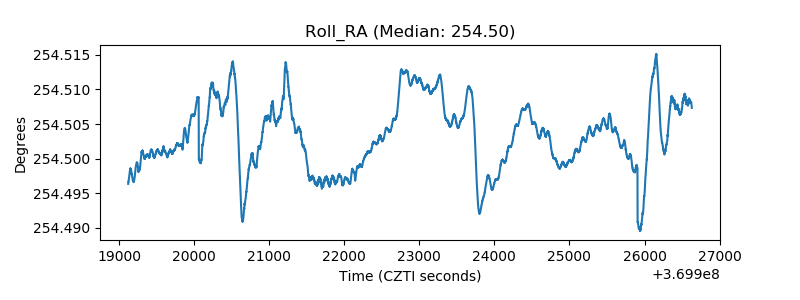 |
| Veto Counter | 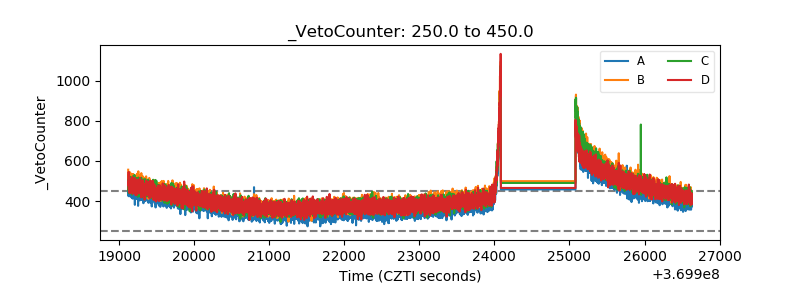 |