| Param | Original file | Final file |
|---|---|---|
| Filename | modeM0/AS1A10_005T01_9000004700_32350cztM0_level2.evt | modeM0/AS1A10_005T01_9000004700_32350cztM0_level2_quad_clean.evt |
| Size (bytes) | 588,853,440 | 85,547,520 |
| Size | 561.6 MB | 81.6 MB |
| Events in quadrant A | 2,954,851 | 588,640 |
| Events in quadrant B | 6,162,009 | 521,767 |
| Events in quadrant C | 3,333,509 | 549,599 |
| Events in quadrant D | 4,987,274 | 521,129 |
| Mode M0 | |||
|---|---|---|---|
| Quadrant | BADHDUFLAG | Total packets | Discarded packets |
| A | 0 | 12515 | 2 |
| B | 0 | 22509 | 1 |
| C | 0 | 13607 | 1 |
| D | 0 | 18839 | 1 |
| Mode M9 | |||
|---|---|---|---|
| Quadrant | BADHDUFLAG | Total packets | Discarded packets |
| A | 0 | 12 | 0 |
| B | 0 | 12 | 0 |
| C | 0 | 12 | 0 |
| D | 0 | 12 | 0 |
| Mode SS | |||
|---|---|---|---|
| Quadrant | BADHDUFLAG | Total packets | Discarded packets |
| A | 0 | 120 | 0 |
| B | 0 | 120 | 0 |
| C | 0 | 120 | 0 |
| D | 0 | 120 | 0 |
| Quadrant | Total seconds | Saturated seconds | Saturation percentage |
|---|---|---|---|
| A | 5851 | 30 | 0.512733% |
| B | 5851 | 723 | 12.356862% |
| C | 5851 | 110 | 1.880021% |
| D | 5851 | 323 | 5.520424% |
Noise dominated data is calculated using 1-second bins in cleaned event files. If a bin has >2000 counts, and if more than 50% of those come from <1% of pixels, then it is considered to be noise-dominated and hence unusable.
| Quadrant | # 1 sec bins | Bins with >0 counts | Bins with >2000 counts | High rate bins dominated by noise | Noise dominated (total time) | Noise dominated (detector-on time) | Marked lightcurve |
|---|---|---|---|---|---|---|---|
| A | 7081 | 5852 | 0 | 0 | 0.00% | 0.00% | 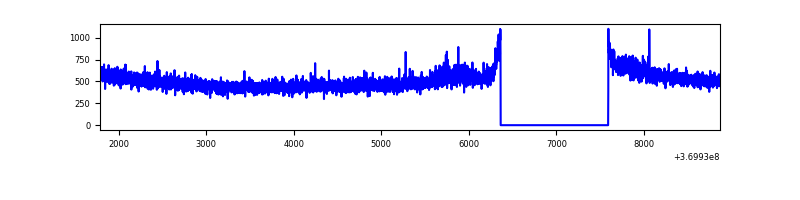 |
| B | 7081 | 5852 | 435 | 435 | 6.14% | 7.43% | 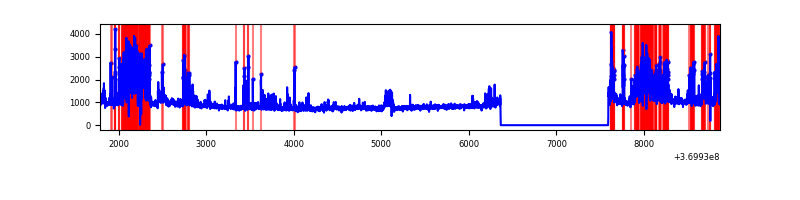 |
| C | 7081 | 5852 | 8 | 8 | 0.11% | 0.14% | 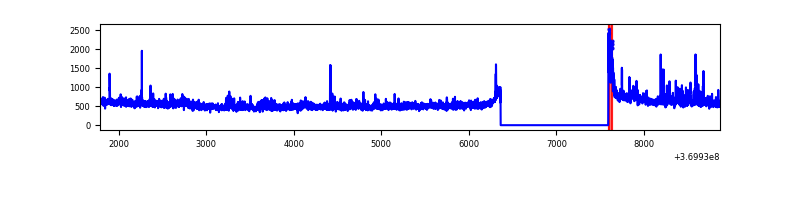 |
| D | 7081 | 5852 | 302 | 302 | 4.26% | 5.16% | 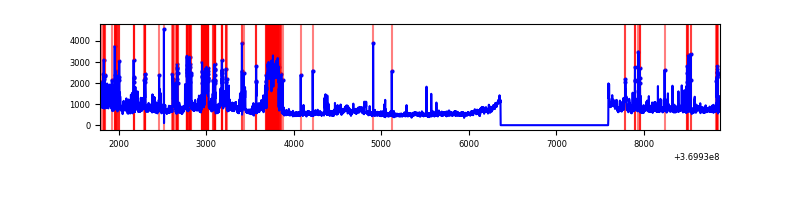 |
Top three noisy pixels from each quadrant. If the there are fewer than three noisy pixels in the level2.evt file, extra rows are filled as -1
| Pixel properties | Quadrant properties | ||||||
|---|---|---|---|---|---|---|---|
| Quadrant | DetID | PixID | Counts | Sigma | Mean | Median | Sigma |
| A | 12 | 189 | 43475 | 289.12 | 749 | 735 | 147.8 |
| A | 13 | 6 | 17832 | 115.66 | 749 | 735 | 147.8 |
| A | 13 | 254 | 12122 | 77.03 | 749 | 735 | 147.8 |
| B | 6 | 159 | 1825459 | 13808.59 | 704 | 686 | 132.1 |
| B | 5 | 172 | 1232105 | 9318.51 | 704 | 686 | 132.1 |
| B | 0 | 190 | 160840 | 1211.93 | 704 | 686 | 132.1 |
| C | 0 | 10 | 133972 | 800.67 | 718 | 725 | 166.4 |
| C | 14 | 238 | 121492 | 725.68 | 718 | 725 | 166.4 |
| C | 4 | 175 | 88200 | 525.63 | 718 | 725 | 166.4 |
| D | 8 | 195 | 1051919 | 6206.35 | 715 | 698 | 169.4 |
| D | 7 | 38 | 436486 | 2572.87 | 715 | 698 | 169.4 |
| D | 12 | 218 | 338447 | 1994.05 | 715 | 698 | 169.4 |
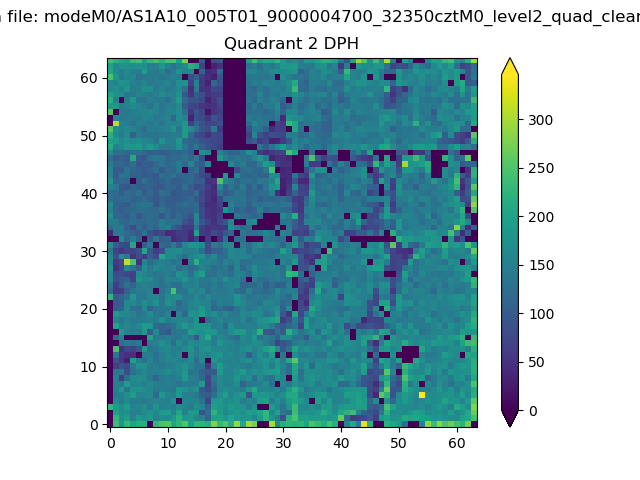
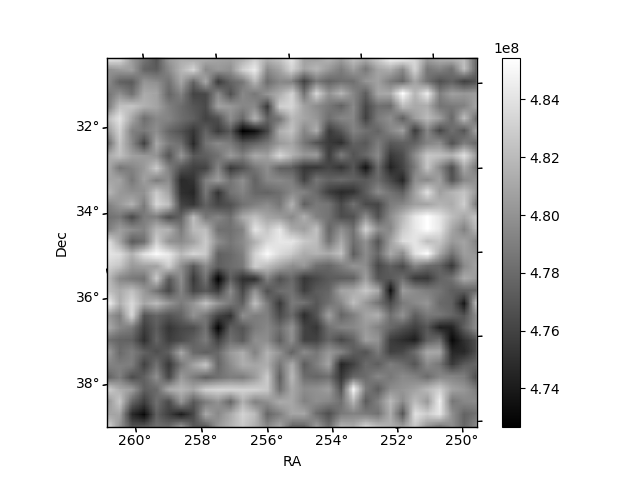
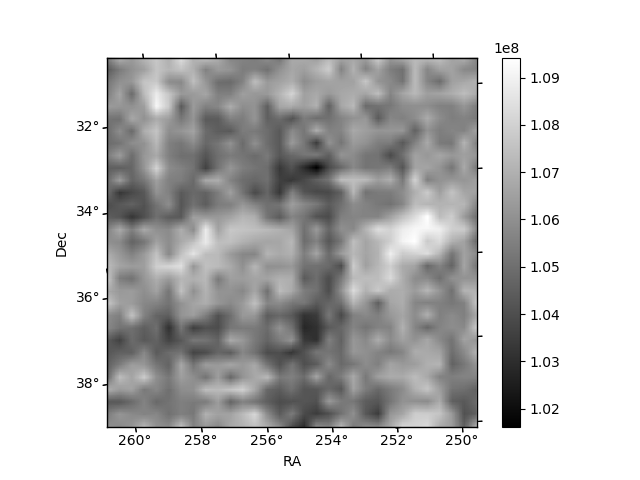
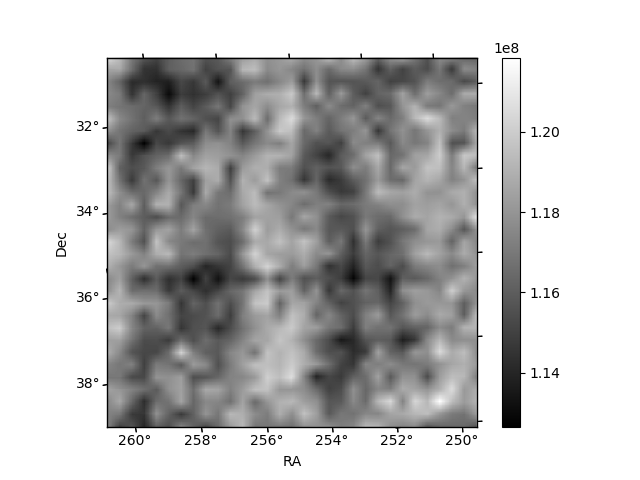
Histogram calculated using DETX and DETY for each event in the final _common_clean file
| Quadrant A | 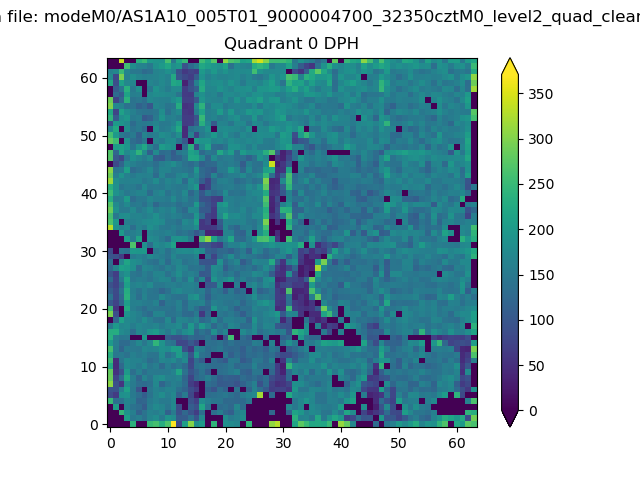 |
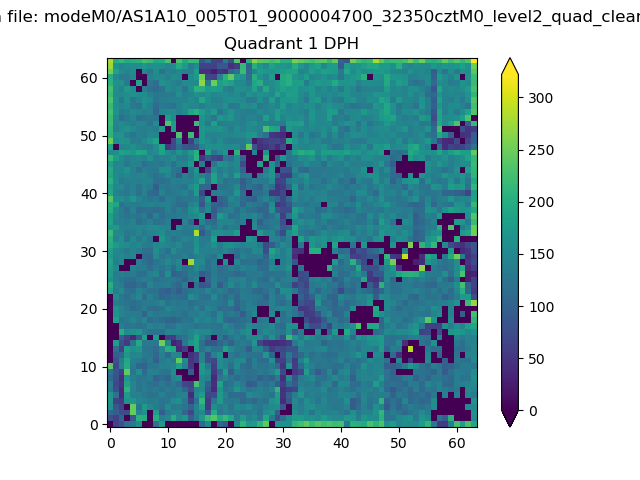 |
Quadrant B |
|---|---|---|---|
| Quadrant D | 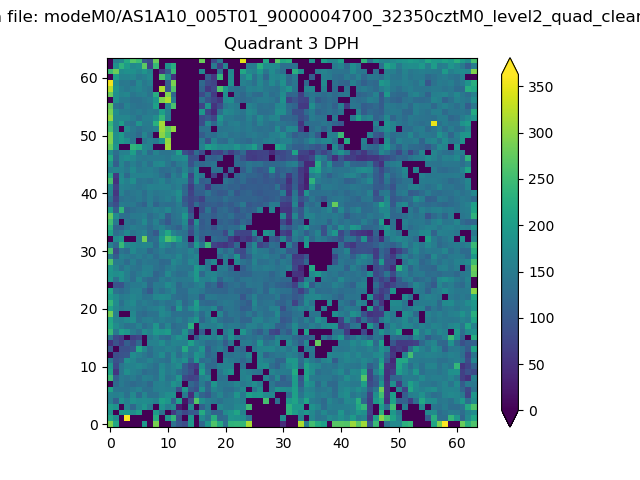 |
 |
Quadrant C |
| Plot type | Count rate plots | Images |
|---|---|---|
| Comparison with Poisson distribution Blue bars denote a histogram of data divided into 1 sec bins. Red curve is a Poisson curve with rate = median count rate of data. |
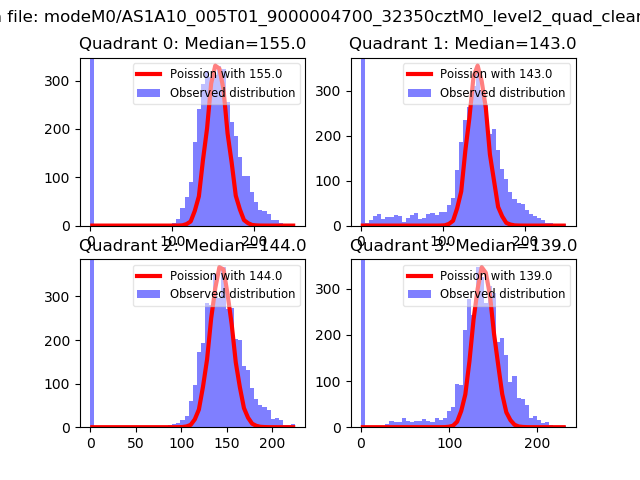 |
 |
| Quadrant-wise count rates Data is divided into 100 sec bins |
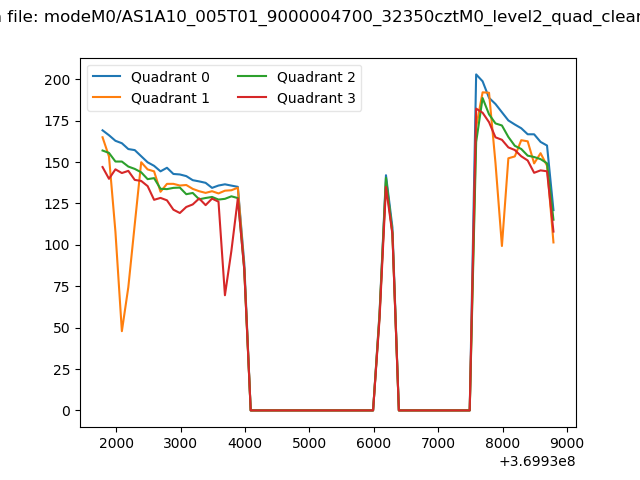 |
|
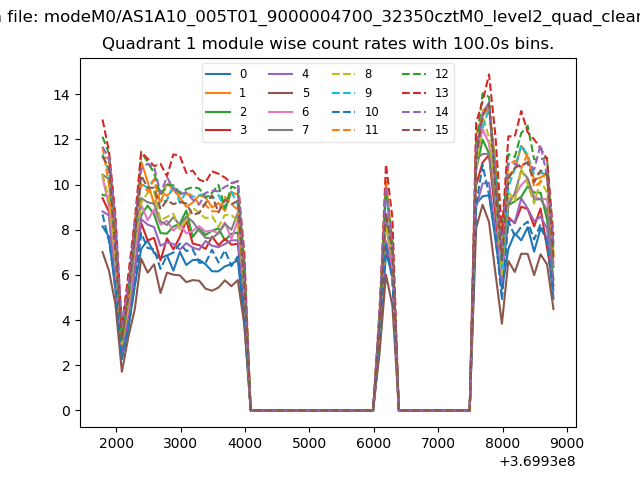
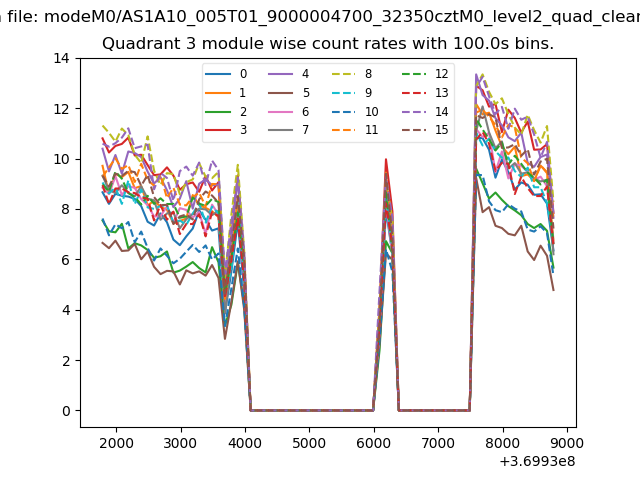
| Module-wise count rates for Quadrant A Data is divided into 100 sec bins |
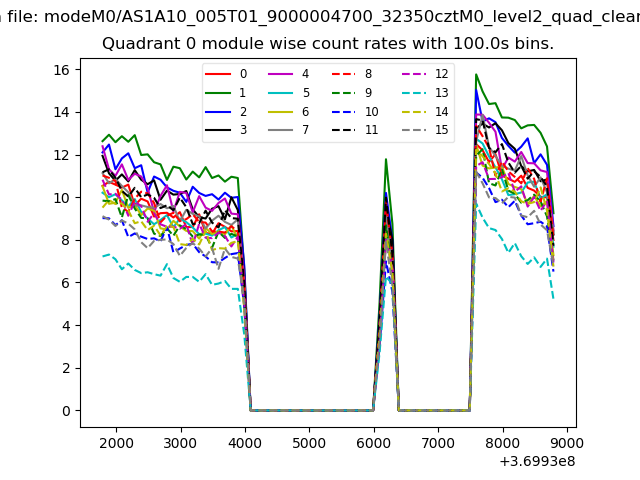 |
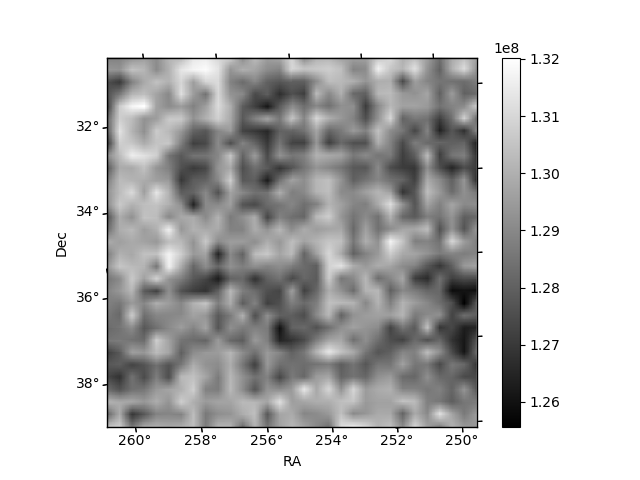 |
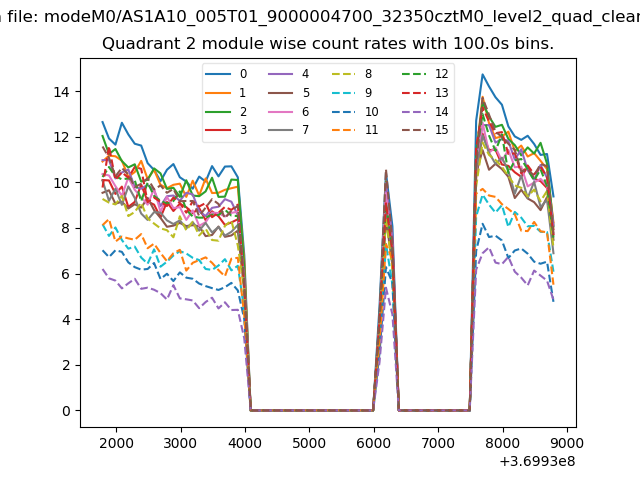
| Module-wise count rates for Quadrant B Data is divided into 100 sec bins |
 |
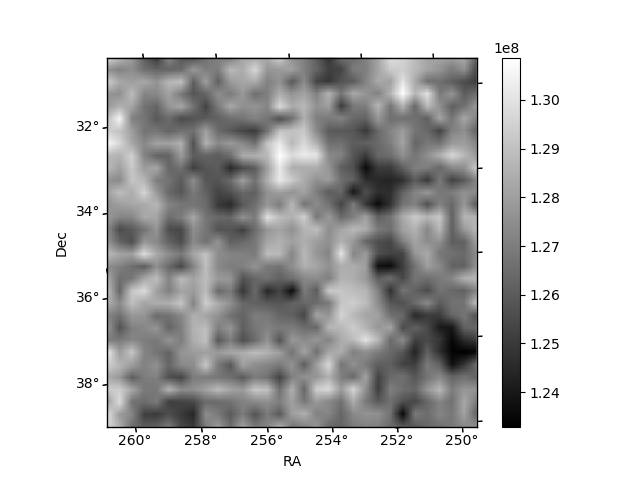 |
| Module-wise count rates for Quadrant C Data is divided into 100 sec bins |
 |
 |
| Module-wise count rates for Quadrant D Data is divided into 100 sec bins |
 |
 |
| Parameter | Plot |
|---|---|
| CZT HV Monitor | 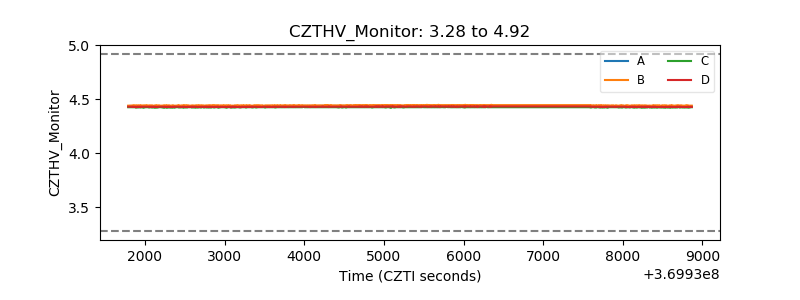 |
| D_VDD | 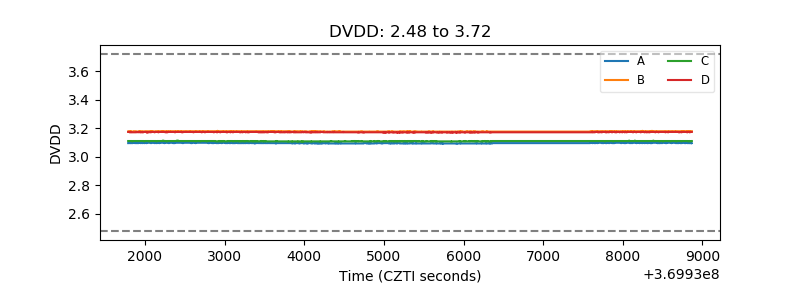 |
| Temperature 1 | 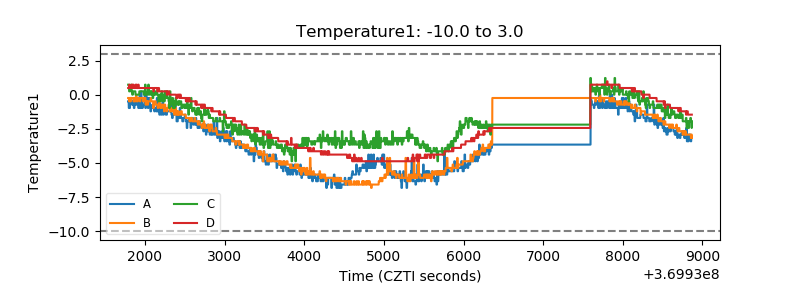 |
| Veto HV Monitor | 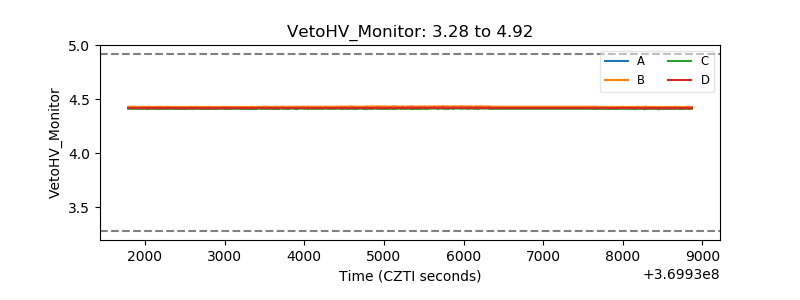 |
| Veto LLD | 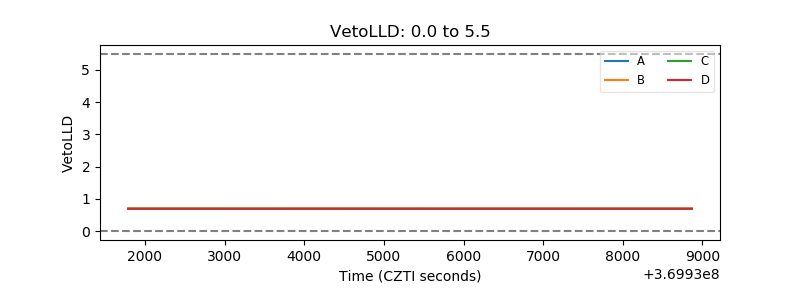 |
| Alpha Counter | 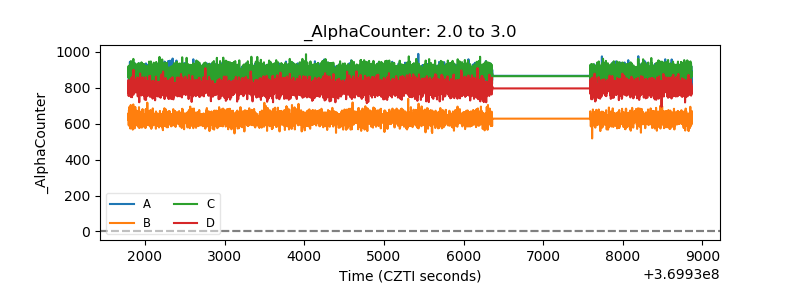 |
| _CPM_Rate | 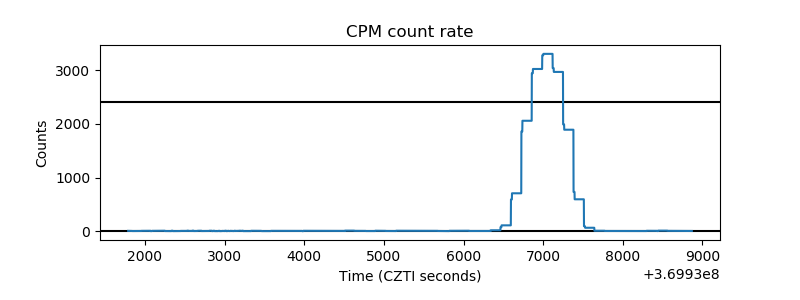 |
| CZT Counter | 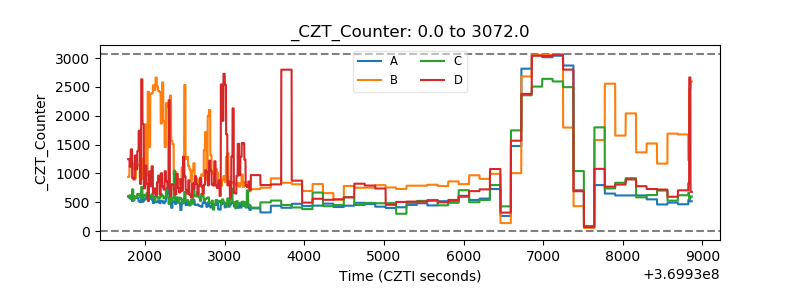 |
| +2.5 Volts monitor |  |
| +5 Volts monitor | 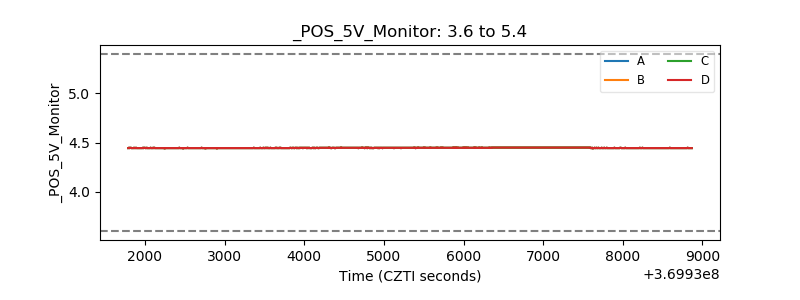 |
| _ROLL_ROT | 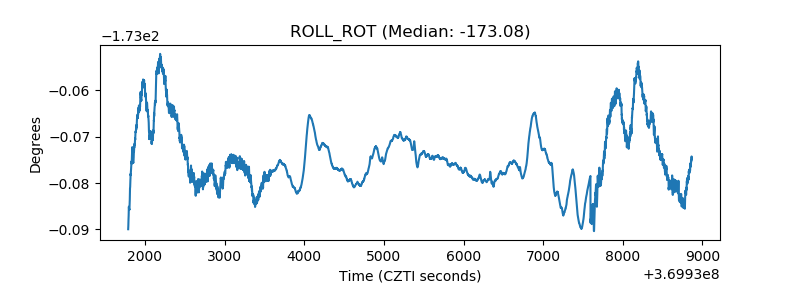 |
| _Roll_DEC | 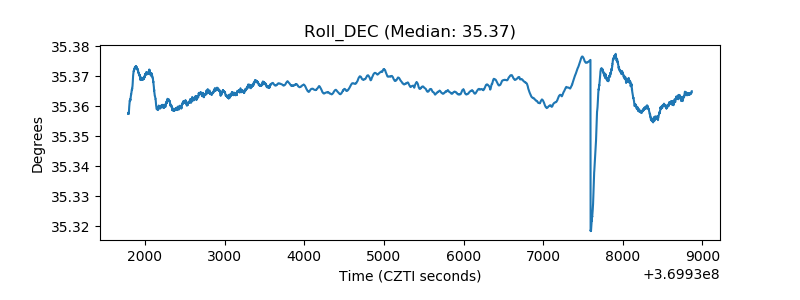 |
| _Roll_RA | 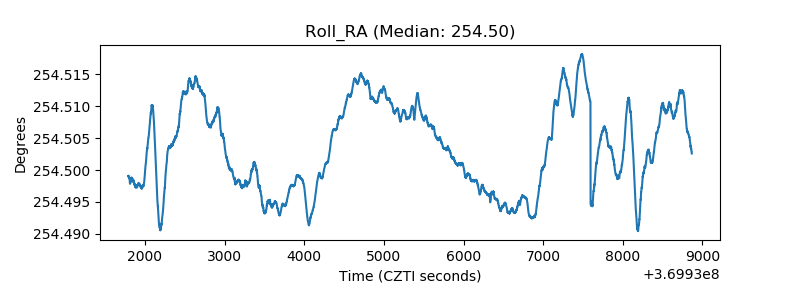 |
| Veto Counter | 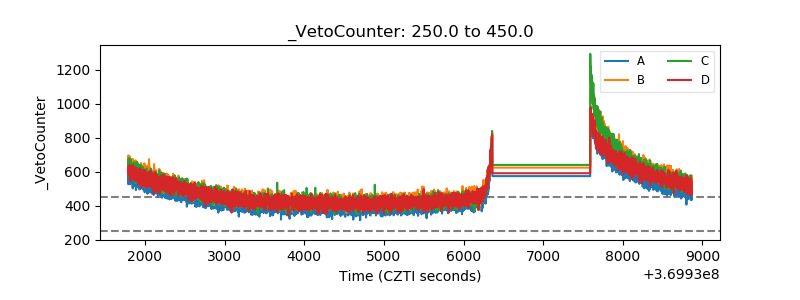 |