| Param | Original file | Final file |
|---|---|---|
| Filename | modeM0/AS1A10_005T01_9000004700_32352cztM0_level2.evt | modeM0/AS1A10_005T01_9000004700_32352cztM0_level2_quad_clean.evt |
| Size (bytes) | 635,616,000 | 98,634,240 |
| Size | 606.2 MB | 94.1 MB |
| Events in quadrant A | 3,483,899 | 674,342 |
| Events in quadrant B | 6,340,510 | 645,323 |
| Events in quadrant C | 4,179,474 | 618,051 |
| Events in quadrant D | 4,823,872 | 612,970 |
| Mode M0 | |||
|---|---|---|---|
| Quadrant | BADHDUFLAG | Total packets | Discarded packets |
| A | 0 | 14245 | 1 |
| B | 0 | 23381 | 1 |
| C | 0 | 16482 | 1 |
| D | 0 | 18573 | 1 |
| Mode M9 | |||
|---|---|---|---|
| Quadrant | BADHDUFLAG | Total packets | Discarded packets |
| A | 0 | 13 | 0 |
| B | 0 | 13 | 0 |
| C | 0 | 13 | 0 |
| D | 0 | 13 | 0 |
| Mode SS | |||
|---|---|---|---|
| Quadrant | BADHDUFLAG | Total packets | Discarded packets |
| A | 0 | 126 | 0 |
| B | 0 | 126 | 0 |
| C | 0 | 126 | 0 |
| D | 0 | 126 | 0 |
| Quadrant | Total seconds | Saturated seconds | Saturation percentage |
|---|---|---|---|
| A | 6252 | 46 | 0.735765% |
| B | 6252 | 490 | 7.837492% |
| C | 6252 | 411 | 6.573896% |
| D | 6252 | 165 | 2.639155% |
Noise dominated data is calculated using 1-second bins in cleaned event files. If a bin has >2000 counts, and if more than 50% of those come from <1% of pixels, then it is considered to be noise-dominated and hence unusable.
| Quadrant | # 1 sec bins | Bins with >0 counts | Bins with >2000 counts | High rate bins dominated by noise | Noise dominated (total time) | Noise dominated (detector-on time) | Marked lightcurve |
|---|---|---|---|---|---|---|---|
| A | 7557 | 6253 | 2 | 2 | 0.03% | 0.03% | 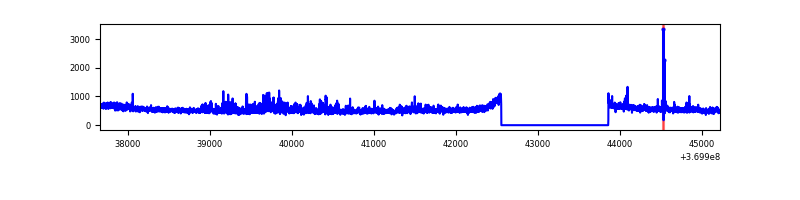 |
| B | 7557 | 6253 | 273 | 273 | 3.61% | 4.37% | 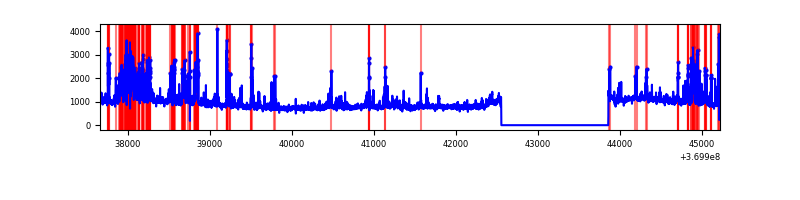 |
| C | 7557 | 6253 | 163 | 163 | 2.16% | 2.61% | 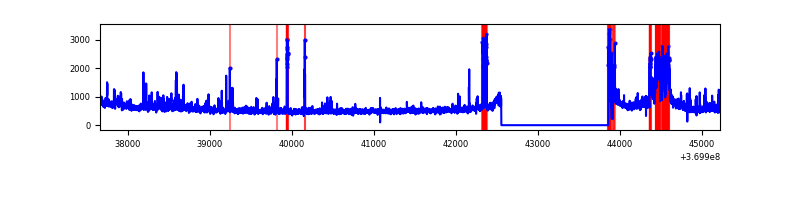 |
| D | 7557 | 6253 | 119 | 119 | 1.57% | 1.90% | 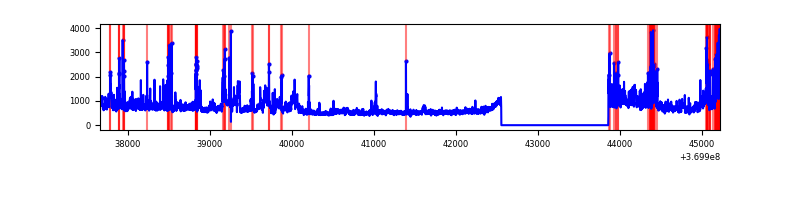 |
Top three noisy pixels from each quadrant. If the there are fewer than three noisy pixels in the level2.evt file, extra rows are filled as -1
| Pixel properties | Quadrant properties | ||||||
|---|---|---|---|---|---|---|---|
| Quadrant | DetID | PixID | Counts | Sigma | Mean | Median | Sigma |
| A | 12 | 189 | 253411 | 1555.73 | 824 | 810 | 162.4 |
| A | 13 | 6 | 20191 | 119.36 | 824 | 810 | 162.4 |
| A | 12 | 96 | 19406 | 114.53 | 824 | 810 | 162.4 |
| B | 6 | 159 | 2031012 | 13681.73 | 806 | 789 | 148.4 |
| B | 5 | 172 | 761521 | 5126.59 | 806 | 789 | 148.4 |
| B | 12 | 18 | 123318 | 825.73 | 806 | 789 | 148.4 |
| C | 0 | 10 | 708850 | 3901.16 | 779 | 785 | 181.5 |
| C | 14 | 238 | 155865 | 854.43 | 779 | 785 | 181.5 |
| C | 4 | 175 | 82750 | 451.6 | 779 | 785 | 181.5 |
| D | 8 | 195 | 1160545 | 6216.22 | 796 | 777 | 186.6 |
| D | 12 | 233 | 167352 | 892.82 | 796 | 777 | 186.6 |
| D | 12 | 6 | 127651 | 680.03 | 796 | 777 | 186.6 |
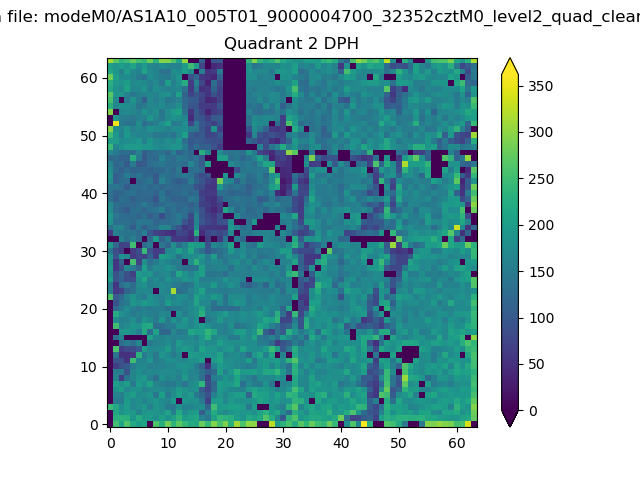
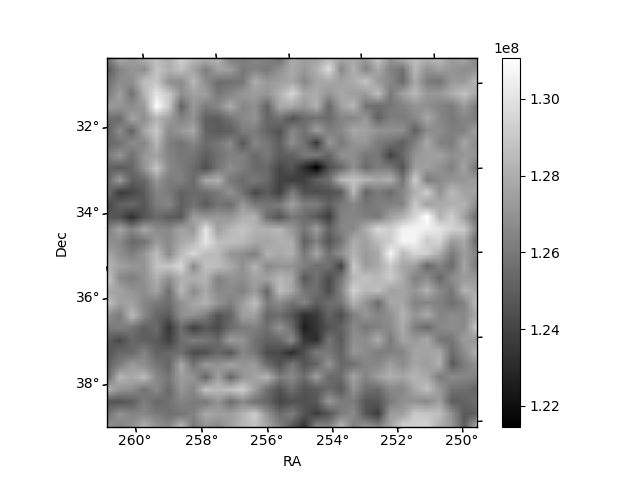
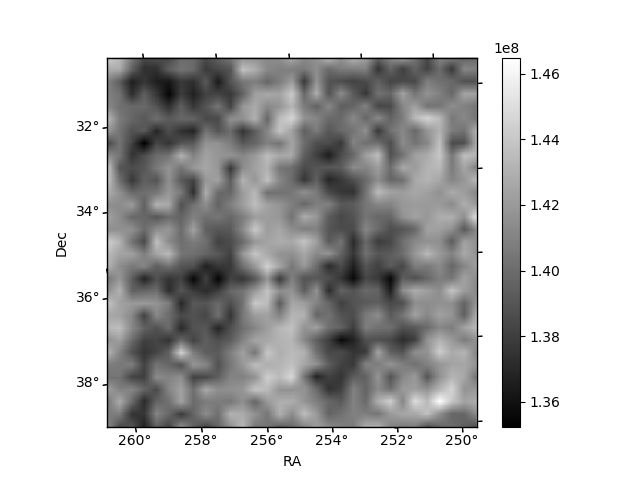
Histogram calculated using DETX and DETY for each event in the final _common_clean file
| Quadrant A | 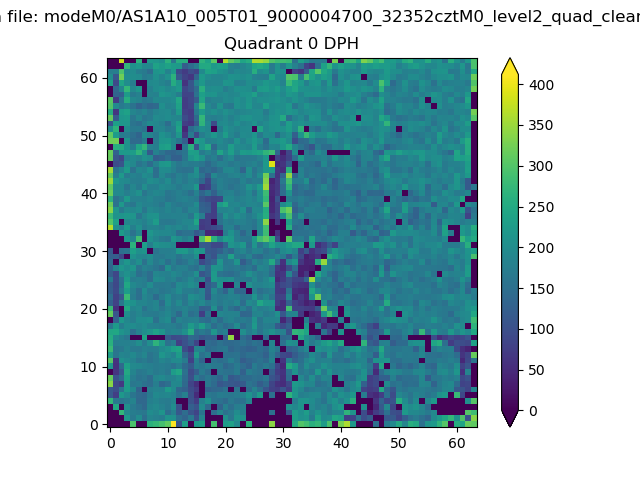 |
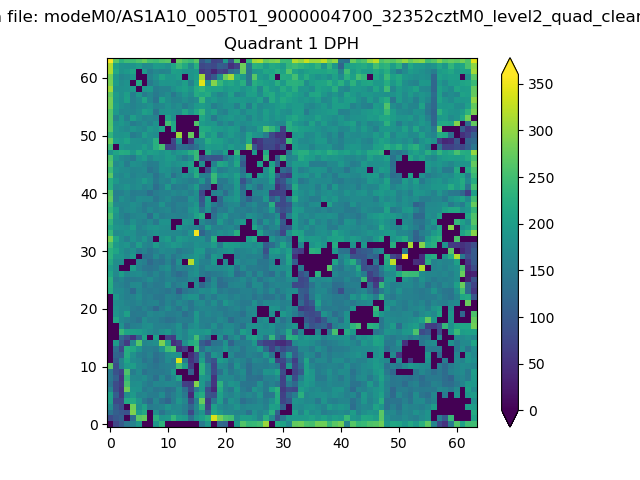 |
Quadrant B |
|---|---|---|---|
| Quadrant D | 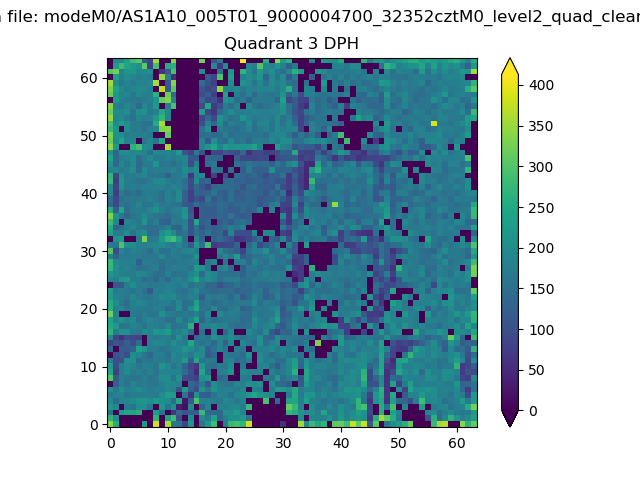 |
 |
Quadrant C |
| Plot type | Count rate plots | Images |
|---|---|---|
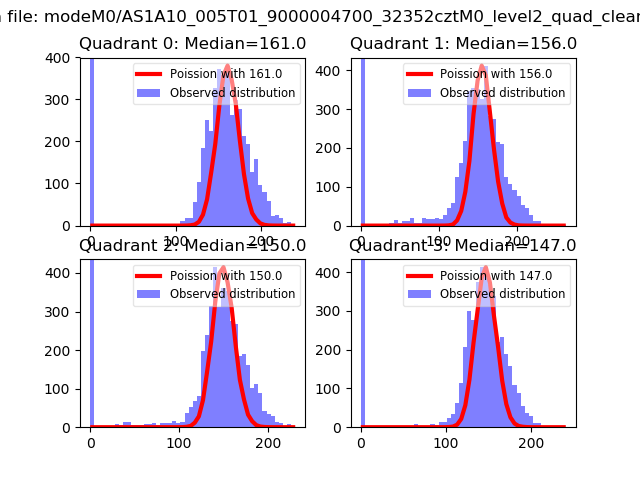
| Comparison with Poisson distribution Blue bars denote a histogram of data divided into 1 sec bins. Red curve is a Poisson curve with rate = median count rate of data. |
 |
 |
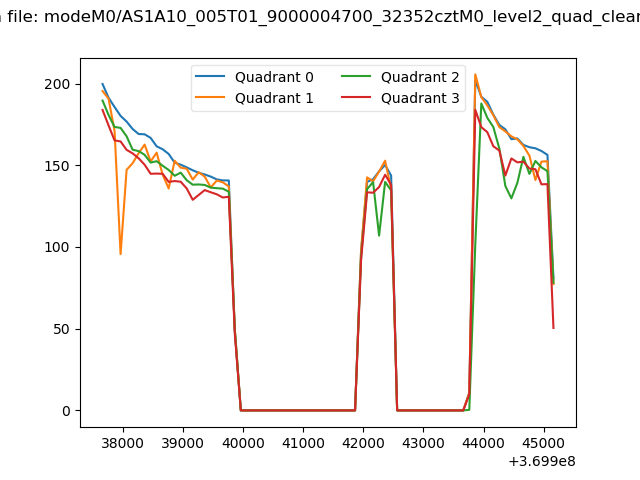
| Quadrant-wise count rates Data is divided into 100 sec bins |
 |
|
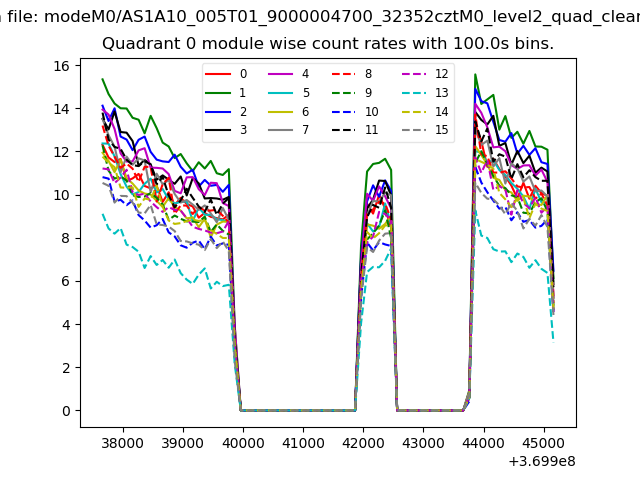
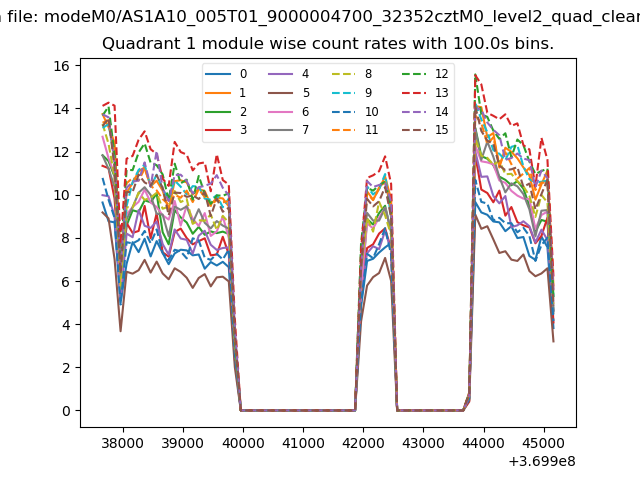
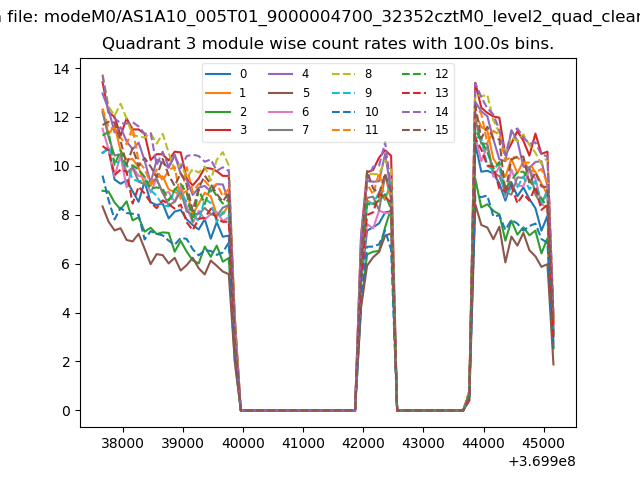
| Module-wise count rates for Quadrant A Data is divided into 100 sec bins |
 |
 |
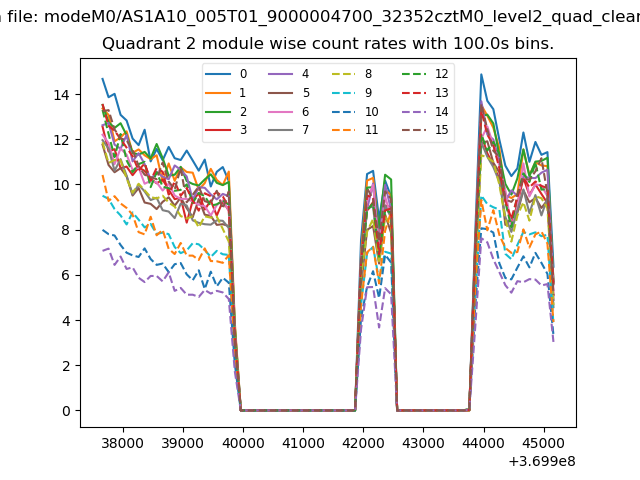
| Module-wise count rates for Quadrant B Data is divided into 100 sec bins |
 |
 |
| Module-wise count rates for Quadrant C Data is divided into 100 sec bins |
 |
 |
| Module-wise count rates for Quadrant D Data is divided into 100 sec bins |
 |
 |
| Parameter | Plot |
|---|---|
| CZT HV Monitor | 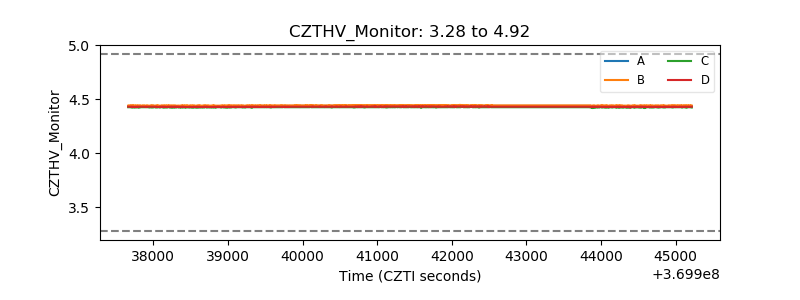 |
| D_VDD | 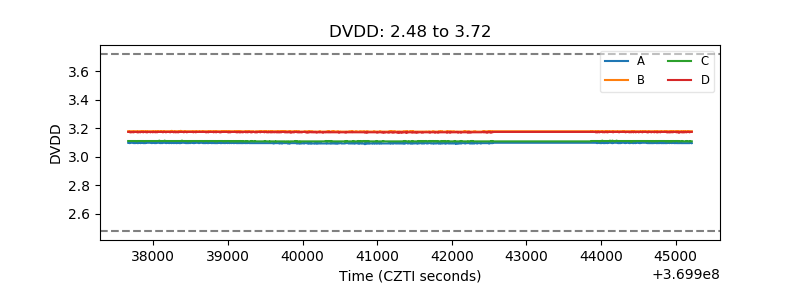 |
| Temperature 1 | 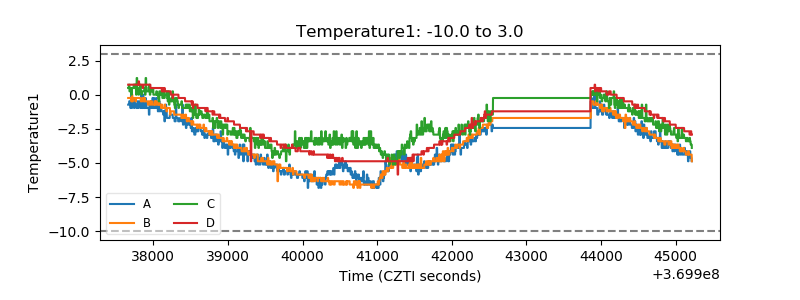 |
| Veto HV Monitor |  |
| Veto LLD | 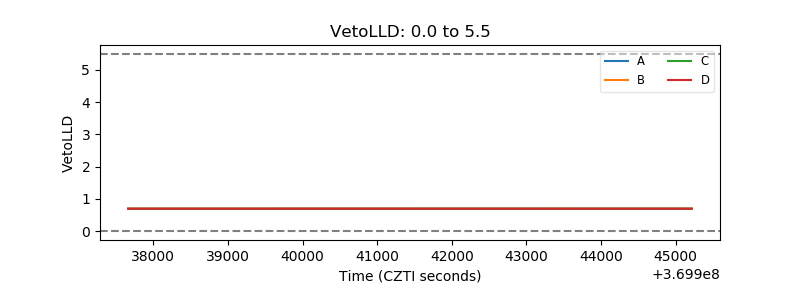 |
| Alpha Counter |  |
| _CPM_Rate | 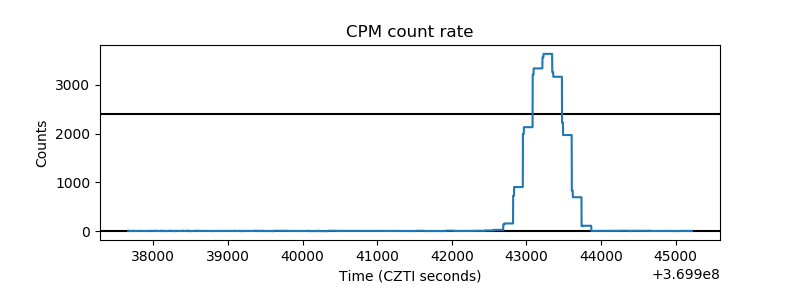 |
| CZT Counter |  |
| +2.5 Volts monitor |  |
| +5 Volts monitor |  |
| _ROLL_ROT | 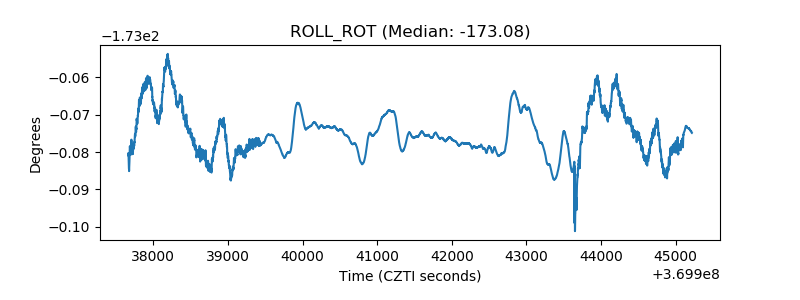 |
| _Roll_DEC | 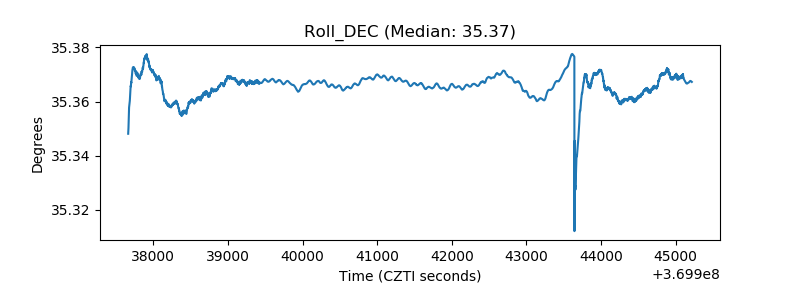 |
| _Roll_RA | 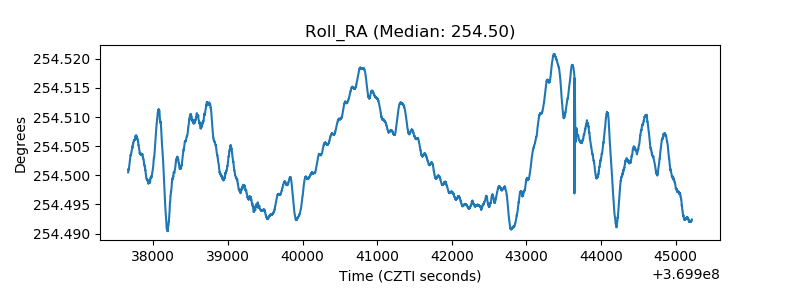 |
| Veto Counter | 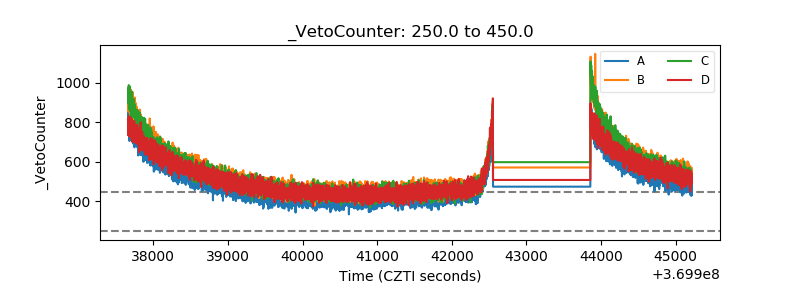 |