| Param | Original file | Final file |
|---|---|---|
| Filename | modeM0/AS1A10_053T10_9000004698cztM0_level2.fits | modeM0/AS1A10_053T10_9000004698cztM0_level2_quad_clean.evt |
| Size (bytes) | 118,820,160 | 53,147,520 |
| Size | 113.3 MB | 50.7 MB |
| Events in quadrant A | 786,336 | 213,690 |
| Events in quadrant B | 733,786 | 211,476 |
| Events in quadrant C | 636,544 | 200,956 |
| Events in quadrant D | 643,922 | 184,813 |
| Mode M0 | |||
|---|---|---|---|
| Quadrant | BADHDUFLAG | Total packets | Discarded packets |
| A | 0 | 24825 | 0 |
| B | 0 | 37202 | 0 |
| C | 0 | 27903 | 0 |
| D | 0 | 34131 | 0 |
| Mode SS | |||
|---|---|---|---|
| Quadrant | BADHDUFLAG | Total packets | Discarded packets |
| A | 0 | 236 | 0 |
| B | 0 | 236 | 0 |
| C | 0 | 236 | 0 |
| D | 0 | 236 | 0 |
| Mode M9 | |||
|---|---|---|---|
| Quadrant | BADHDUFLAG | Total packets | Discarded packets |
| A | 0 | 36 | 0 |
| B | 0 | 36 | 0 |
| C | 0 | 36 | 0 |
| D | 0 | 36 | 0 |
| Quadrant | Total seconds | Saturated seconds | Saturation percentage |
|---|---|---|---|
| A | 11522 | 159 | 1.379969% |
| B | 11522 | 399 | 3.462940% |
| C | 11522 | 2211 | 19.189377% |
| D | 11522 | 596 | 5.172713% |
Noise dominated data is calculated using 1-second bins in cleaned event files. If a bin has >2000 counts, and if more than 50% of those come from <1% of pixels, then it is considered to be noise-dominated and hence unusable.
| Quadrant | # 1 sec bins | Bins with >0 counts | Bins with >2000 counts | High rate bins dominated by noise | Noise dominated (total time) | Noise dominated (detector-on time) | Marked lightcurve |
|---|---|---|---|---|---|---|---|
| A | 15087 | 11522 | 0 | 0 | 0.00% | 0.00% | 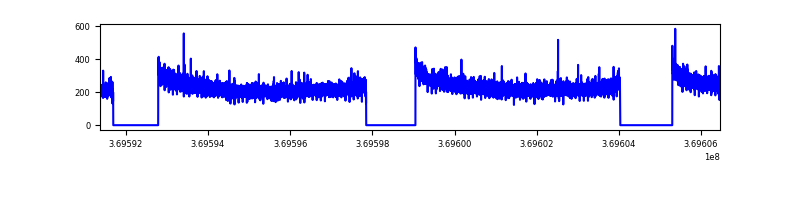 |
| B | 15087 | 11522 | 0 | 0 | 0.00% | 0.00% | 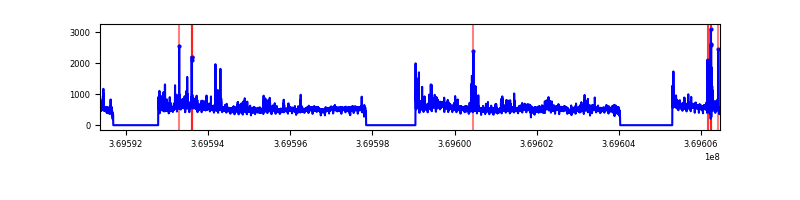 |
| C | 15087 | 11165 | 0 | 0 | 0.00% | 0.00% |  |
| D | 15087 | 11519 | 0 | 0 | 0.00% | 0.00% |  |
Top three noisy pixels from each quadrant. If the there are fewer than three noisy pixels in the level2.evt file, extra rows are filled as -1
| Pixel properties | Quadrant properties | ||||||
|---|---|---|---|---|---|---|---|
| Quadrant | DetID | PixID | Counts | Sigma | Mean | Median | Sigma |
| A | 0 | 29 | 777 | 11.29 | 204 | 193 | 51.7 |
| A | 0 | 30 | 594 | 7.75 | 204 | 193 | 51.7 |
| A | 7 | 110 | 575 | 7.38 | 204 | 193 | 51.7 |
| B | 2 | 9 | 532 | 8.51 | 194 | 186 | 40.6 |
| B | 3 | 17 | 501 | 7.75 | 194 | 186 | 40.6 |
| B | 5 | 232 | 476 | 7.14 | 194 | 186 | 40.6 |
| C | 1 | 80 | 471 | 7.04 | 168 | 158 | 44.4 |
| C | 1 | 81 | 467 | 6.95 | 168 | 158 | 44.4 |
| C | 12 | 241 | 447 | 6.5 | 168 | 158 | 44.4 |
| D | 7 | 3 | 498 | 6.65 | 183 | 167 | 49.8 |
| D | 10 | 189 | 470 | 6.08 | 183 | 167 | 49.8 |
| D | 3 | 14 | 461 | 5.9 | 183 | 167 | 49.8 |
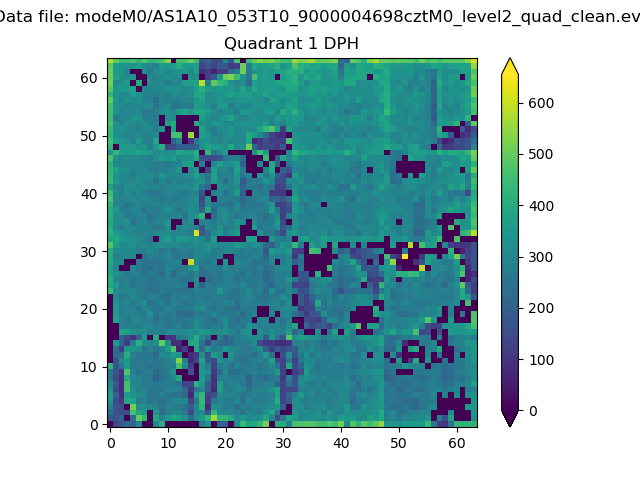
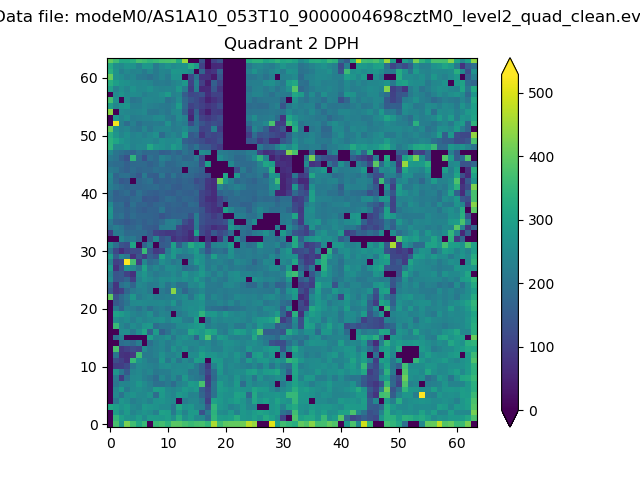
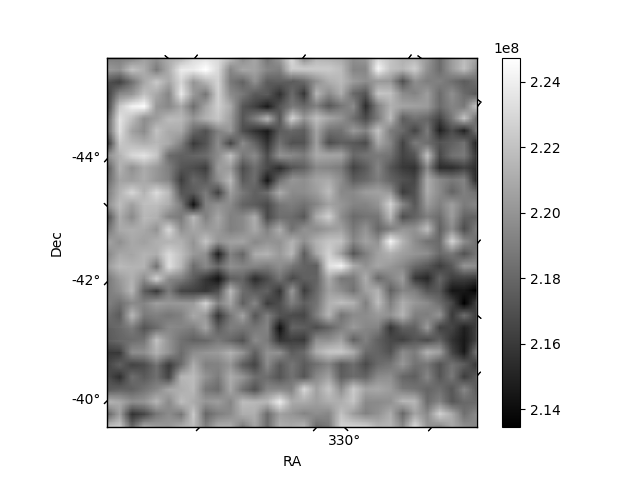
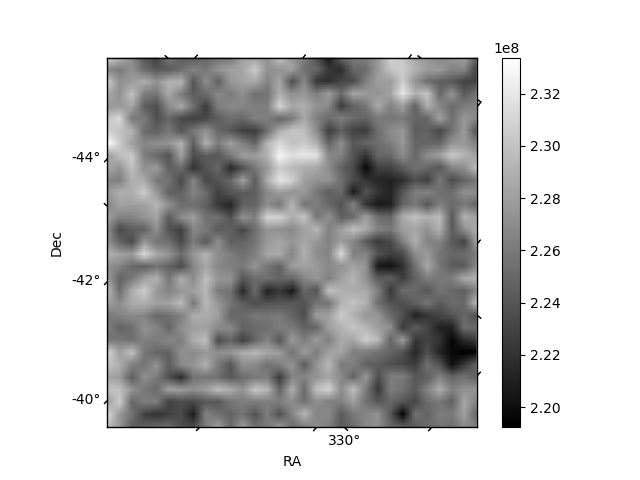
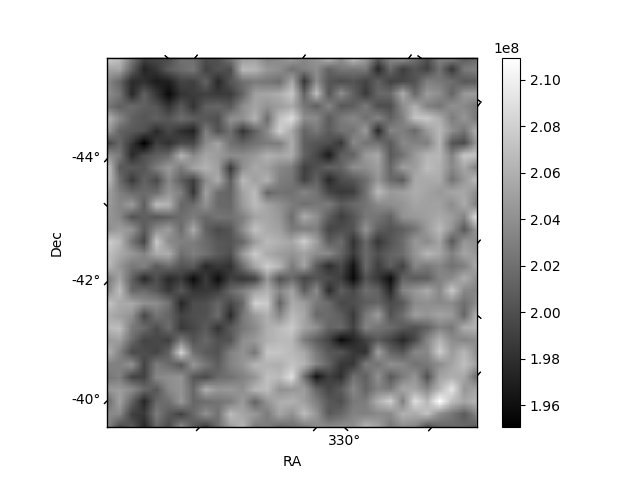
Histogram calculated using DETX and DETY for each event in the final _common_clean file
| Quadrant A |  |
 |
Quadrant B |
|---|---|---|---|
| Quadrant D |  |
 |
Quadrant C |
| Plot type | Count rate plots | Images |
|---|---|---|
| Comparison with Poisson distribution Blue bars denote a histogram of data divided into 1 sec bins. Red curve is a Poisson curve with rate = median count rate of data. |
 |
 |
| Quadrant-wise count rates Data is divided into 100 sec bins |
 |
|
| Module-wise count rates for Quadrant A Data is divided into 100 sec bins |
 |
 |
| Module-wise count rates for Quadrant B Data is divided into 100 sec bins |
 |
 |
| Module-wise count rates for Quadrant C Data is divided into 100 sec bins |
 |
 |
| Module-wise count rates for Quadrant D Data is divided into 100 sec bins |
 |
 |
| Parameter | Plot |
|---|---|
| CZT HV Monitor |  |
| D_VDD |  |
| Temperature 1 |  |
| Veto HV Monitor |  |
| Veto LLD |  |
| Alpha Counter |  |
| _CPM_Rate | 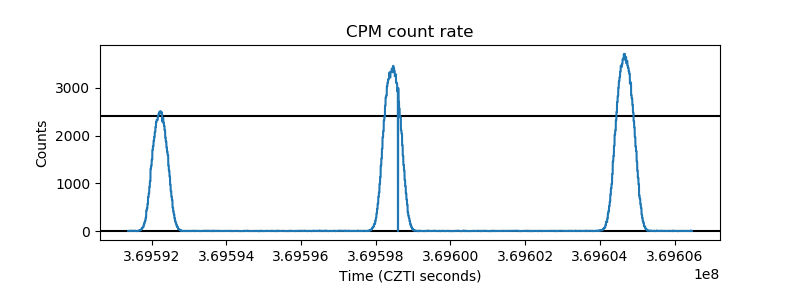 |
| CZT Counter |  |
| +2.5 Volts monitor |  |
| +5 Volts monitor |  |
| _ROLL_ROT |  |
| _Roll_DEC | 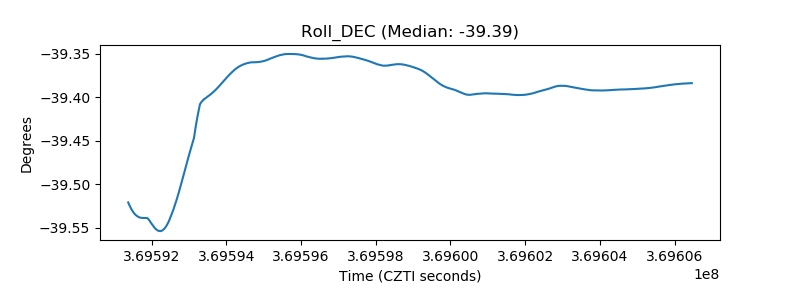 |
| _Roll_RA |  |
| Veto Counter |  |