| Param | Original file | Final file |
|---|---|---|
| Filename | modeM0/AS1A10_053T10_9000004698_32292cztM0_level2.evt | modeM0/AS1A10_053T10_9000004698_32292cztM0_level2_quad_clean.evt |
| Size (bytes) | 624,862,080 | 98,591,040 |
| Size | 595.9 MB | 94.0 MB |
| Events in quadrant A | 3,250,248 | 711,369 |
| Events in quadrant B | 5,484,962 | 710,386 |
| Events in quadrant C | 3,848,302 | 480,701 |
| Events in quadrant D | 5,902,260 | 631,714 |
| Mode M0 | |||
|---|---|---|---|
| Quadrant | BADHDUFLAG | Total packets | Discarded packets |
| A | 0 | 13856 | 2 |
| B | 0 | 20808 | 1 |
| C | 0 | 15855 | 1 |
| D | 0 | 21864 | 1 |
| Mode SS | |||
|---|---|---|---|
| Quadrant | BADHDUFLAG | Total packets | Discarded packets |
| A | 0 | 130 | 0 |
| B | 0 | 130 | 0 |
| C | 0 | 130 | 0 |
| D | 0 | 130 | 0 |
| Mode M9 | |||
|---|---|---|---|
| Quadrant | BADHDUFLAG | Total packets | Discarded packets |
| A | 0 | 12 | 0 |
| B | 0 | 12 | 0 |
| C | 0 | 12 | 0 |
| D | 0 | 12 | 0 |
| Quadrant | Total seconds | Saturated seconds | Saturation percentage |
|---|---|---|---|
| A | 6466 | 61 | 0.943396% |
| B | 6466 | 138 | 2.134241% |
| C | 6466 | 1965 | 30.389731% |
| D | 6466 | 453 | 7.005877% |
Noise dominated data is calculated using 1-second bins in cleaned event files. If a bin has >2000 counts, and if more than 50% of those come from <1% of pixels, then it is considered to be noise-dominated and hence unusable.
| Quadrant | # 1 sec bins | Bins with >0 counts | Bins with >2000 counts | High rate bins dominated by noise | Noise dominated (total time) | Noise dominated (detector-on time) | Marked lightcurve |
|---|---|---|---|---|---|---|---|
| A | 7666 | 6467 | 0 | 0 | 0.00% | 0.00% | 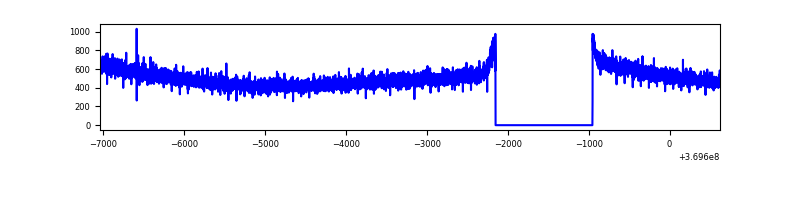 |
| B | 7666 | 6467 | 16 | 16 | 0.21% | 0.25% | 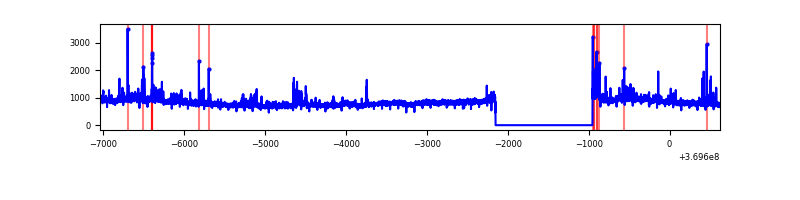 |
| C | 7666 | 6463 | 7 | 7 | 0.09% | 0.11% |  |
| D | 7666 | 6467 | 280 | 280 | 3.65% | 4.33% | 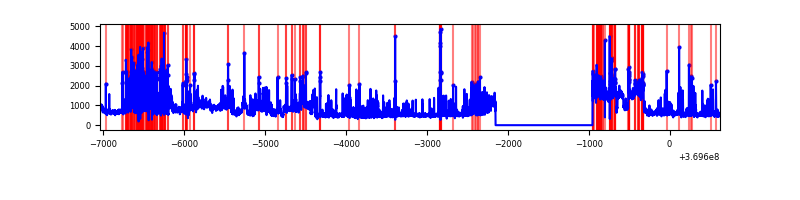 |
Top three noisy pixels from each quadrant. If the there are fewer than three noisy pixels in the level2.evt file, extra rows are filled as -1
| Pixel properties | Quadrant properties | ||||||
|---|---|---|---|---|---|---|---|
| Quadrant | DetID | PixID | Counts | Sigma | Mean | Median | Sigma |
| A | 13 | 254 | 12575 | 69.74 | 841 | 827 | 168.5 |
| A | 3 | 137 | 8153 | 43.49 | 841 | 827 | 168.5 |
| A | 13 | 6 | 7875 | 41.84 | 841 | 827 | 168.5 |
| B | 6 | 159 | 1852355 | 11760.39 | 832 | 814 | 157.4 |
| B | 0 | 190 | 192158 | 1215.36 | 832 | 814 | 157.4 |
| B | 5 | 172 | 66836 | 419.35 | 832 | 814 | 157.4 |
| C | 14 | 254 | 715719 | 5134.31 | 595 | 601 | 139.3 |
| C | 14 | 238 | 634810 | 4553.41 | 595 | 601 | 139.3 |
| C | 3 | 233 | 94216 | 672.12 | 595 | 601 | 139.3 |
| D | 8 | 195 | 1423366 | 7603.16 | 779 | 756 | 187.1 |
| D | 12 | 233 | 837131 | 4470.02 | 779 | 756 | 187.1 |
| D | 14 | 52 | 444974 | 2374.13 | 779 | 756 | 187.1 |
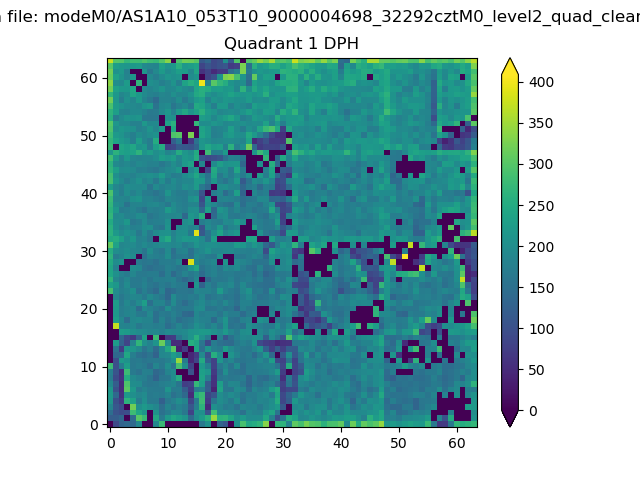
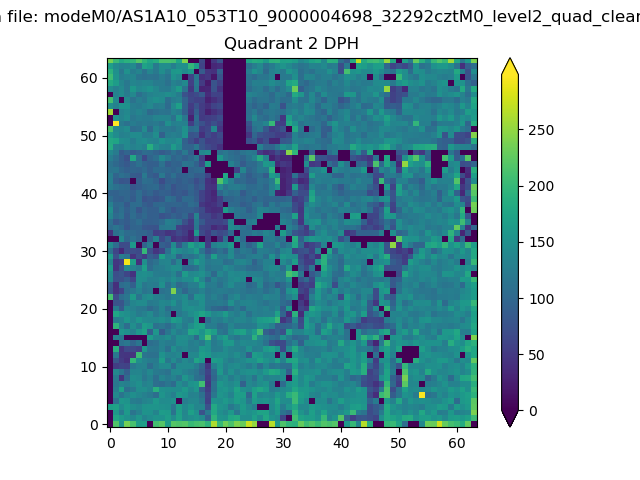
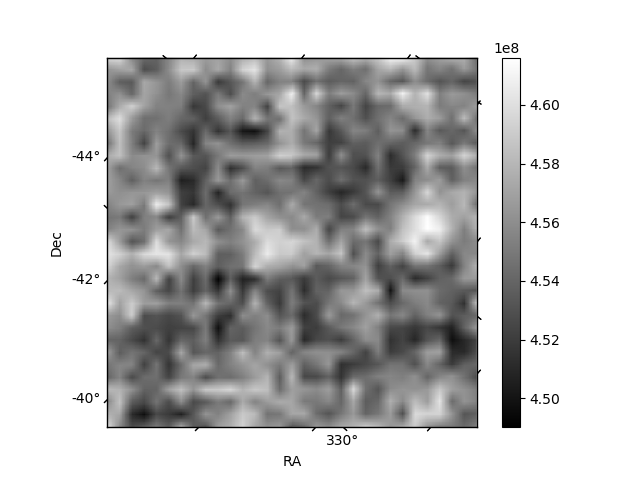
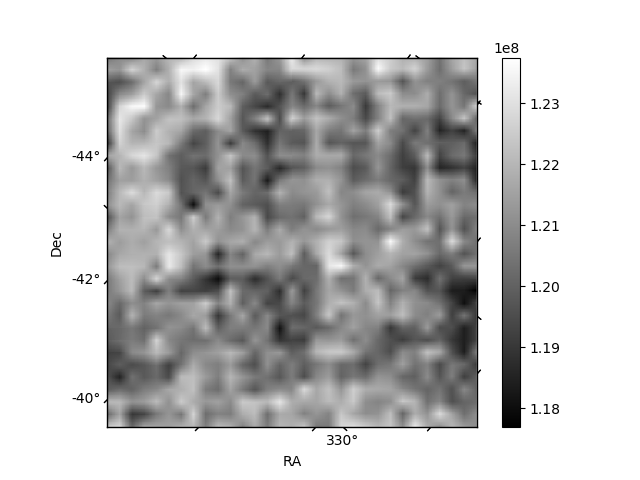
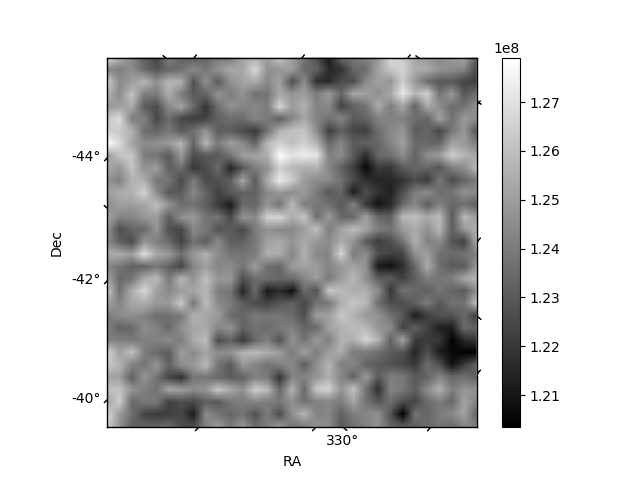
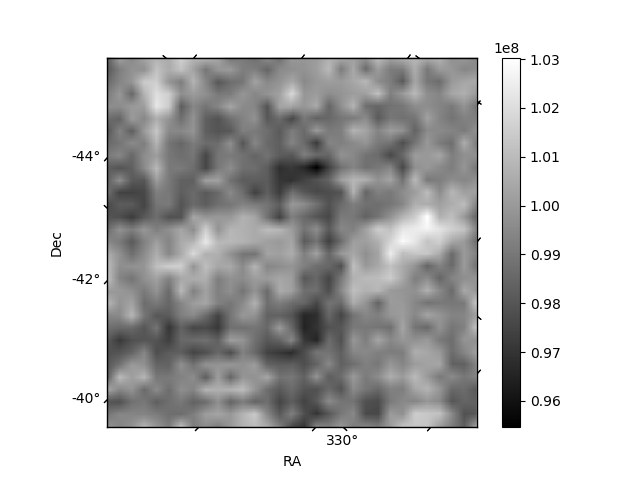
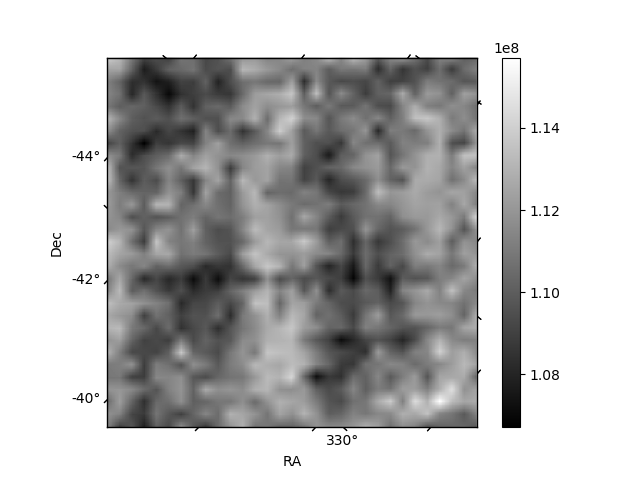
Histogram calculated using DETX and DETY for each event in the final _common_clean file
| Quadrant A | 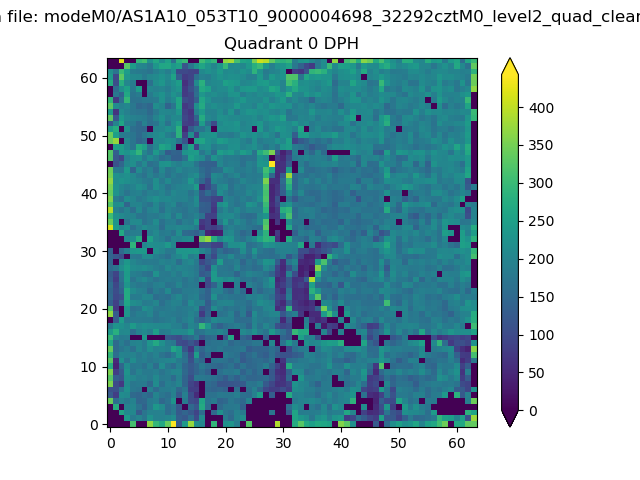 |
 |
Quadrant B |
|---|---|---|---|
| Quadrant D | 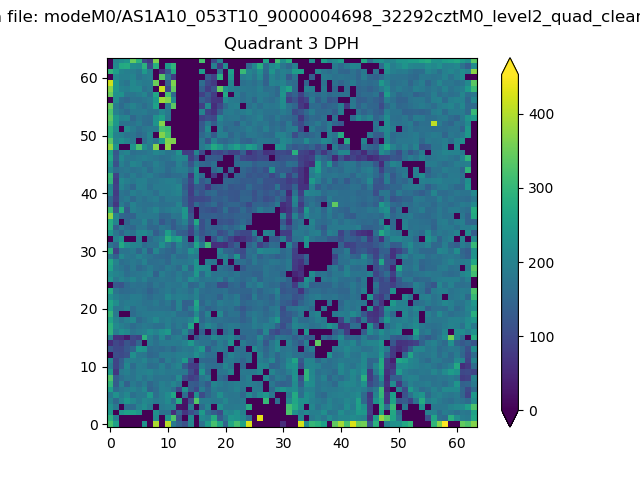 |
 |
Quadrant C |
| Plot type | Count rate plots | Images |
|---|---|---|
| Comparison with Poisson distribution Blue bars denote a histogram of data divided into 1 sec bins. Red curve is a Poisson curve with rate = median count rate of data. |
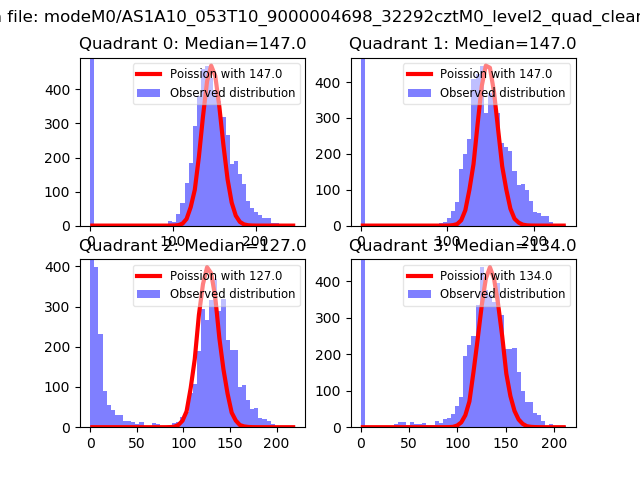 |
 |
| Quadrant-wise count rates Data is divided into 100 sec bins |
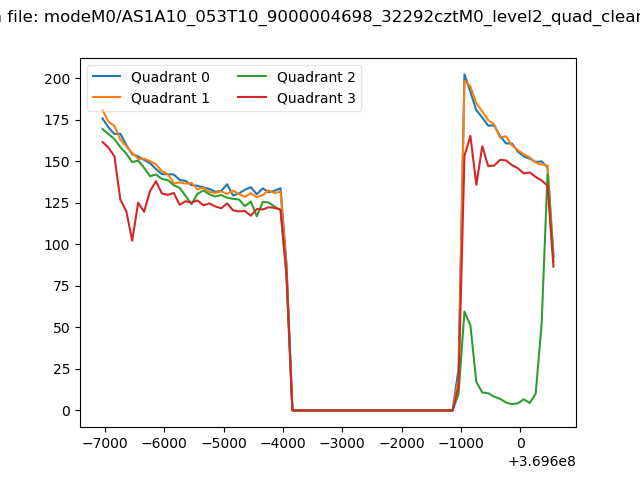 |
|
| Module-wise count rates for Quadrant A Data is divided into 100 sec bins |
 |
 |
| Module-wise count rates for Quadrant B Data is divided into 100 sec bins |
 |
 |
| Module-wise count rates for Quadrant C Data is divided into 100 sec bins |
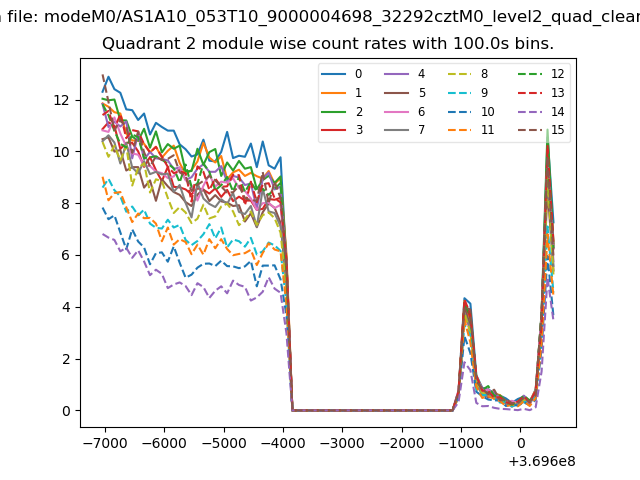 |
 |
| Module-wise count rates for Quadrant D Data is divided into 100 sec bins |
 |
 |
| Parameter | Plot |
|---|---|
| CZT HV Monitor | 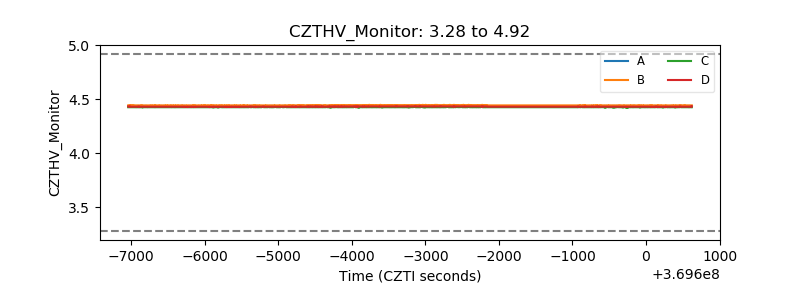 |
| D_VDD | 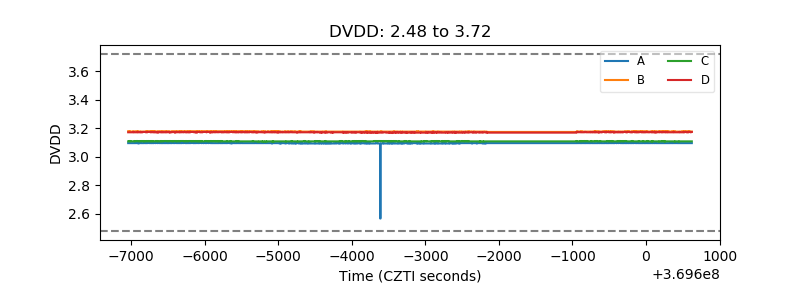 |
| Temperature 1 | 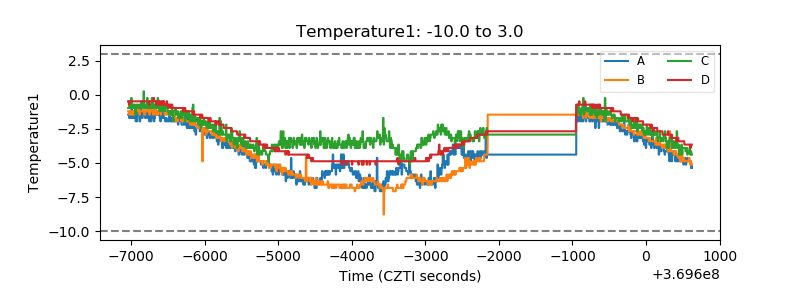 |
| Veto HV Monitor | 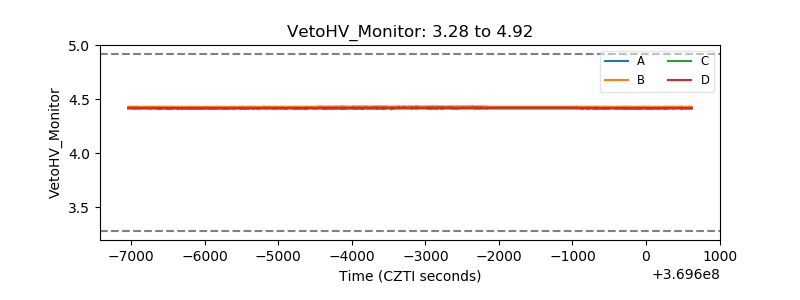 |
| Veto LLD |  |
| Alpha Counter | 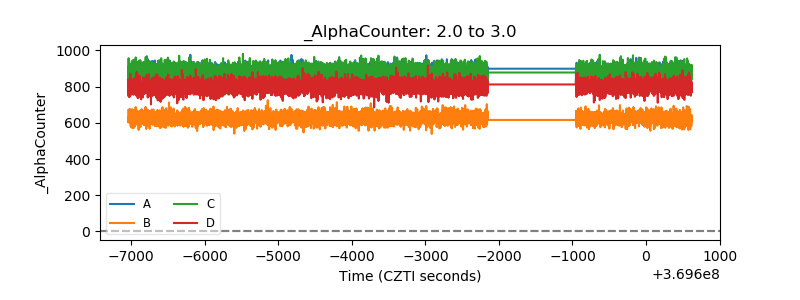 |
| _CPM_Rate | 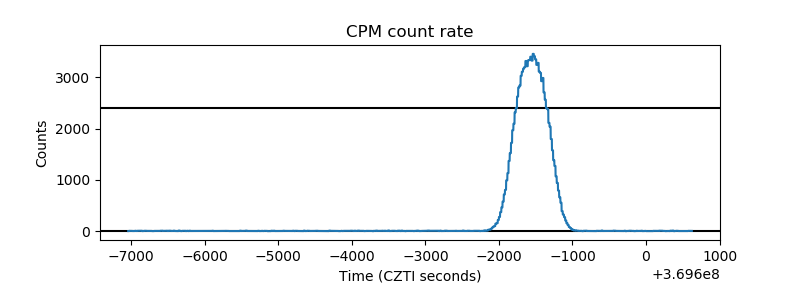 |
| CZT Counter | 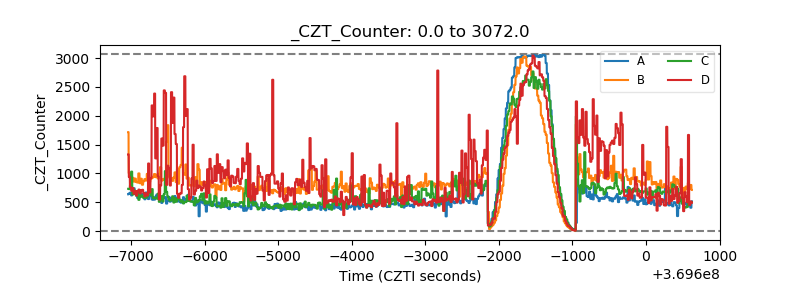 |
| +2.5 Volts monitor |  |
| +5 Volts monitor | 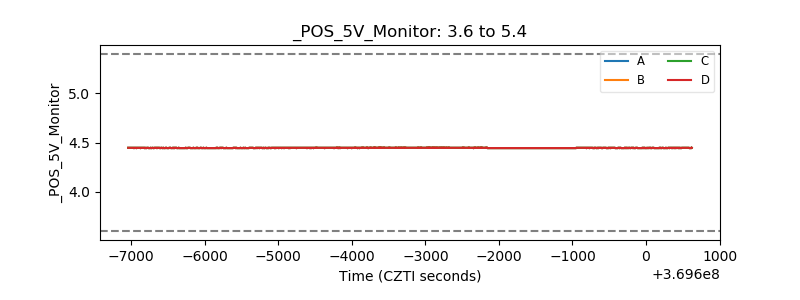 |
| _ROLL_ROT | 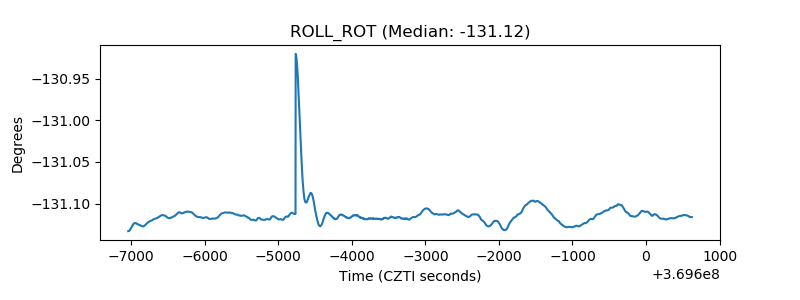 |
| _Roll_DEC | 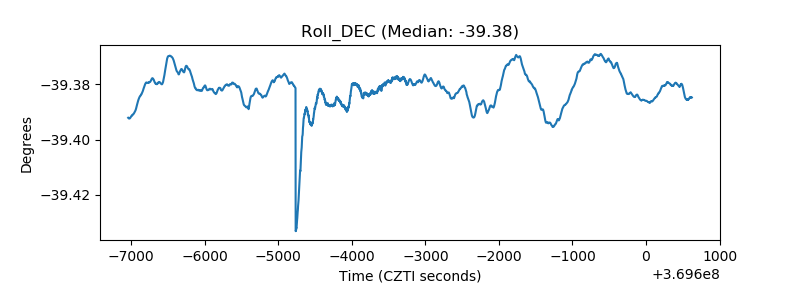 |
| _Roll_RA | 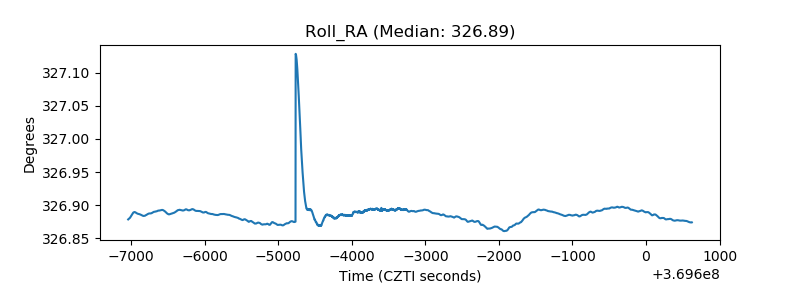 |
| Veto Counter |  |