| Param | Original file | Final file |
|---|---|---|
| Filename | modeM0/AS1A09_131T01_9000004702cztM0_level2.fits | modeM0/AS1A09_131T01_9000004702cztM0_level2_quad_clean.evt |
| Size (bytes) | 1,456,545,600 | 1,824,295,680 |
| Size | 1.4 GB | 1.7 GB |
| Events in quadrant A | 9,080,752 | 11,830,057 |
| Events in quadrant B | 8,345,332 | 11,467,970 |
| Events in quadrant C | 8,630,988 | 11,161,867 |
| Events in quadrant D | 7,672,170 | 10,426,708 |
| Mode M0 | |||
|---|---|---|---|
| Quadrant | BADHDUFLAG | Total packets | Discarded packets |
| A | 0 | 335454 | 0 |
| B | 0 | 536767 | 0 |
| C | 0 | 414549 | 0 |
| D | 0 | 461793 | 0 |
| Mode SS | |||
|---|---|---|---|
| Quadrant | BADHDUFLAG | Total packets | Discarded packets |
| A | 0 | 3080 | 0 |
| B | 0 | 3080 | 0 |
| C | 0 | 3080 | 0 |
| D | 0 | 3080 | 0 |
| Mode M9 | |||
|---|---|---|---|
| Quadrant | BADHDUFLAG | Total packets | Discarded packets |
| A | 0 | 247 | 0 |
| B | 0 | 247 | 0 |
| C | 0 | 247 | 0 |
| D | 0 | 247 | 0 |
| Quadrant | Total seconds | Saturated seconds | Saturation percentage |
|---|---|---|---|
| A | 151330 | 4029 | 2.662393% |
| B | 151330 | 13300 | 8.788740% |
| C | 151330 | 14243 | 9.411881% |
| D | 151330 | 8254 | 5.454305% |
Noise dominated data is calculated using 1-second bins in cleaned event files. If a bin has >2000 counts, and if more than 50% of those come from <1% of pixels, then it is considered to be noise-dominated and hence unusable.
| Quadrant | # 1 sec bins | Bins with >0 counts | Bins with >2000 counts | High rate bins dominated by noise | Noise dominated (total time) | Noise dominated (detector-on time) | Marked lightcurve |
|---|---|---|---|---|---|---|---|
| A | 175810 | 150778 | 0 | 0 | 0.00% | 0.00% |  |
| B | 175809 | 151244 | 0 | 0 | 0.00% | 0.00% | 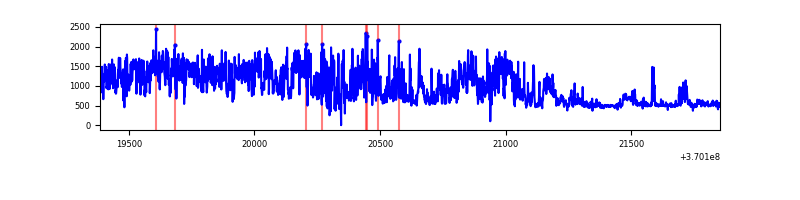 |
| C | 175810 | 151084 | 0 | 0 | 0.00% | 0.00% | 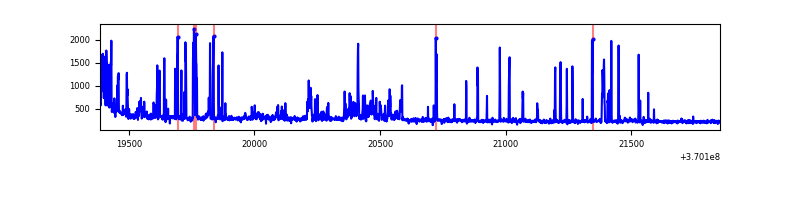 |
| D | 175810 | 151190 | 0 | 0 | 0.00% | 0.00% |  |
Top three noisy pixels from each quadrant. If the there are fewer than three noisy pixels in the level2.evt file, extra rows are filled as -1
| Pixel properties | Quadrant properties | ||||||
|---|---|---|---|---|---|---|---|
| Quadrant | DetID | PixID | Counts | Sigma | Mean | Median | Sigma |
| A | 0 | 29 | 8952 | 11.63 | 2370 | 2241 | 577.1 |
| A | 7 | 110 | 7299 | 8.76 | 2370 | 2241 | 577.1 |
| A | 0 | 30 | 7041 | 8.32 | 2370 | 2241 | 577.1 |
| B | 2 | 9 | 6794 | 10.82 | 2215 | 2123 | 431.7 |
| B | 3 | 80 | 5761 | 8.43 | 2215 | 2123 | 431.7 |
| B | 2 | 8 | 5596 | 8.04 | 2215 | 2123 | 431.7 |
| C | 12 | 241 | 6009 | 6.73 | 2288 | 2157 | 571.9 |
| C | 3 | 187 | 5926 | 6.59 | 2288 | 2157 | 571.9 |
| C | 3 | 126 | 5915 | 6.57 | 2288 | 2157 | 571.9 |
| D | 10 | 189 | 5877 | 6.67 | 2198 | 2009 | 580.3 |
| D | 3 | 14 | 5555 | 6.11 | 2198 | 2009 | 580.3 |
| D | 6 | 67 | 5529 | 6.07 | 2198 | 2009 | 580.3 |
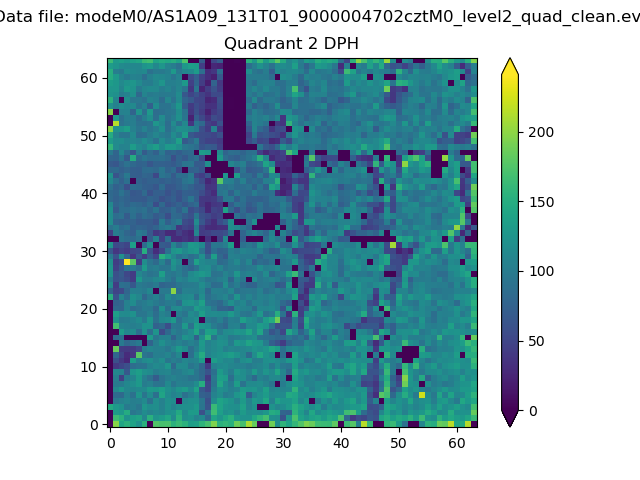
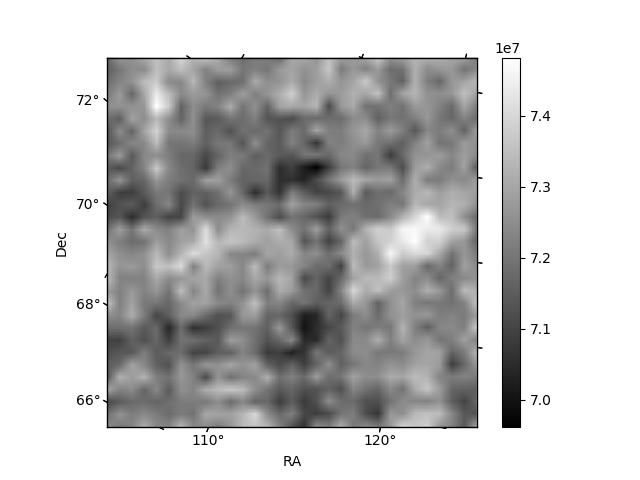
Histogram calculated using DETX and DETY for each event in the final _common_clean file
| Quadrant A |  |
 |
Quadrant B |
|---|---|---|---|
| Quadrant D |  |
 |
Quadrant C |
| Plot type | Count rate plots | Images |
|---|---|---|
| Comparison with Poisson distribution Blue bars denote a histogram of data divided into 1 sec bins. Red curve is a Poisson curve with rate = median count rate of data. |
 |
 |
| Quadrant-wise count rates Data is divided into 100 sec bins |
 |
|
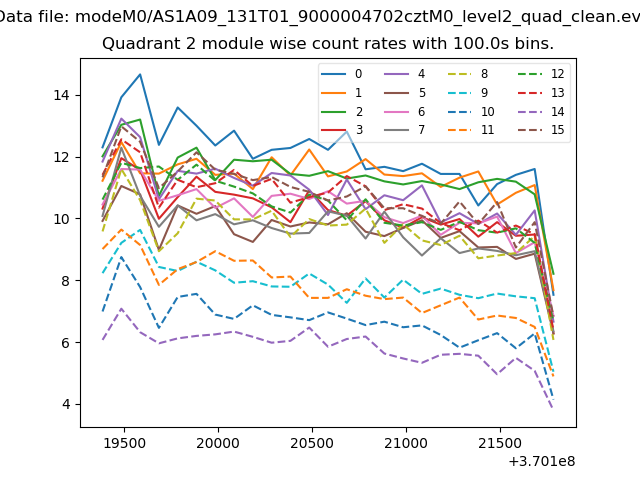
| Module-wise count rates for Quadrant A Data is divided into 100 sec bins |
 |
 |
| Module-wise count rates for Quadrant B Data is divided into 100 sec bins |
 |
 |
| Module-wise count rates for Quadrant C Data is divided into 100 sec bins |
 |
 |
| Module-wise count rates for Quadrant D Data is divided into 100 sec bins |
 |
 |
| Parameter | Plot |
|---|---|
| CZT HV Monitor |  |
| D_VDD | 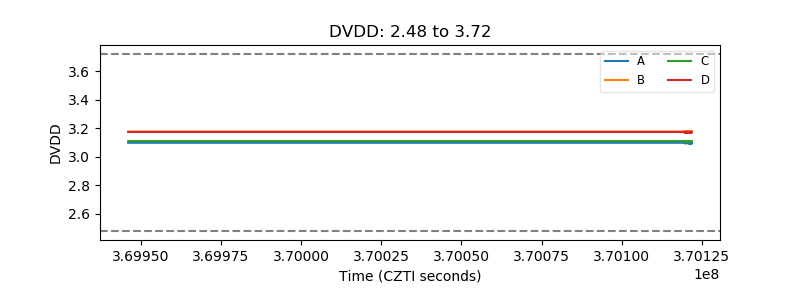 |
| Temperature 1 | 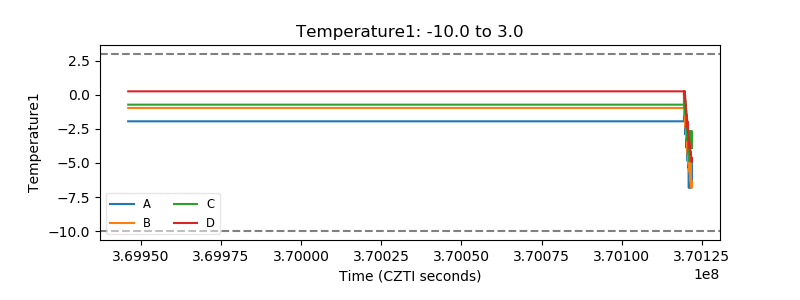 |
| Veto HV Monitor |  |
| Veto LLD |  |
| Alpha Counter |  |
| _CPM_Rate |  |
| CZT Counter |  |
| +2.5 Volts monitor |  |
| +5 Volts monitor |  |
| _ROLL_ROT |  |
| _Roll_DEC |  |
| _Roll_RA |  |
| Veto Counter |  |