| Param | Original file | Final file |
|---|---|---|
| Filename | modeM0/AS1A09_131T01_9000004702_32352cztM0_level2.evt | modeM0/AS1A09_131T01_9000004702_32352cztM0_level2_quad_clean.evt |
| Size (bytes) | 396,043,200 | 83,059,200 |
| Size | 377.7 MB | 79.2 MB |
| Events in quadrant A | 2,224,594 | 570,582 |
| Events in quadrant B | 3,620,690 | 572,554 |
| Events in quadrant C | 2,671,146 | 546,188 |
| Events in quadrant D | 3,198,127 | 535,882 |
| Mode M0 | |||
|---|---|---|---|
| Quadrant | BADHDUFLAG | Total packets | Discarded packets |
| A | 0 | 9389 | 2 |
| B | 0 | 13907 | 1 |
| C | 0 | 10714 | 1 |
| D | 0 | 12164 | 1 |
| Mode SS | |||
|---|---|---|---|
| Quadrant | BADHDUFLAG | Total packets | Discarded packets |
| A | 0 | 86 | 0 |
| B | 0 | 86 | 0 |
| C | 0 | 86 | 0 |
| D | 0 | 86 | 0 |
| Mode M9 | |||
|---|---|---|---|
| Quadrant | BADHDUFLAG | Total packets | Discarded packets |
| A | 0 | 13 | 0 |
| B | 0 | 13 | 0 |
| C | 0 | 13 | 0 |
| D | 0 | 13 | 0 |
| Quadrant | Total seconds | Saturated seconds | Saturation percentage |
|---|---|---|---|
| A | 4107 | 70 | 1.704407% |
| B | 4107 | 255 | 6.208912% |
| C | 4107 | 438 | 10.664719% |
| D | 4107 | 251 | 6.111517% |
Noise dominated data is calculated using 1-second bins in cleaned event files. If a bin has >2000 counts, and if more than 50% of those come from <1% of pixels, then it is considered to be noise-dominated and hence unusable.
| Quadrant | # 1 sec bins | Bins with >0 counts | Bins with >2000 counts | High rate bins dominated by noise | Noise dominated (total time) | Noise dominated (detector-on time) | Marked lightcurve |
|---|---|---|---|---|---|---|---|
| A | 5427 | 4108 | 0 | 0 | 0.00% | 0.00% | 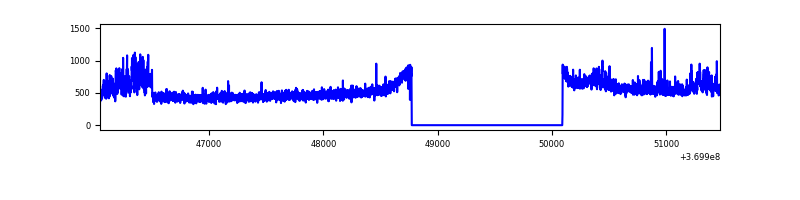 |
| B | 5427 | 4108 | 70 | 70 | 1.29% | 1.70% | 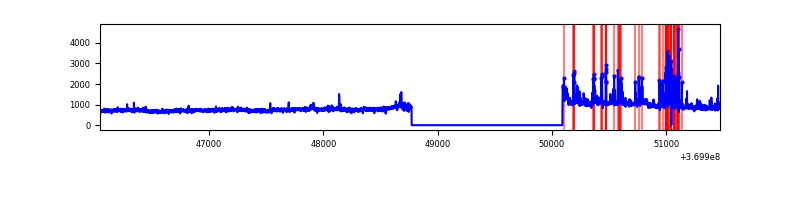 |
| C | 5427 | 4108 | 43 | 43 | 0.79% | 1.05% |  |
| D | 5427 | 4108 | 152 | 152 | 2.80% | 3.70% | 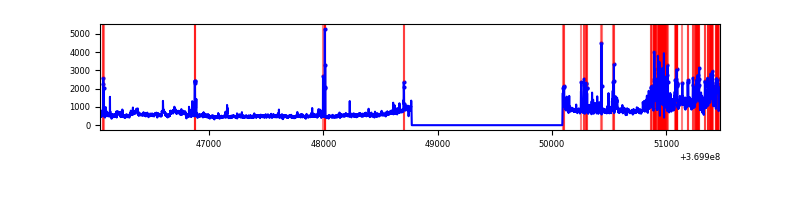 |
Top three noisy pixels from each quadrant. If the there are fewer than three noisy pixels in the level2.evt file, extra rows are filled as -1
| Pixel properties | Quadrant properties | ||||||
|---|---|---|---|---|---|---|---|
| Quadrant | DetID | PixID | Counts | Sigma | Mean | Median | Sigma |
| A | 12 | 189 | 179990 | 1696.64 | 526 | 517 | 105.8 |
| A | 13 | 6 | 10672 | 96.0 | 526 | 517 | 105.8 |
| A | 13 | 254 | 8368 | 74.22 | 526 | 517 | 105.8 |
| B | 6 | 159 | 1226411 | 12601.22 | 520 | 509 | 97.3 |
| B | 5 | 172 | 241317 | 2475.3 | 520 | 509 | 97.3 |
| B | 0 | 190 | 31164 | 315.11 | 520 | 509 | 97.3 |
| C | 0 | 10 | 309924 | 2747.58 | 487 | 491 | 112.6 |
| C | 14 | 238 | 159403 | 1411.04 | 487 | 491 | 112.6 |
| C | 14 | 254 | 116630 | 1031.25 | 487 | 491 | 112.6 |
| D | 8 | 195 | 591317 | 5049.2 | 503 | 492 | 117.0 |
| D | 13 | 249 | 260374 | 2220.96 | 503 | 492 | 117.0 |
| D | 7 | 38 | 159434 | 1358.32 | 503 | 492 | 117.0 |
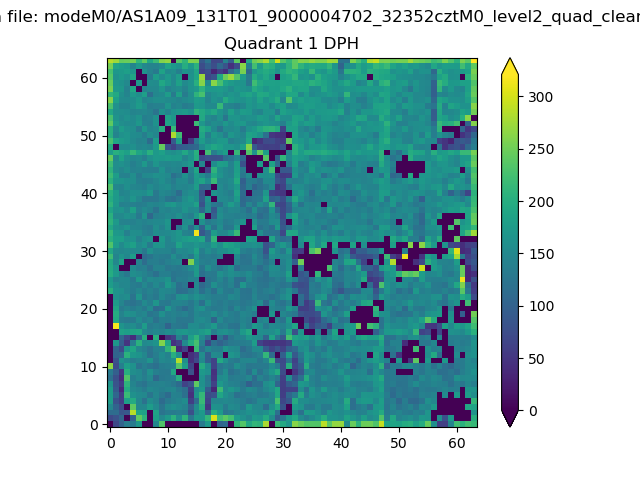
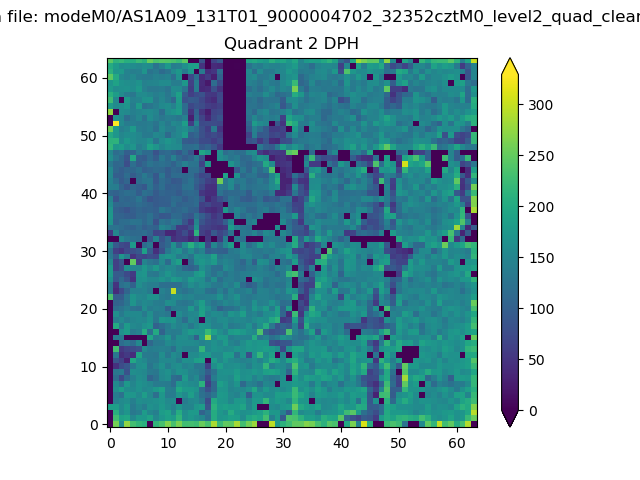
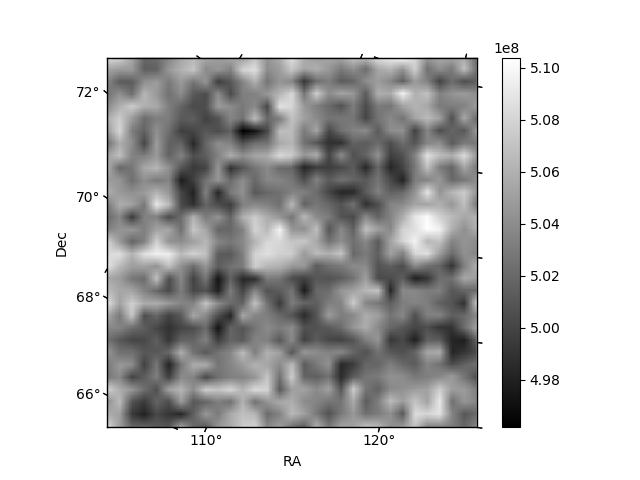
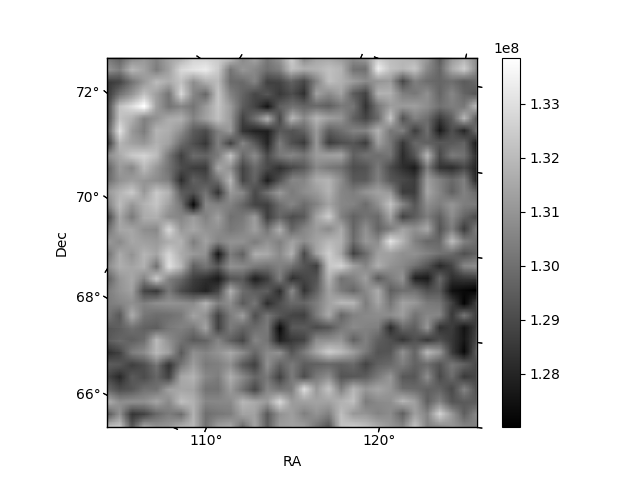
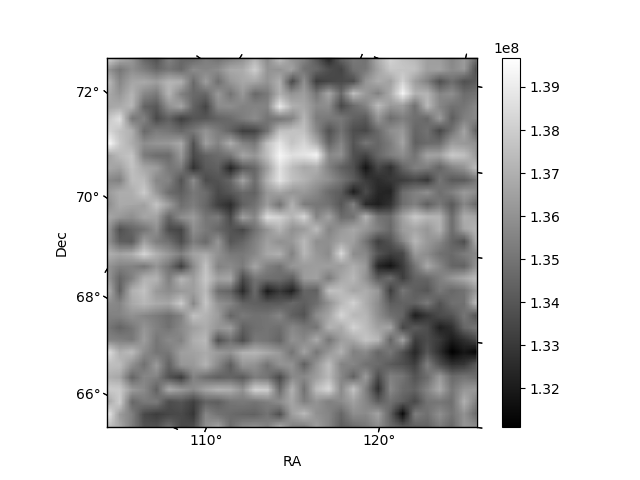
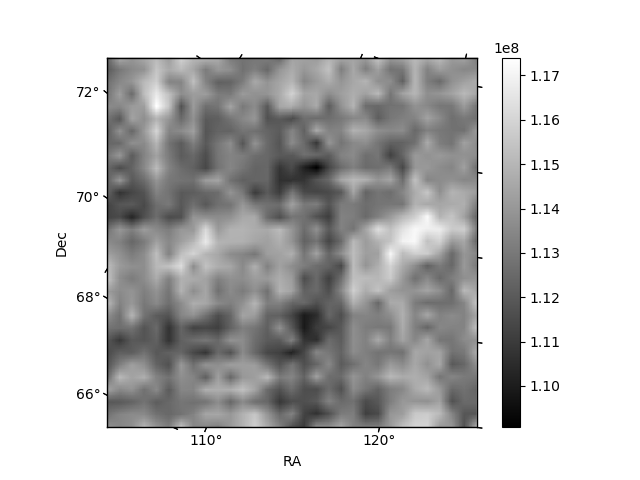
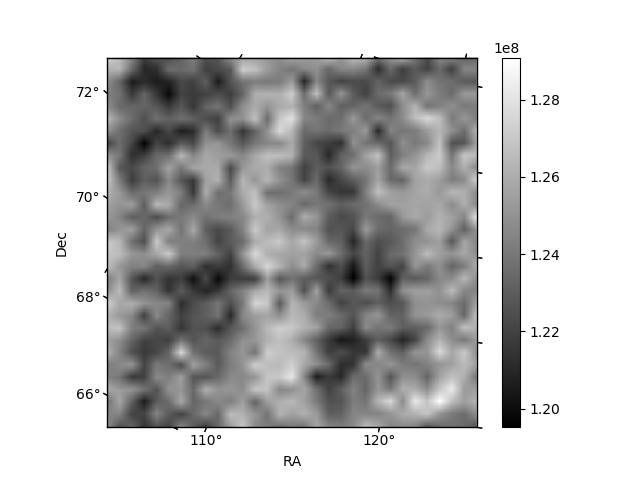
Histogram calculated using DETX and DETY for each event in the final _common_clean file
| Quadrant A | 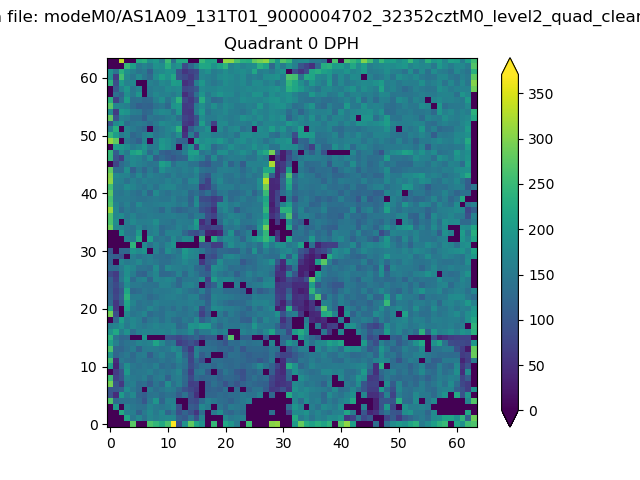 |
 |
Quadrant B |
|---|---|---|---|
| Quadrant D | 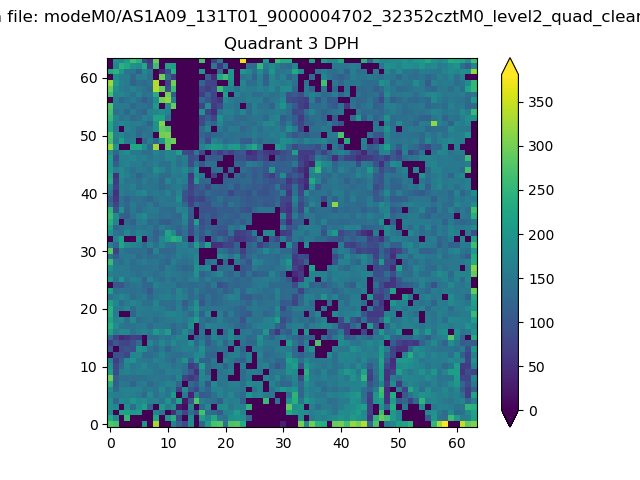 |
 |
Quadrant C |
| Plot type | Count rate plots | Images |
|---|---|---|
| Comparison with Poisson distribution Blue bars denote a histogram of data divided into 1 sec bins. Red curve is a Poisson curve with rate = median count rate of data. |
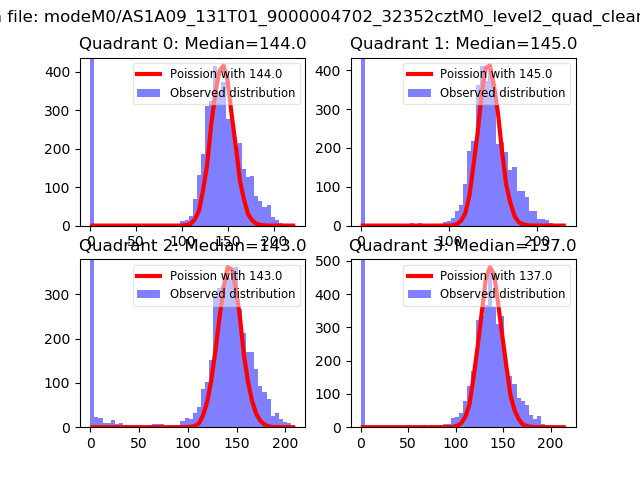 |
 |
| Quadrant-wise count rates Data is divided into 100 sec bins |
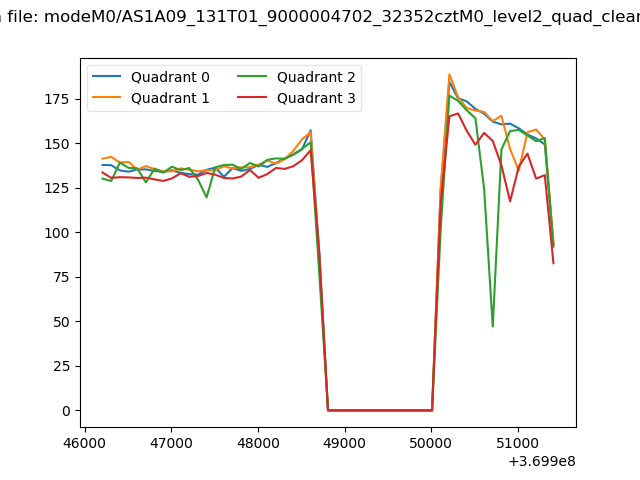 |
|
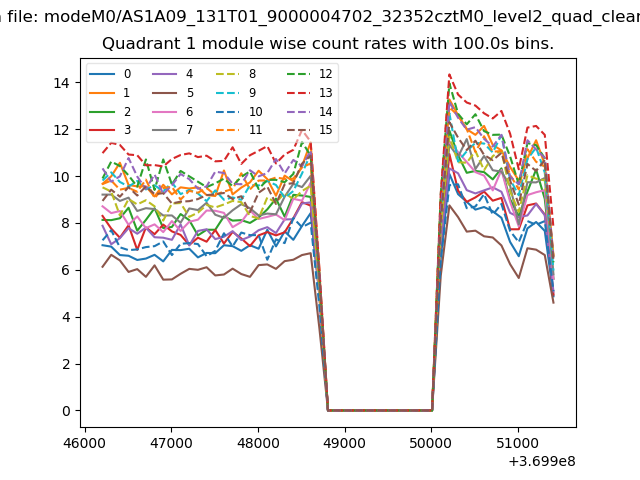
| Module-wise count rates for Quadrant A Data is divided into 100 sec bins |
 |
 |
| Module-wise count rates for Quadrant B Data is divided into 100 sec bins |
 |
 |
| Module-wise count rates for Quadrant C Data is divided into 100 sec bins |
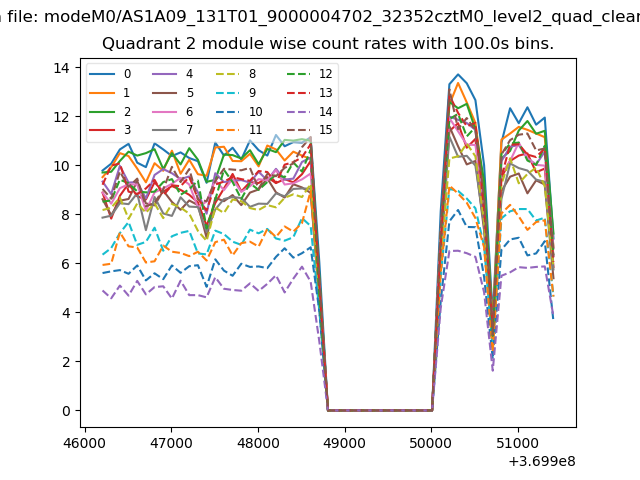 |
 |
| Module-wise count rates for Quadrant D Data is divided into 100 sec bins |
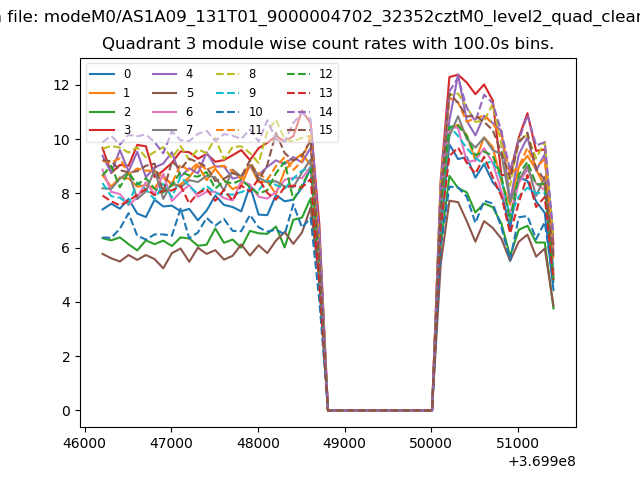 |
 |
| Parameter | Plot |
|---|---|
| CZT HV Monitor | 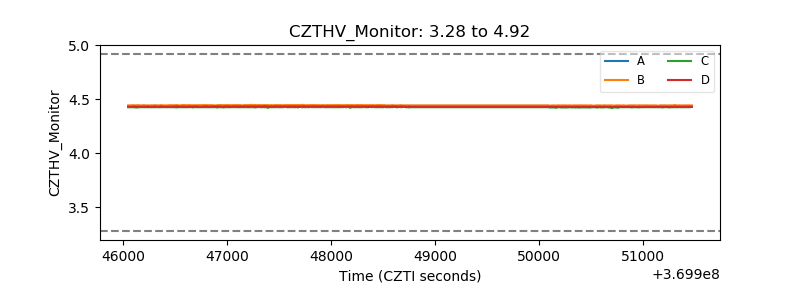 |
| D_VDD | 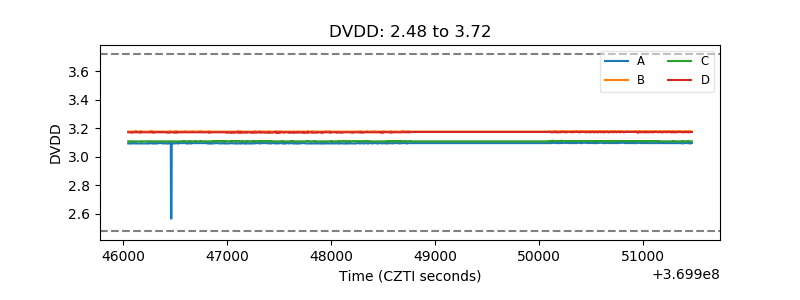 |
| Temperature 1 | 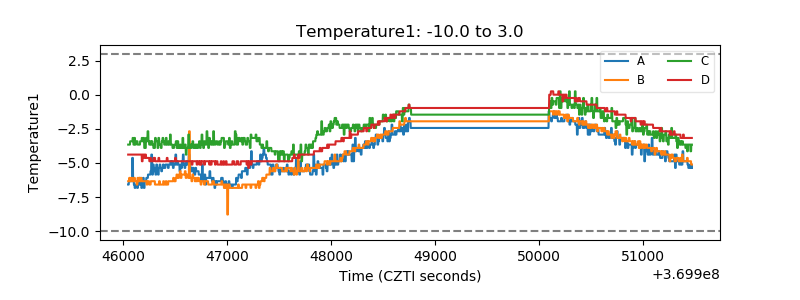 |
| Veto HV Monitor |  |
| Veto LLD | 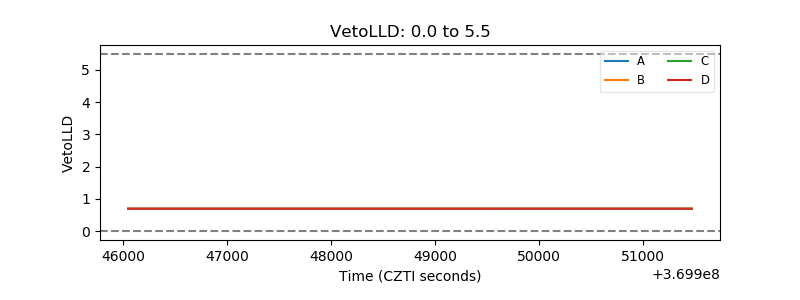 |
| Alpha Counter | 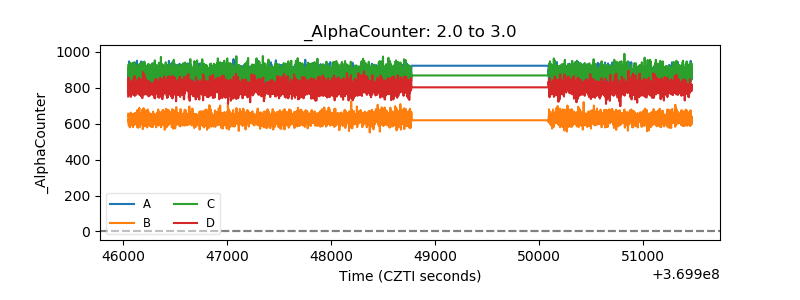 |
| _CPM_Rate | 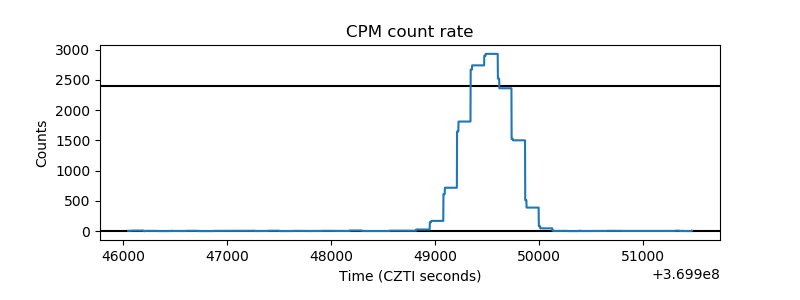 |
| CZT Counter | 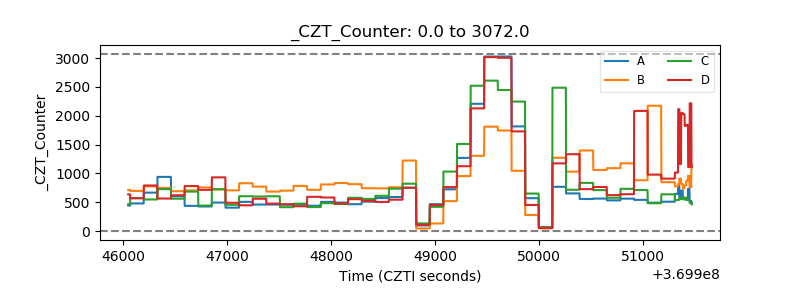 |
| +2.5 Volts monitor | 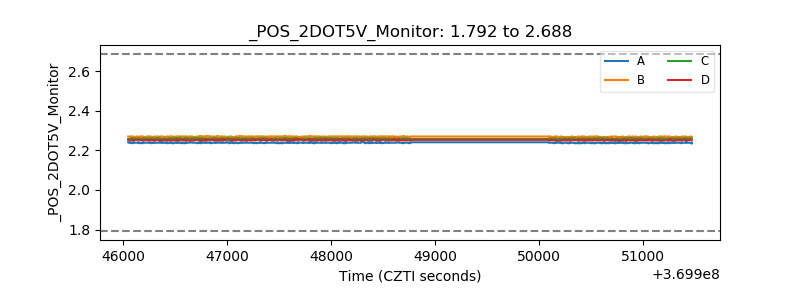 |
| +5 Volts monitor |  |
| _ROLL_ROT | 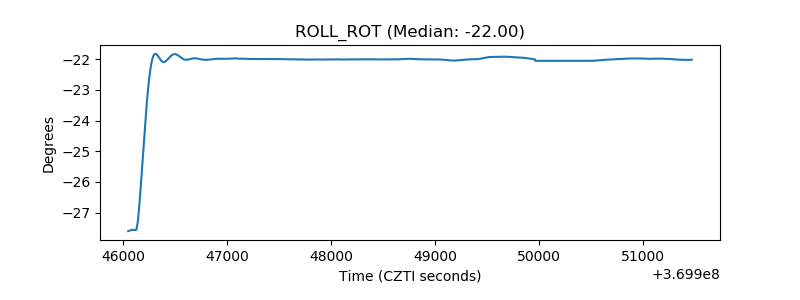 |
| _Roll_DEC | 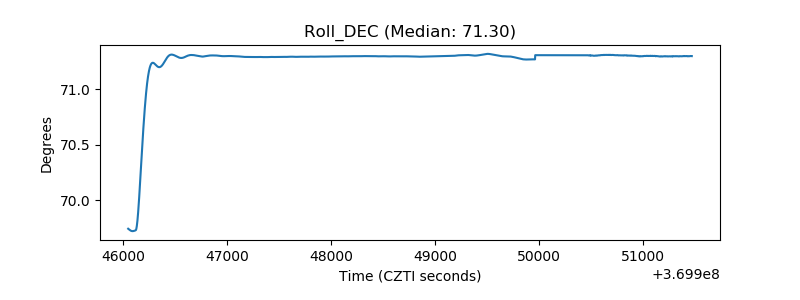 |
| _Roll_RA | 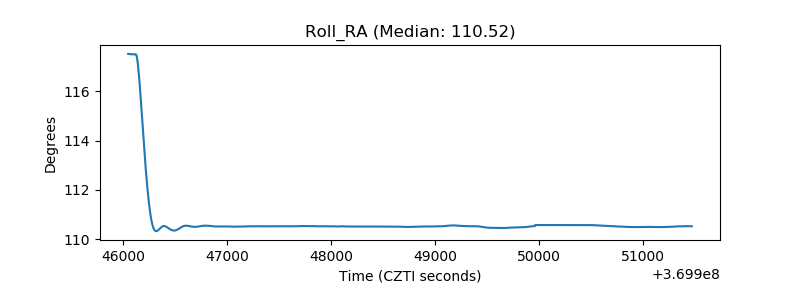 |
| Veto Counter | 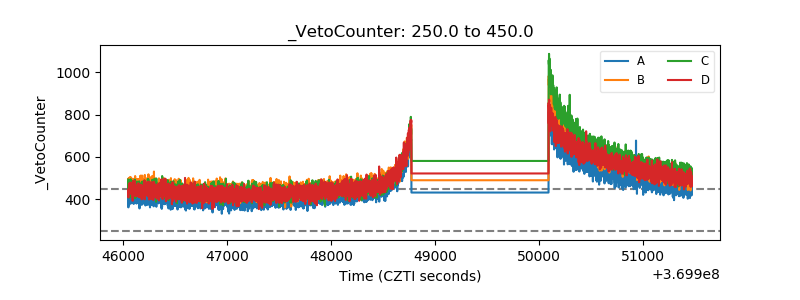 |